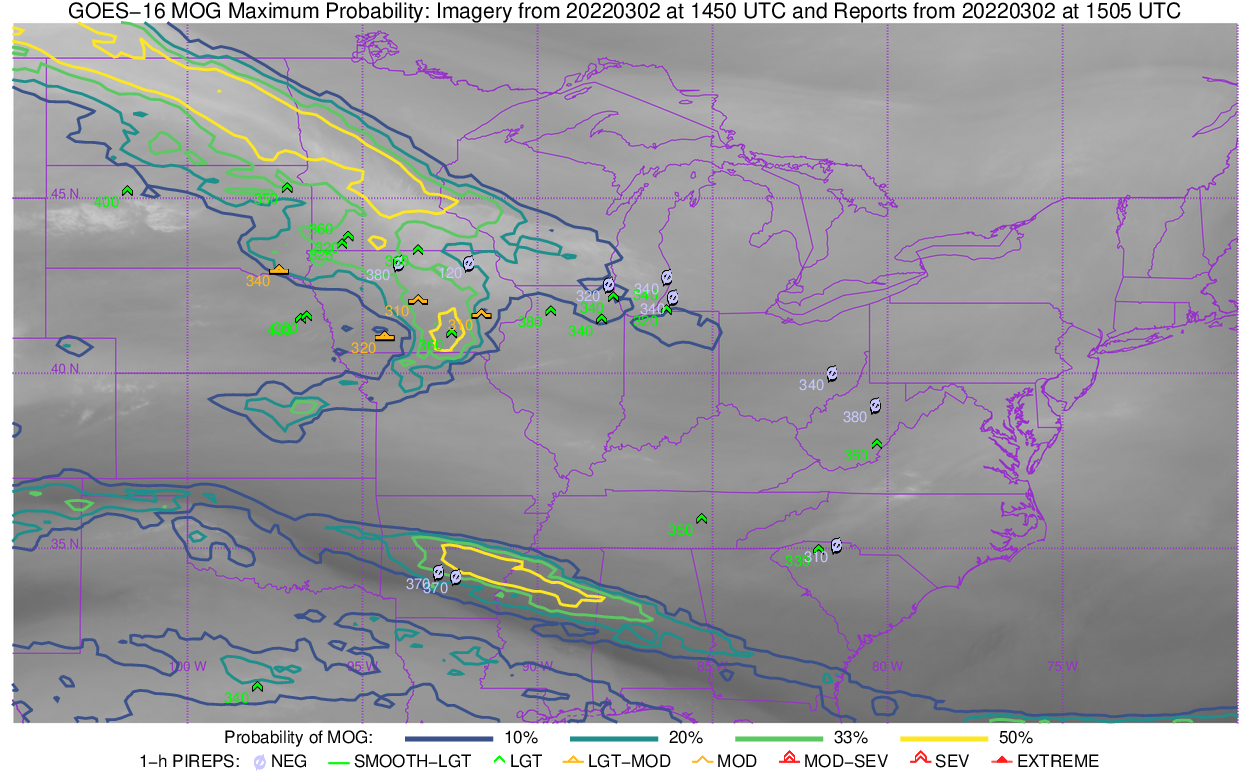
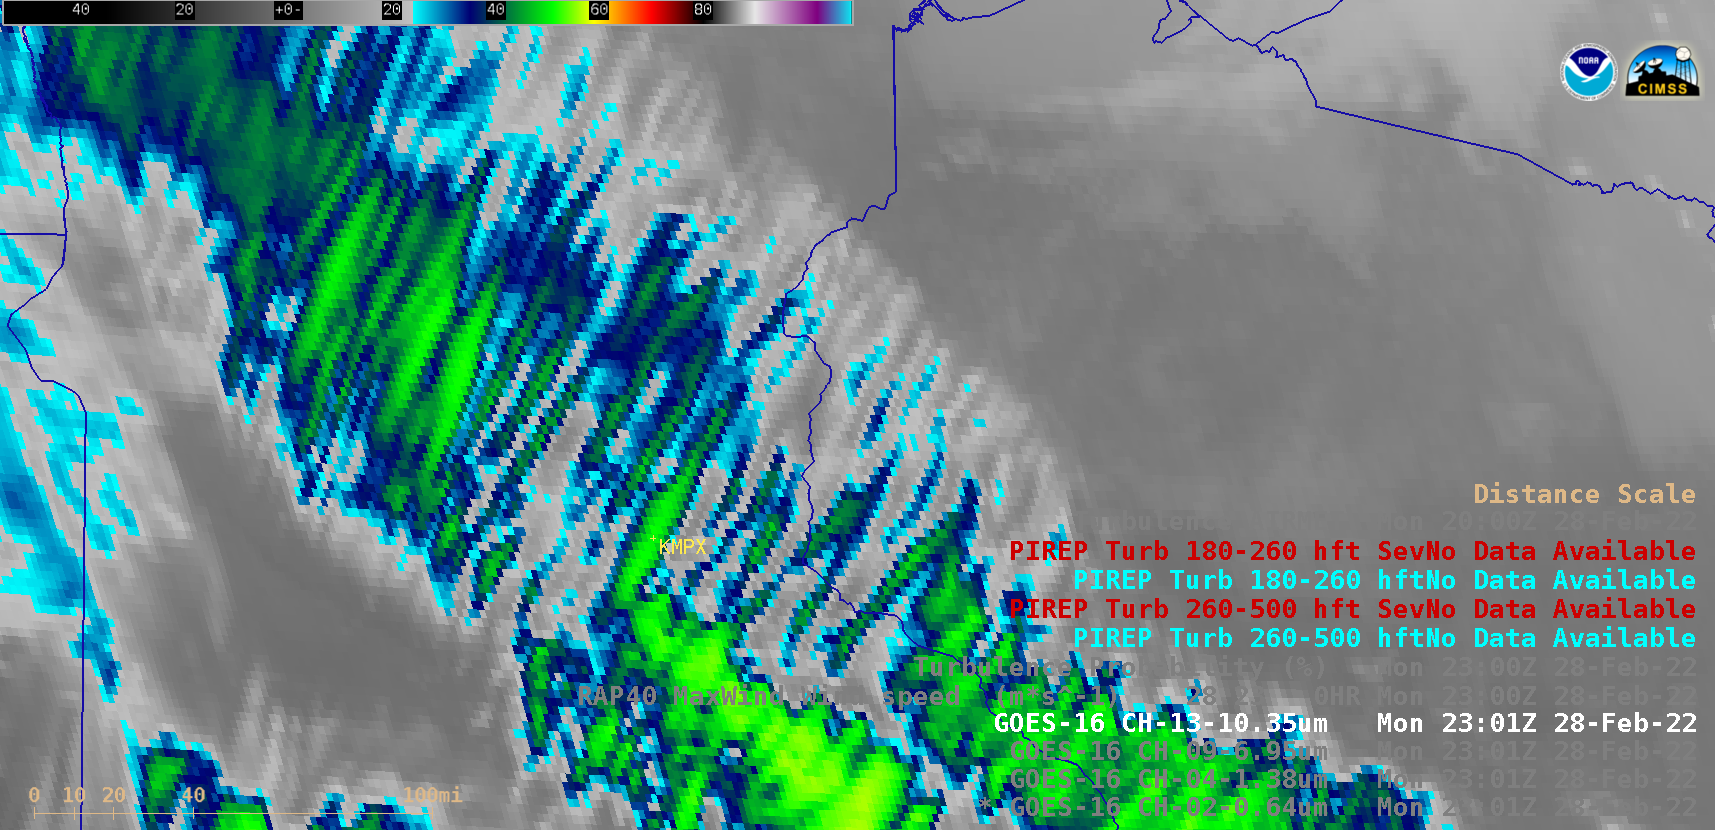
Turbulence probability is an aviation tool created (using machine learning techniques) at CIMSS to diagnose the likelihood of Moderate Or Greater (MOG) turbulence at least once during a 10-minute period. The image above shows the 1455 UTC MOG Turbulence Probability along with pilot reports (PIREPS) of turbulence, taken from this website. Turbulence Probability fields are also in AWIPS, and the 1500 UTC image is shown below.
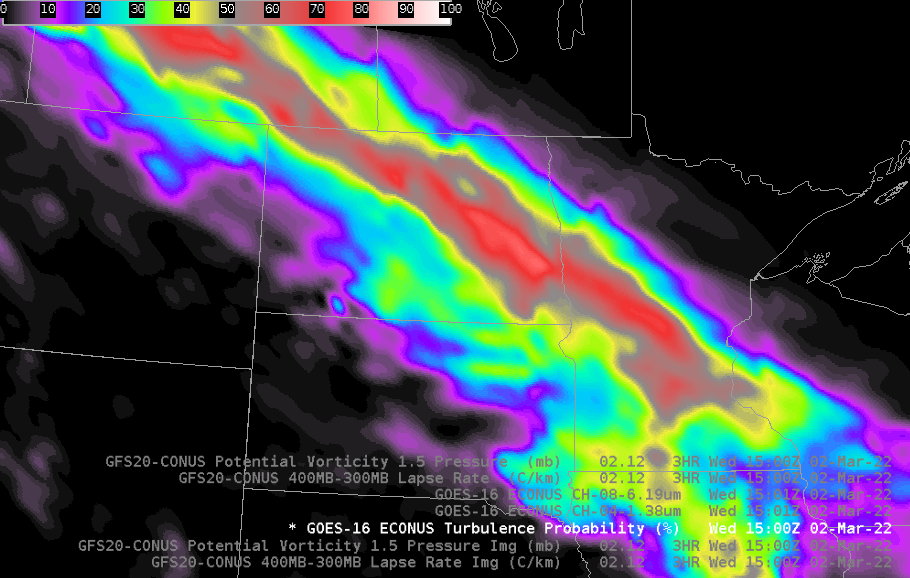
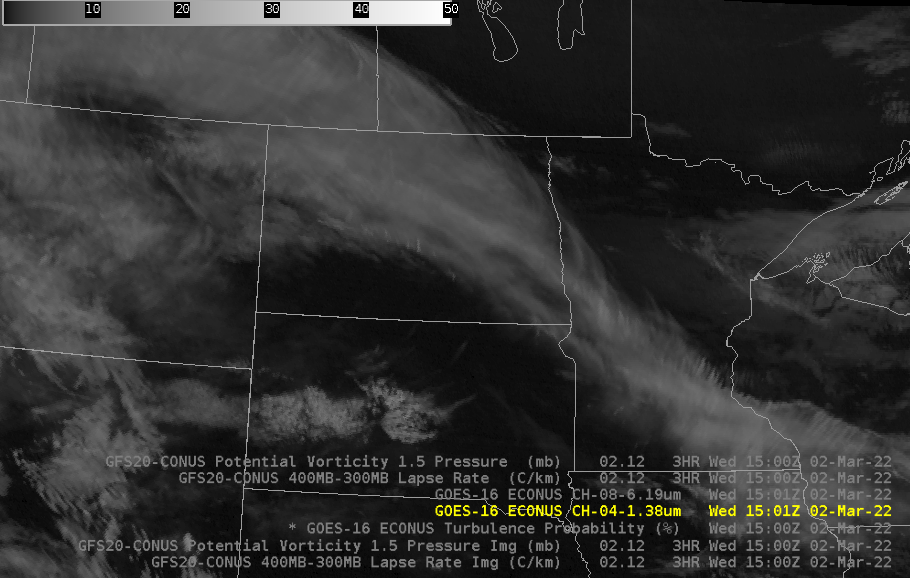
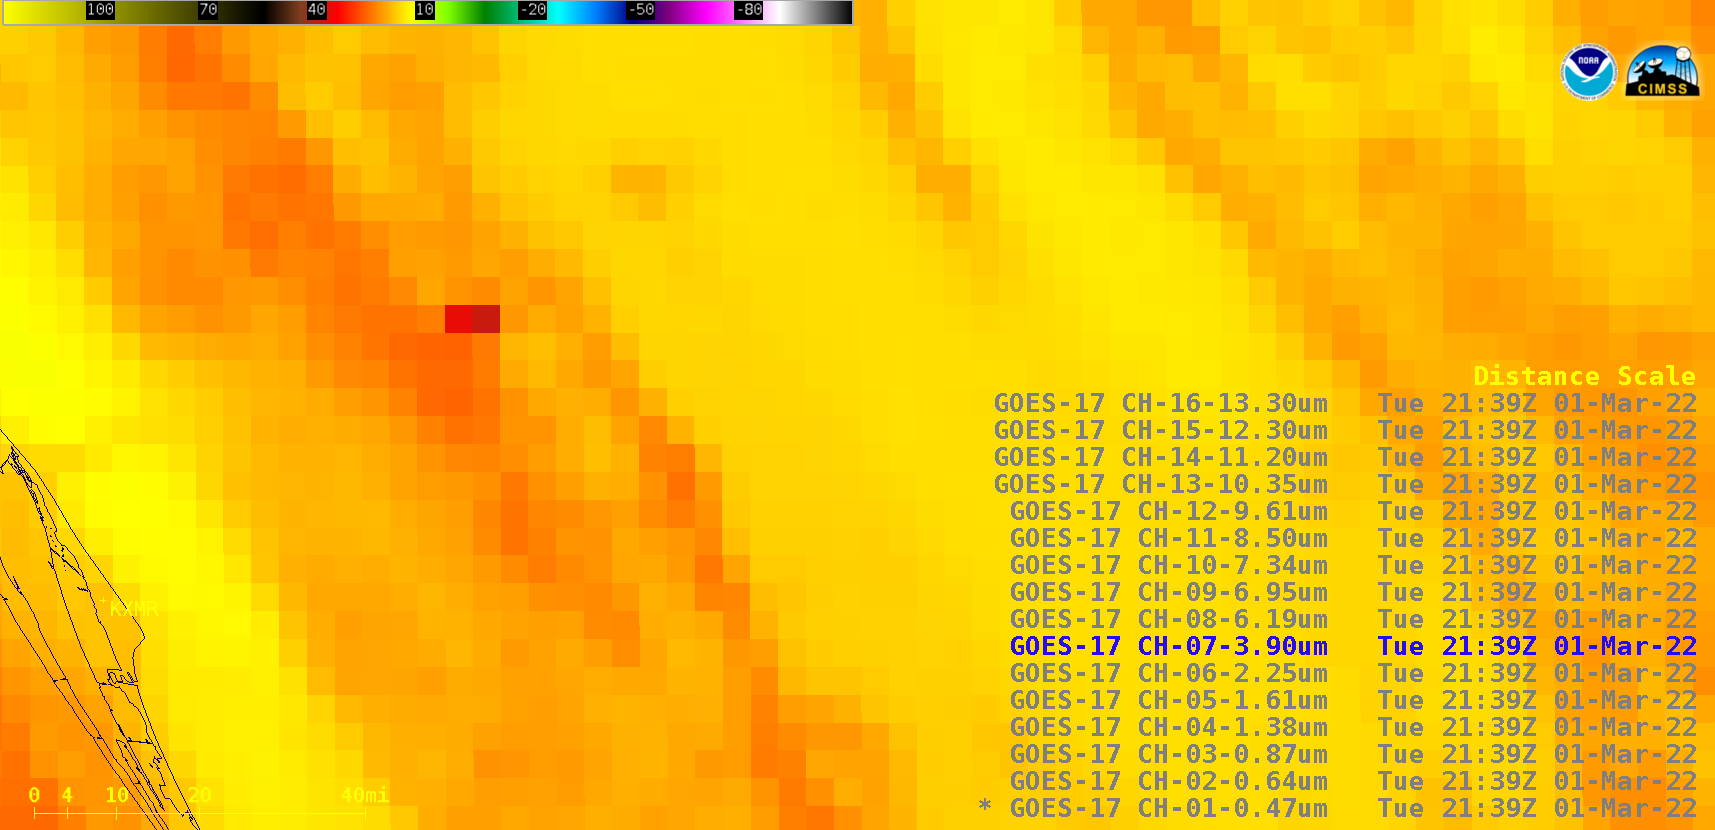
There are frequently features in the water vapor imagery (or in visible, or near-infrared, imagery during the day) that have a known association with turbulence. The turbulence probability field is toggled below with the 6.19 µm upper-level water vapor infrared imagery, and beneath that with the 1.38 µm “cirrus band” near-infrared imagery. Striated features that are apparent in, for example, this event from 28 February, are not obvious.

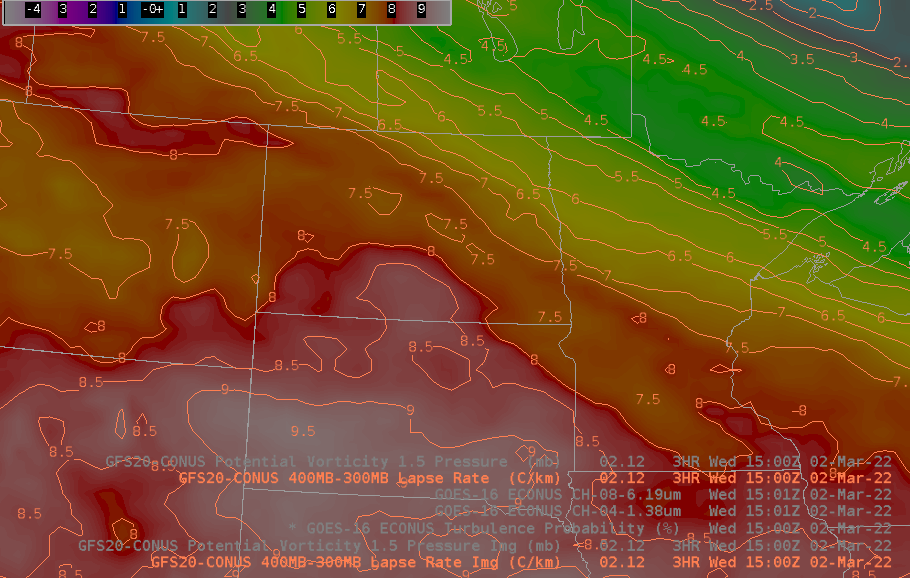
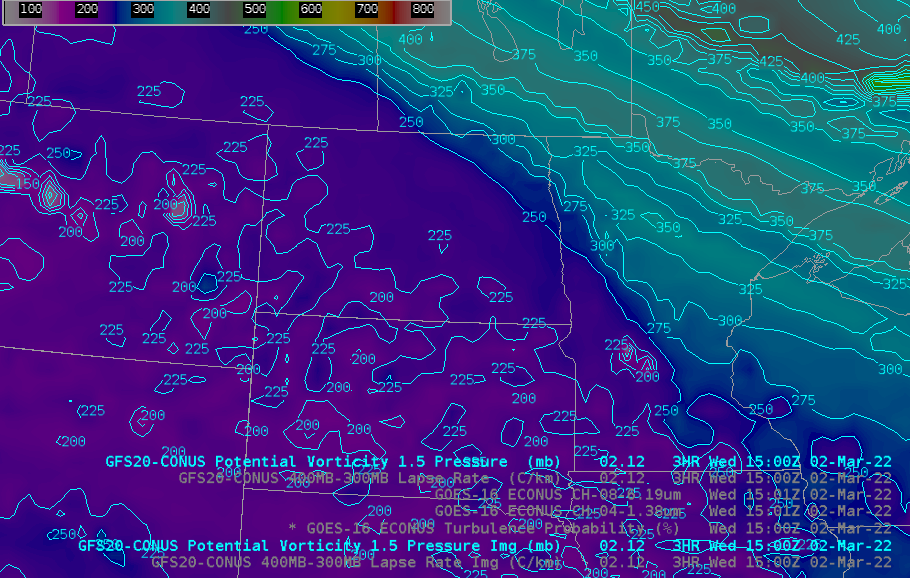
MOG Turbulence Probability also includes information from the GFS: temperature, height, and winds from 850 mb to 50 mb! (Such GFS fields are especially important when using GOES-17 data during times when the Loop Heat Pipe malfunctions leads to data loss over the Pacific.) The toggles below show the relationship between the Turbulence Probability and upper-tropospheric stability (as diagnosed by the 400-300 mb lapse rate), and the also the pressure on the 1.5 PVU surface. Turbulence is occurring just Equatorward of a slope in the tropopause, in a region of weak stability.

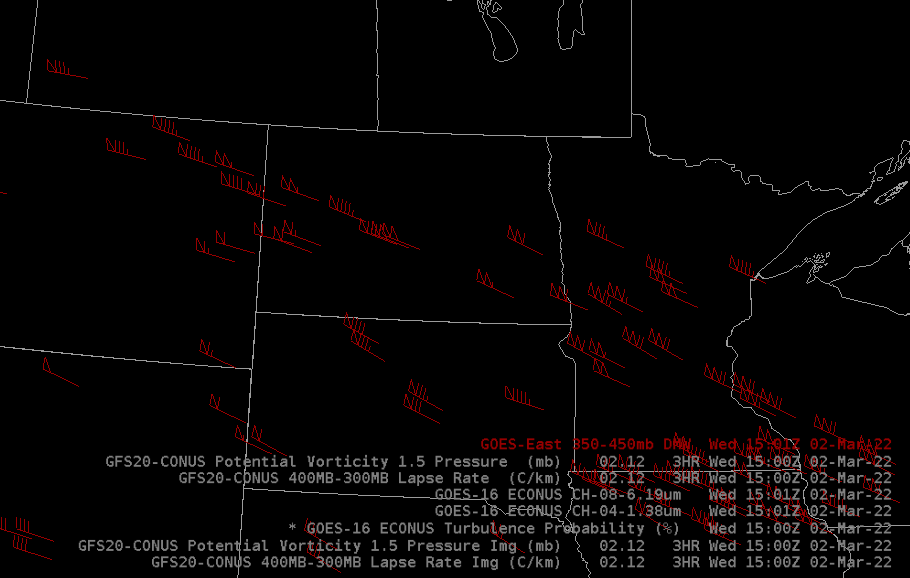
GOES Data can also be used to diagnose wind speeds in the upper-troposphere. Peak winds in the 350-450 mb layer, shown in a toggle below with the MOG Turbulence Probability, are 100-120 knots from southeastern North Dakota into northwestern Wisconsin.

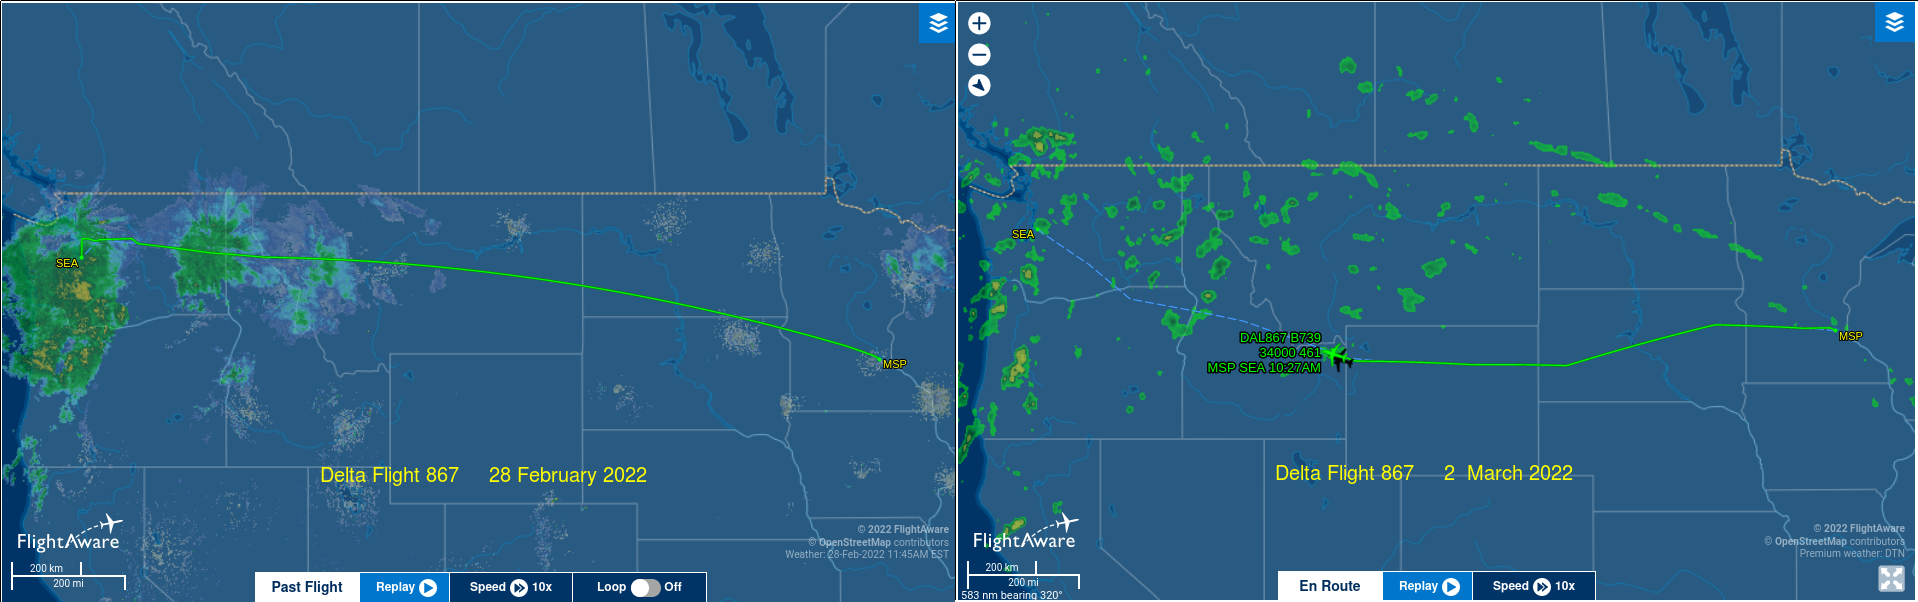
How did this potential for turbulence (and strong winds) affect air traffic? Consider the path of one late-morning flight, Delta Flight 867 from Minneapolis to Seattle. Its path is shown below for February 28th, and for March 2nd, courtesy of FlightAware. The 2 March flight was diverted south to avoid the strong winds and potential for turbulence.
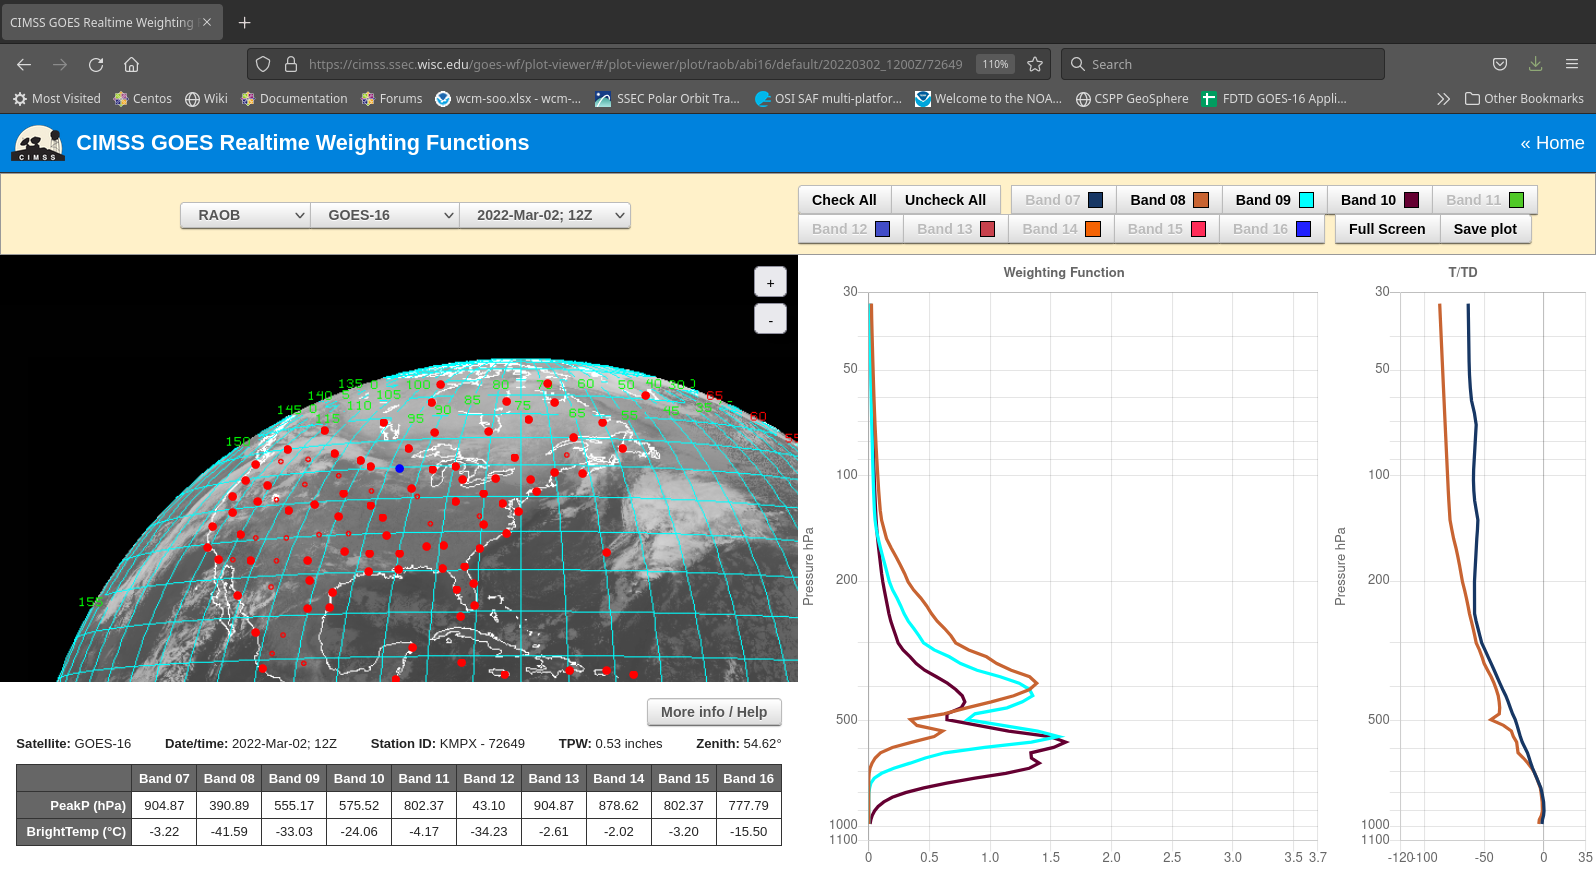
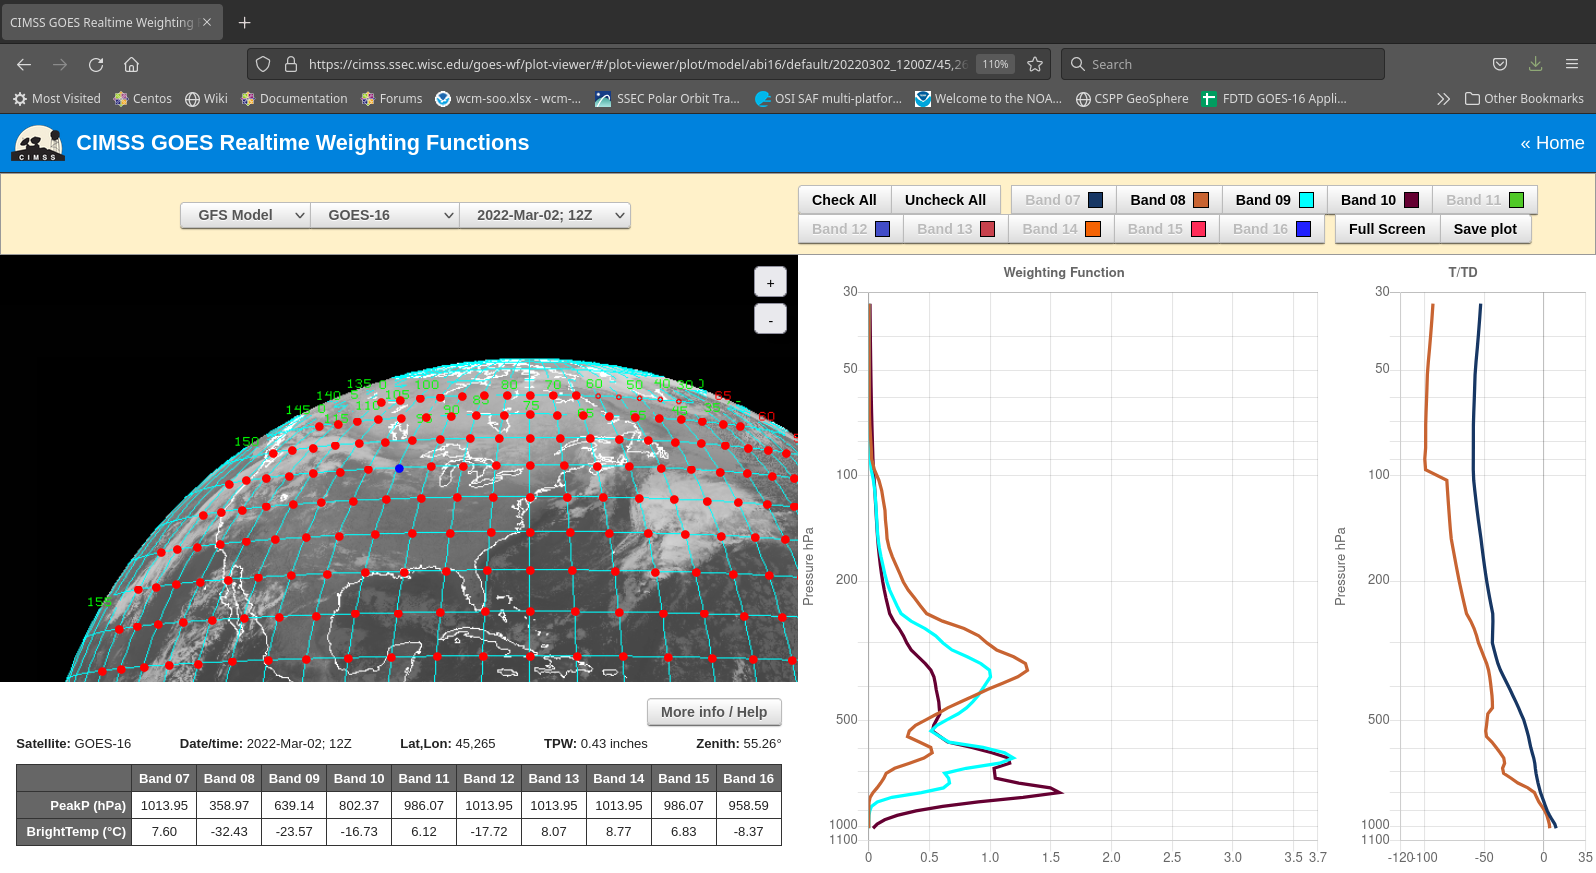
You might ask: Why are the upper-tropospheric lapse rates shown? The reason is because they align the use of the 6.19 µm imagery. The (new and improved!!) CIMSS Weighting Function page shows that at 1200 UTC, much of the signal in the upper-level water vapor imagery (in brown in the plot below) around Minneapolis was coming from the 300-400 mb layer. A plot using GFS data at 45o N, 95o W, shows a similar distribution.
AWIPS imagery in this blog post was created using the NOAA/NESDIS TOWR-S AWIPS Cloud Instance.
View only this post Read Less


