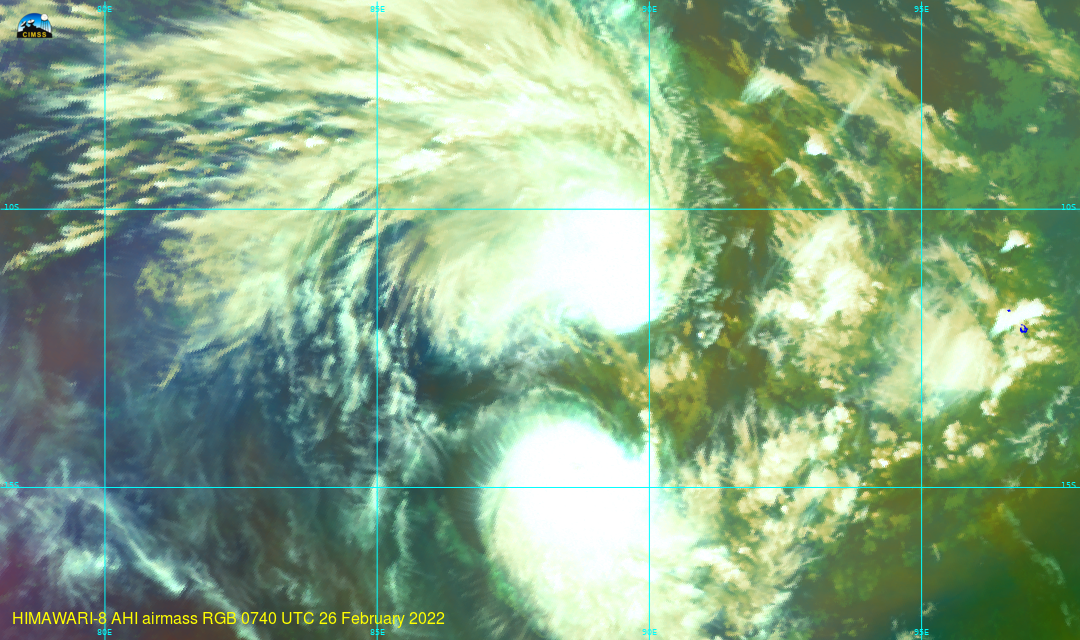
CIMSS scientists have been working on an update (and improvement) on Geo2Grid software (v 1.1) that can be expected within a couple months. (Beta-testing is ongoing at CIMSS) The animation above shows the Airmass RGB from Himawari-8 (data courtesy JMA) and the Fujiwhara interaction (also discussed on the CIMSS blog here) between southern Indian Ocean tropical cyclone Vernon and invest area 93S. The animation stretches from 0000 UTC on 24 March to 0000 UTC on 28 March.
Because the animation includes data near the limb, the remapping was changed from the default. That is, the geo2grid invocation includes the following specification:
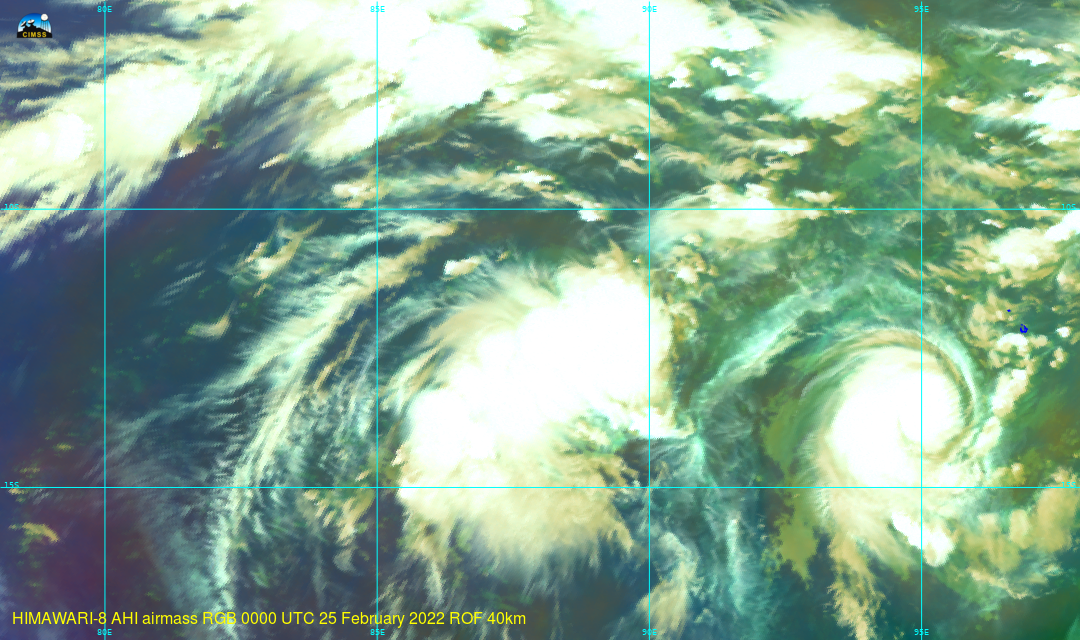
-g Fujiwhara --grid-configs $GEO2GRID_HOME/Fujiwhara.yaml --method nearest --radius-of-influence 40000Remapping is done using a nearest-neighbor approach (the default in geo2grid when a non-native projection is used), and points within 40 km (40000 m) are considered. Note also that the full-disk AHI imagery is reprojected onto a grid named ‘Fujiwhara’; the components required by geo2grid are within the file Fujiwhara.yaml (as created by a call to the p2g_grid_helper.sh script):
./p2g_grid_helper.sh Fujiwhara 88.0 -12.0 2000 2000 1080 640 > $GEO2GRID_HOME/Fujiwhara.yaml What was the series of unix-based commands that produced the imagery above? Those are outlined below in a shell script. This uses the beta version of geo2grid v1.1; similar commands will work in v1.0. Before this shell script can be invoked, the compressed package must be expanded, creating a directory with many sub-directories, such as /bin, /share, /colormaps, /etc, and so on. This directory is the GEOGRID_HOME directory, and you can specify it, as shown below.
cd /directory/where/geo2gridpkg/sits/
export GEO2GRID_HOME=$PWD
cd bin
#
# The command below will create a grid (named 'Fujiwhara')
#   centered at 88 E, 12 S (geo2grid assumes east/north positive)
# The grid has 2 km resolution in the x- and y- directions, and
#   its size is 1080x640 (so it's wider than it is high)
# Place the multi-line output from p2g_grid_helper.sh in the file
#   named $GEO2GRID_HOME/Fujiwhara.yaml
../p2g_grid_helper.sh Fujiwhara 88.0 -12.0 2000 2000 1080 640   > $GEO2GRID_HOME/Fujiwhara.yaml
#
# Now, call geo2grid, reading (the -r flag) AHI HSD format files
#   Write out (the -w flag) geotiff files of (the -p flag) the product
#   airmass RGB.  Regrid (the -g flag) the data to the 'Fujiwhara'
#   grid defined above, and tell geo2grid where the grid definitions sit
#   (the --grid-configs filename flag).  Regridding uses nearest-
#   neighbor (--method nearest) and it looks within 40000 m of each grid
#   point (--radius-of-influence 40000)  (Note that geo2grid v1.0 did
#   not include --radius-of-influence!)
##
##
../geo2grid.sh -r ahi_hsd -w geotiff -p airmass  -g Fujiwhara --grid-configs $GEO2GRID_HOME/Fujiwhara.yaml --method nearest --radius-of-influence 40000 -f /directory/holding/Himawari-8/HSDFILES/for/ONE/time/only/*FLDK*.DAT
#  The command above will create a geotiff file with a name like this:
#  HIMAWARI-8_AHI_airmass_20220223_0000??_Fujiwhara.tif
#  The command below adds coastlines (in blue) and lat/lon line
#  (--add-grid) colored in the default (cyan).  The output is a
#  .png
../add_coastlines.sh --add-coastlines --coastlines-resolution h --coastlines-level=5 --coastlines-outline='blue' --add-grid --grid-text-size 8 --grid-D 5.0 5.0 --grid-d 5.0 5.0    HIMAWARI-8_AHI_airmass_20220223_0000??_Fujiwhara.tif
#  I use ImageMagick commands to annotate the imagery, as shown below
convert HIMAWARI-8_AHI_airmass_20220223_0000??_Fujiwhara.png   -gravity Southwest -fill yellow -pointsize 16 -annotate +12+16 "HIMAWARI-8 AHI airmass RGB 0000 UTC 23 February 2022"  HIMAWARI-8_AHI_airmass_20220223_0000_Fujiwhara.png
#  Gotta add a logo too!
convert HIMAWARI-8_AHI_airmass_20220223_0000_Fujiwhara.png ~scottl/smalllogo.png   -gravity northwest -geometry +12+8 -composite HIMAWARI-8_AHI_airmass_20220223_0000_FujiwharaL.png
How does a change in –radius-of-influence affect the created image? If you’re near the limb, and the radius of influence is too small, data gaps can appear. The image below compares an image with radius of influence of 2km (the native resolution at the sub-satellite point for infrared imagery) with an image with a radius of influence of 40 km.
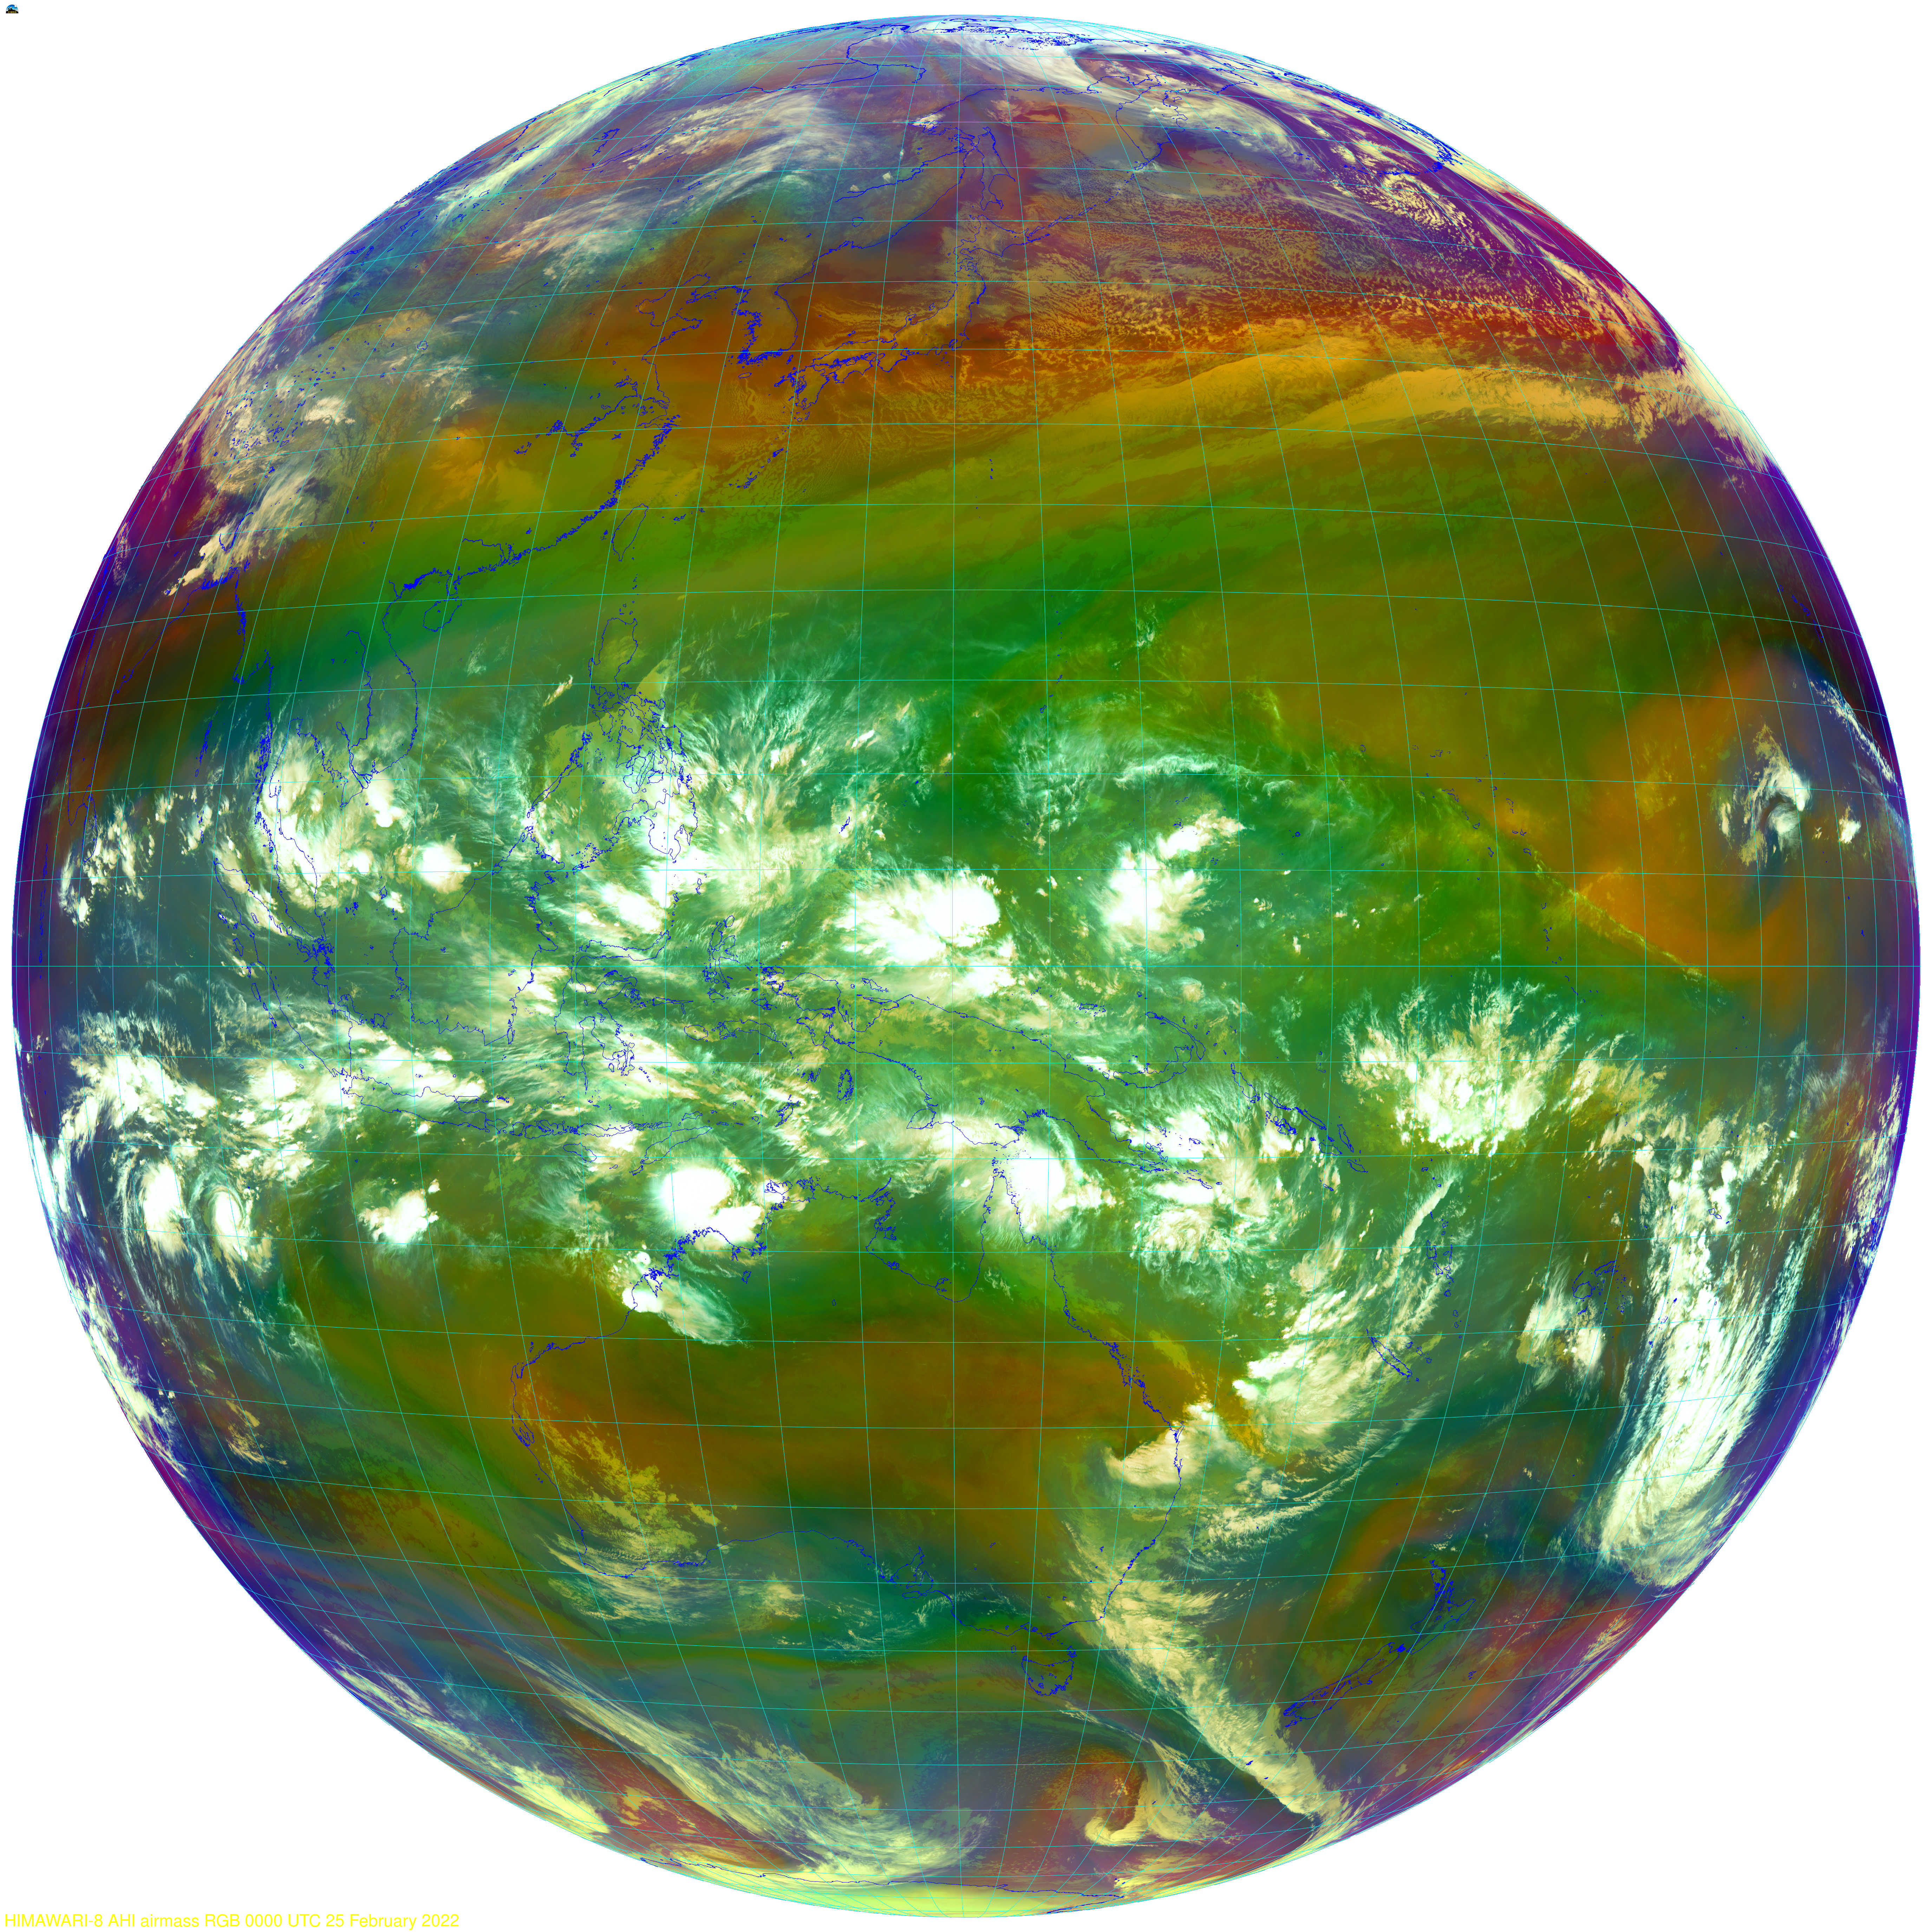
A Full-disk image at this time is here so you can judge how close to the edge this event it.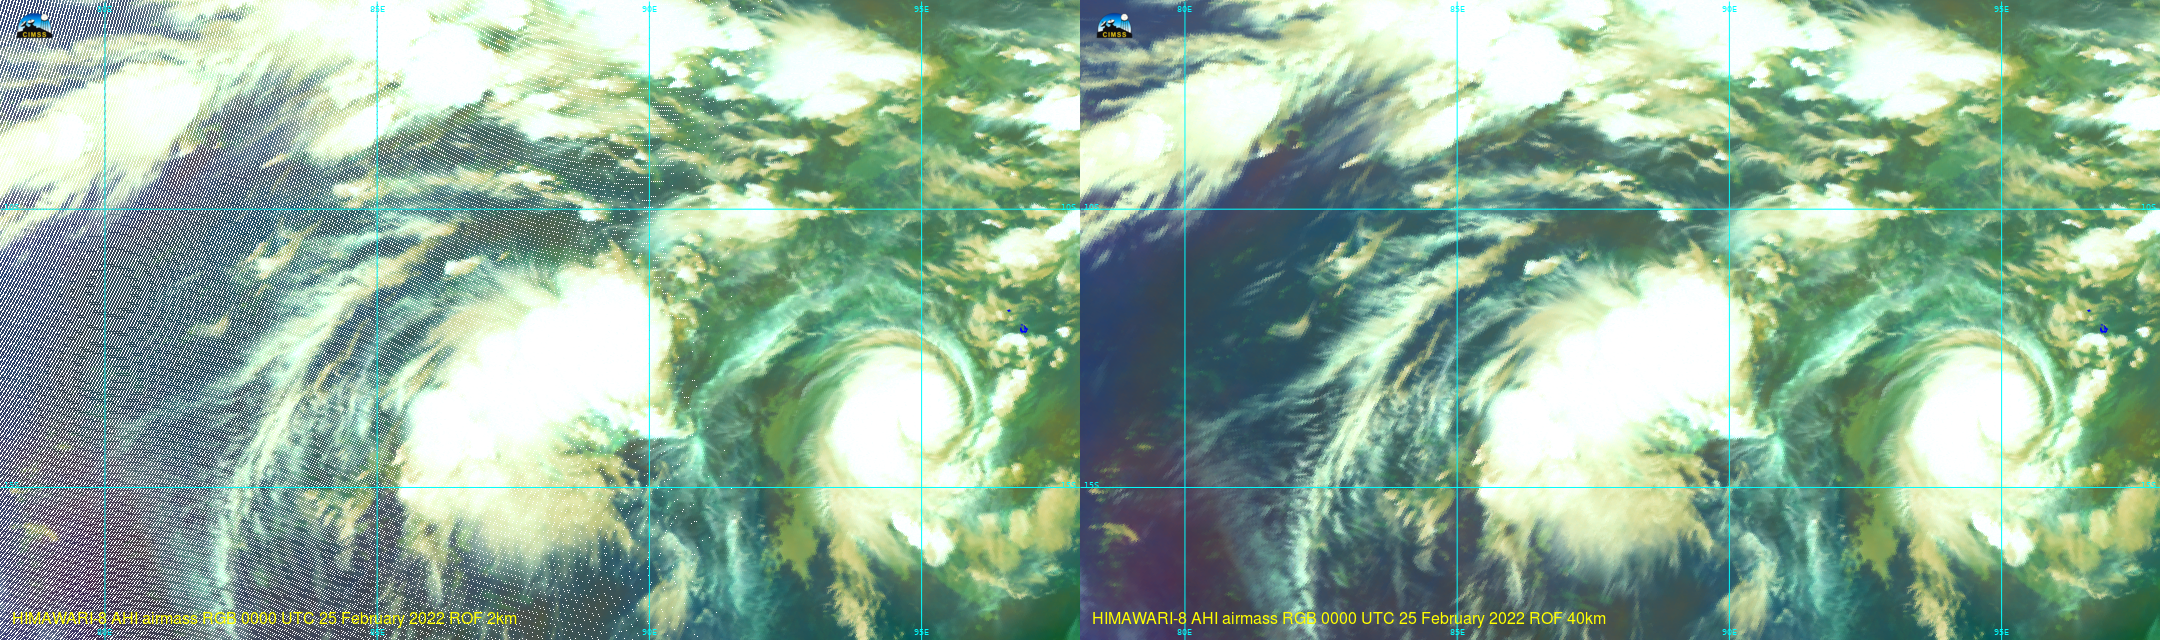
A non-satellite of the Fujiwhara interaction is shown below.
View only this post Read Less


