Late in the day on 06 July 2021, Tropical Storm Elsa regained hurricane intensity as of 0000 UTC, just off the west coast of Florida. 1-minute Mesoscale Domain Sector GOES-16 (GOES-East) “Red” Visible (0.64 µm) and “Clean” Infrared Window (10.35 µm) images (above) showed the tropical cyclone during the 1500 UTC to 0000 UTC time period. In the morning, cloud-top infrared brightness temperatures of -80ºC... Read More
![GOES-16 “Red” Visible (0.64 µm) and “Clean” Infrared Window (10.35 µm) images [click to play animation | MP4]](https://cimss.ssec.wisc.edu/satellite-blog/images/2021/07/elsa_vis-20210706_180028.png)
GOES-16 “Red” Visible (0.64 µm) and “Clean” Infrared Window (10.35 µm) images [click to play animation | MP4]
Late in the day on
06 July 2021,
Tropical Storm Elsa regained hurricane intensity as of
0000 UTC, just off the west coast of Florida. 1-minute
Mesoscale Domain Sector GOES-16
(GOES-East) “Red” Visible (
0.64 µm) and “Clean” Infrared Window (
10.35 µm) images
(above) showed the tropical cyclone during the 1500 UTC to 0000 UTC time period. In the morning, cloud-top infrared brightness temperatures of -80ºC or colder were seen
(violet pixels), but during most of the day they were in the -70 to -79ºC range. While Elsa had been moving over water with
Sea Surface Temperature values around 28ºC, the
Ocean Heat Content of those waters was relatively low.
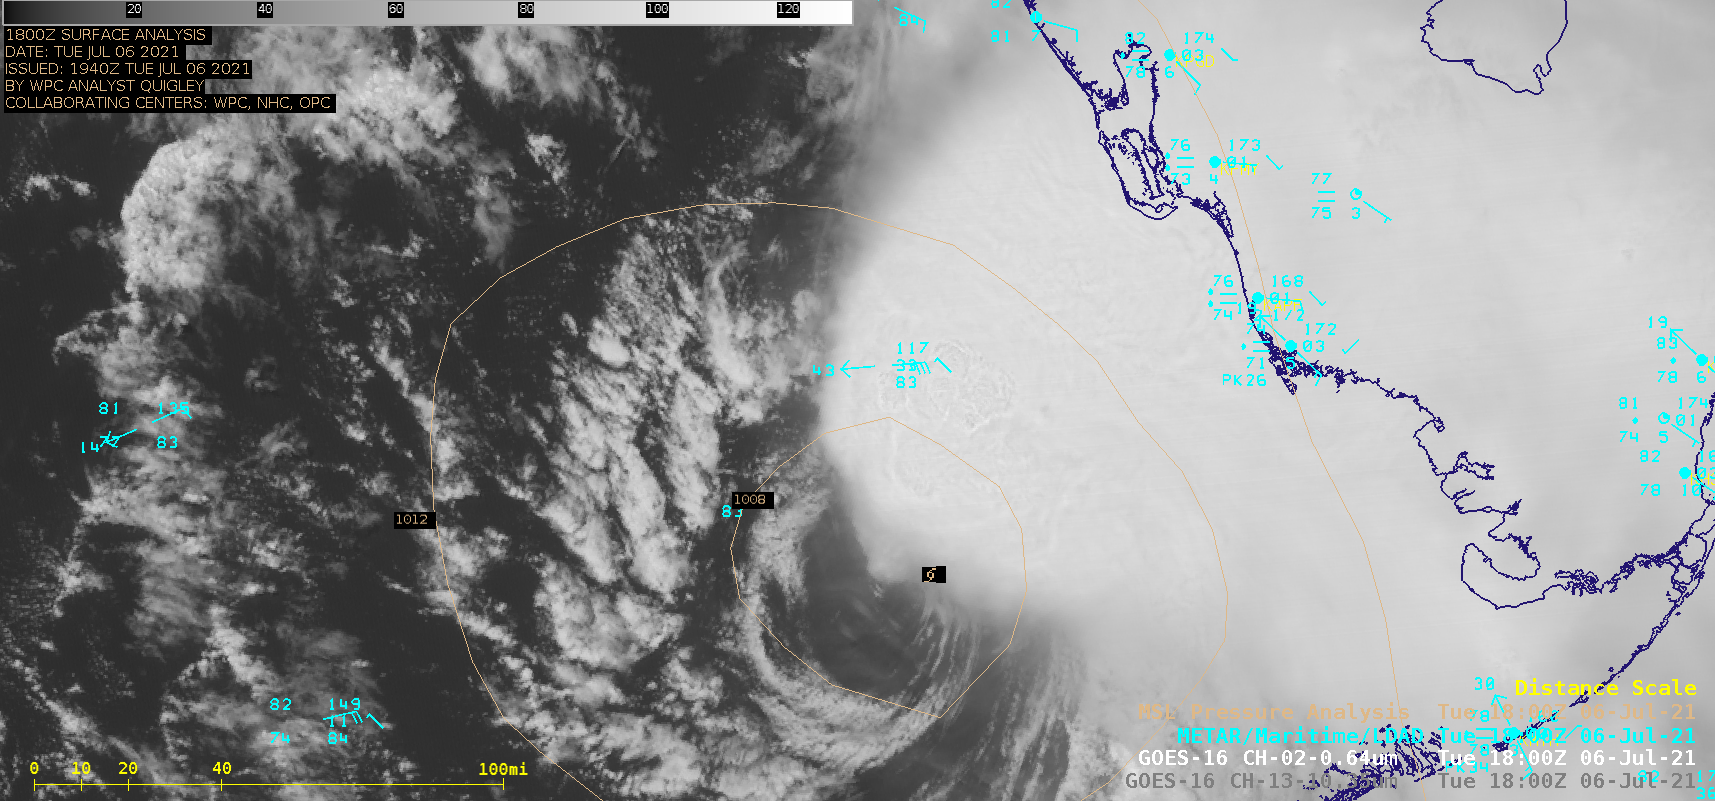
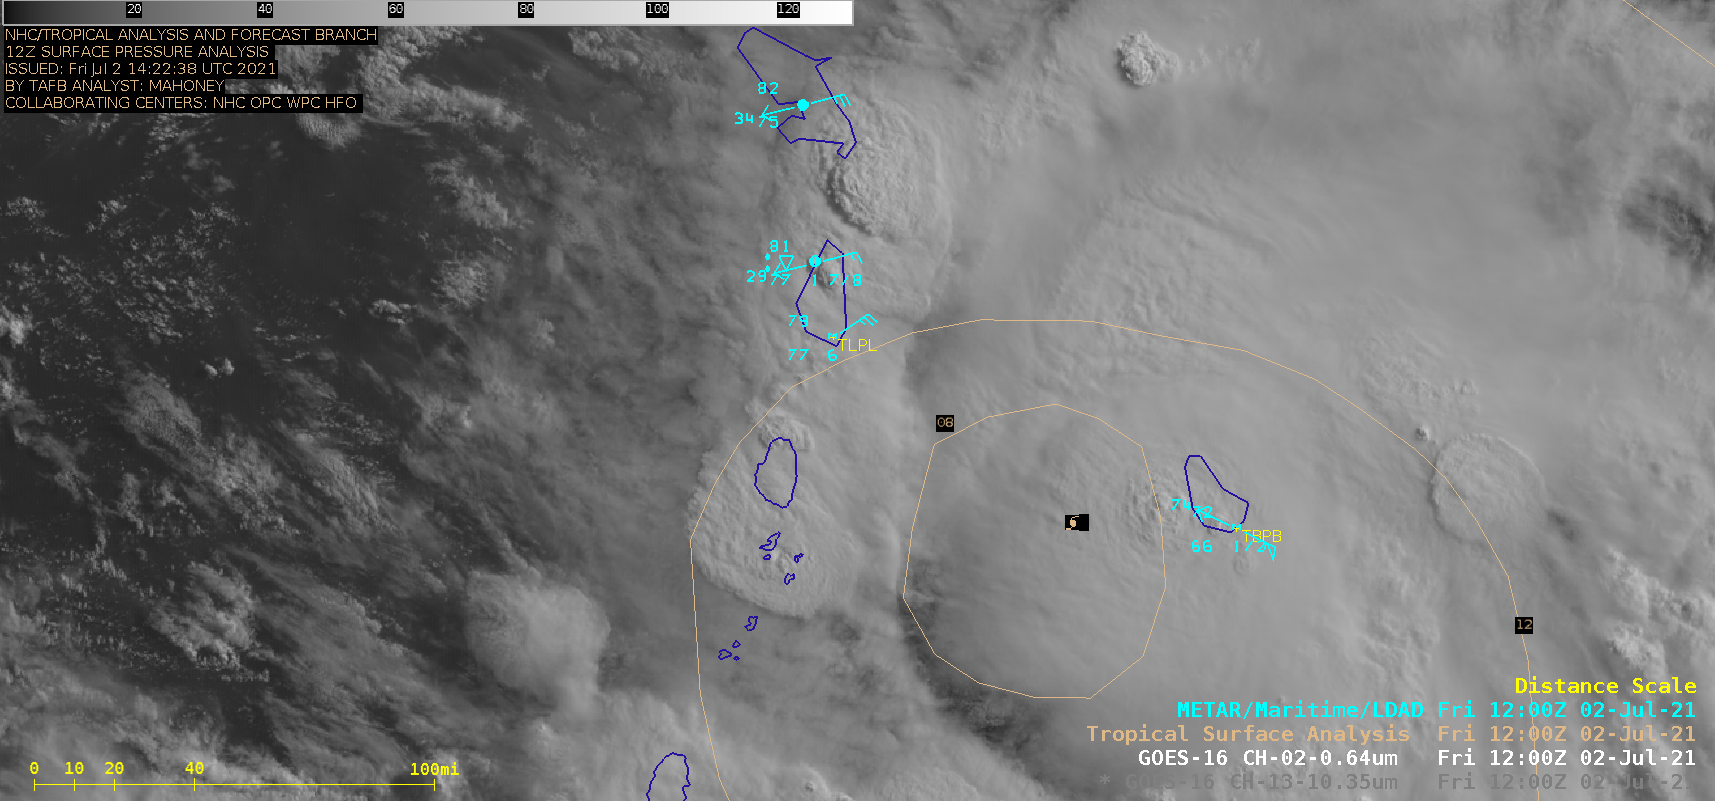
For a few hours the low-level circulation of Elsa remained exposed from its deep convection to the northeast — and GOES-16 Visible images with an overlay of deep-layer shear at 1800 UTC, from the CIMSS Tropical Cyclones site (below), showed that this was due to westerly shear values around 25-30 knots over the area.
![GOES-16 “Red” Visible (0.64 µm) images, with an overlay of deep-layer wind shear at 1800 UTC [click to enlarge]](https://cimss.ssec.wisc.edu/satellite-blog/images/2021/07/210706_goes16_visible_shear_Elsa_anim.gif)
GOES-16 “Red” Visible (0.64 µm) images, with an overlay of deep-layer wind shear at 1800 UTC [click to enlarge]
The center of Elsa moved just to the east of
Buoy 42023 — a plot of wind speed/gust and pressure is shown below.
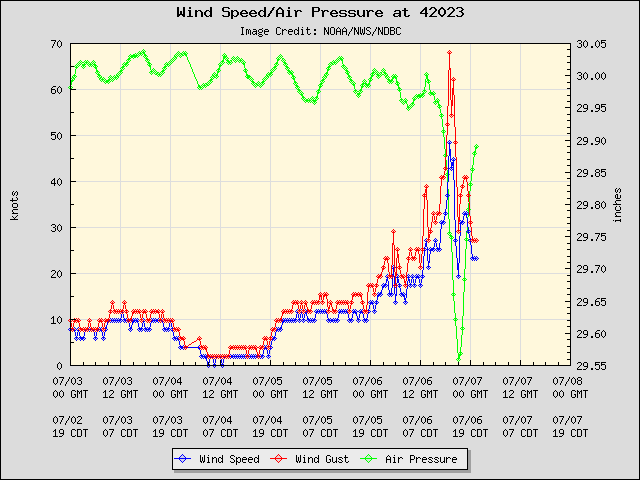
Plot of wind speed/gusts and pressure at Buoy 42023
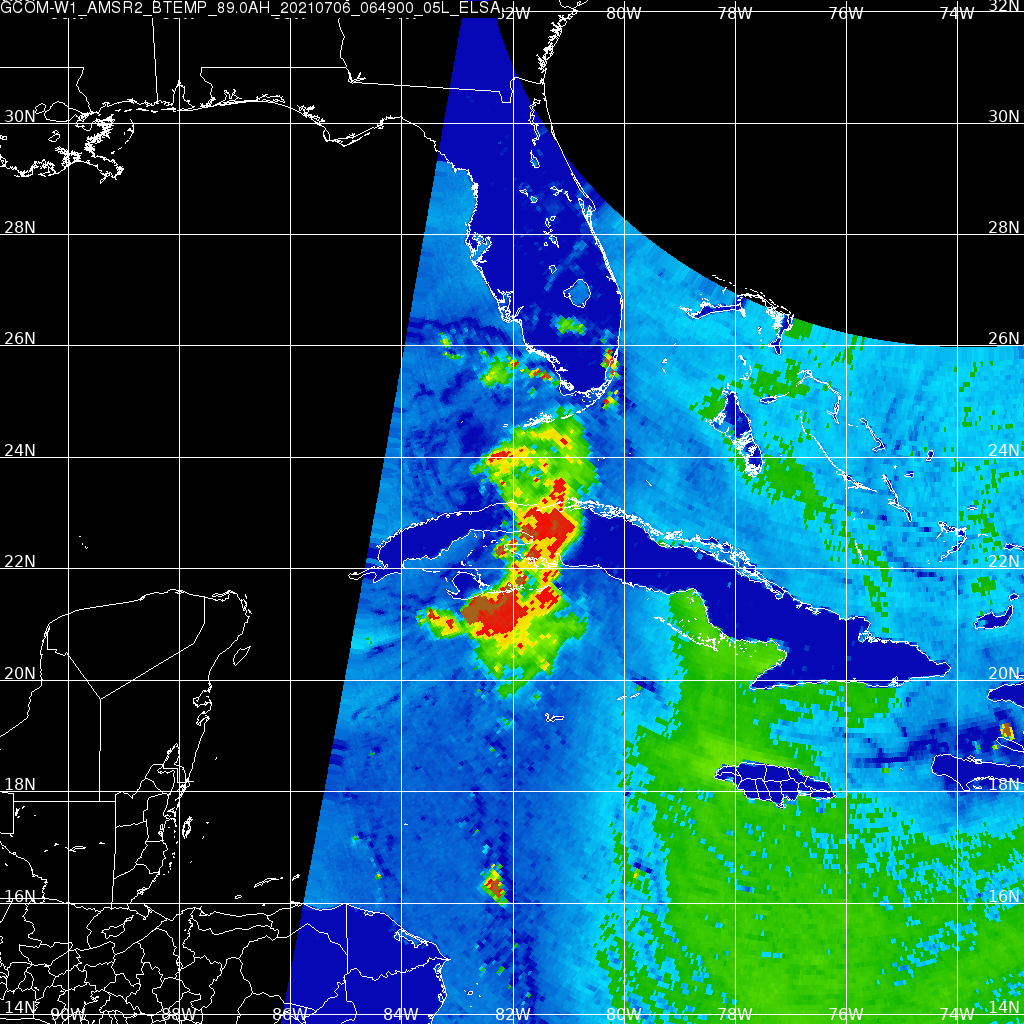
A DMSP-15 Microwave (85 GHz) Microwave image at 2155 UTC (below) indicated that Elsa had nearly completed the formation of a closed eyewall at that time.
![DMSP-15 Microwave (85 GHz) Microwave image at 2155 UTC [click to enlarge]](https://cimss.ssec.wisc.edu/satellite-blog/images/2021/07/210706_2155utc_dmsp15_ssmis_Elsa.gif)
DMSP-15 Microwave (85 GHz) Microwave image at 2155 UTC [click to enlarge]
GOES-16 Infrared / Water Vapor Difference images
(below) revealed pockets of stronger overshooting tops near the center of deep convection during the hours leading up to Elsa reaching hurricane intensity.
![GOES-16 Infrared / Water Vapor Difference images [click to enlarge]](https://cimss.ssec.wisc.edu/satellite-blog/images/2021/07/210706_goes16_infrared_waterVapor_difference_Elsa_anm.gif)
GOES-16 Infrared / Water Vapor Difference images [click to enlarge]
===== 07 July Update =====
![GOES-16 “Red” Visible (0.64 µm) and “Clean” Infrared Window (10.35 µm) images [click to play animation | MP4]](https://cimss.ssec.wisc.edu/satellite-blog/images/2021/07/elsa_ir-20210707_150028.png)
GOES-16 “Red” Visible (0.64 µm) and “Clean” Infrared Window (10.35 µm) images [click to play animation | MP4]
After once again weakening to Tropical Storm intensity at
0600 UTC, Elsa eventually made landfall along the coast of Florida around 1500 UTC on 07 July, as seen in 1-minute GOES-16 Visible and Infrared images
(above) — inland impacts included an EF0 tornado, wind gusts to 71 mph and rainfall exceeding 11 inches (NWS
Public Information Statements).
At 1223 UTC, a DMSP-17 SSMIS Microwave image (below) indicated that a closed eyewall was not present with Elsa at that time.
![DMSP-17 SSMIS Microwave (85 GHz) image [click to enlarge]](https://cimss.ssec.wisc.edu/satellite-blog/images/2021/07/210707_1223utc_dmsp17_ssmis_microwave_Elsa.png)
DMSP-17 SSMIS Microwave (85 GHz) image [click to enlarge]
View only this post
Read Less
![GOES-16 “Red” Visible (0.64 µm) and “Clean” Infrared Window (10.35 µm) images [click to play animation | MP4]](https://cimss.ssec.wisc.edu/satellite-blog/images/2021/07/210706_goes16_visible_infrared_Elsa_anim.gif)
![GOES-16 “Red” Visible (0.64 µm) and “Clean” Infrared Window (10.35 µm) images [click to play animation | MP4]](https://cimss.ssec.wisc.edu/satellite-blog/images/2021/07/210707_goes16_visible_infrared_Elsa_landfall_anim.gif)


![GOES-16 “Red” Visible (0.64 µm) and “Clean” Infrared Window (10.35 µm) images [click to play animation | MP4]](https://cimss.ssec.wisc.edu/satellite-blog/images/2021/07/210702_goes16_visible_infrared_Hurricane_Else_anim.gif)
![GOES-16 Infrared images, with an overlay of deep-layer wind shear at 20 UTC [click to enlarge]](https://cimss.ssec.wisc.edu/satellite-blog/images/2021/07/210702_goes16_infrared_20utc_shear_Else_anim.gif)
