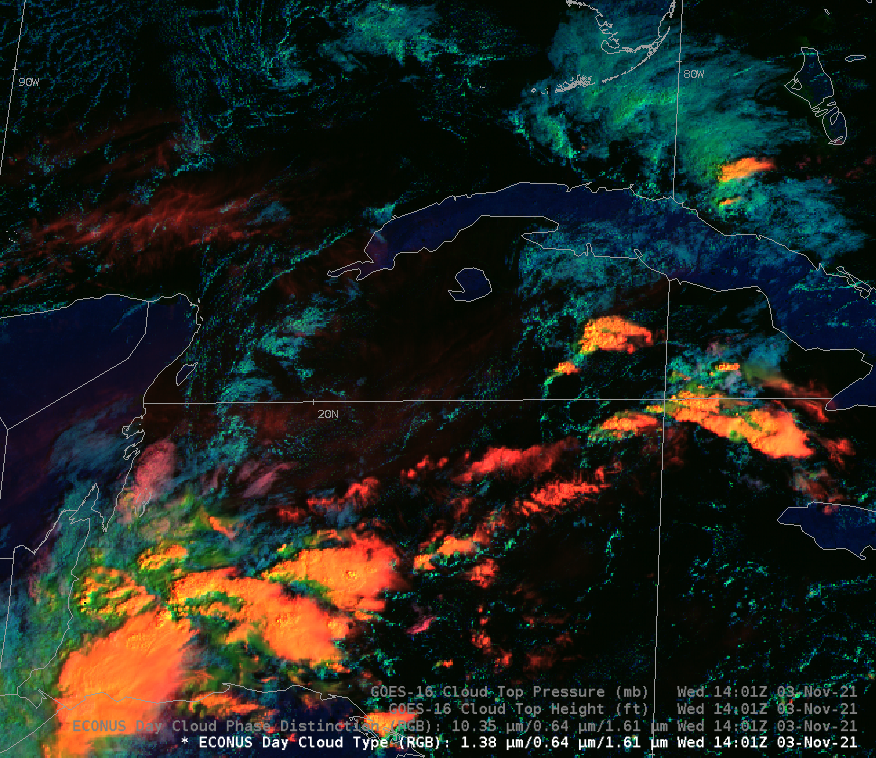

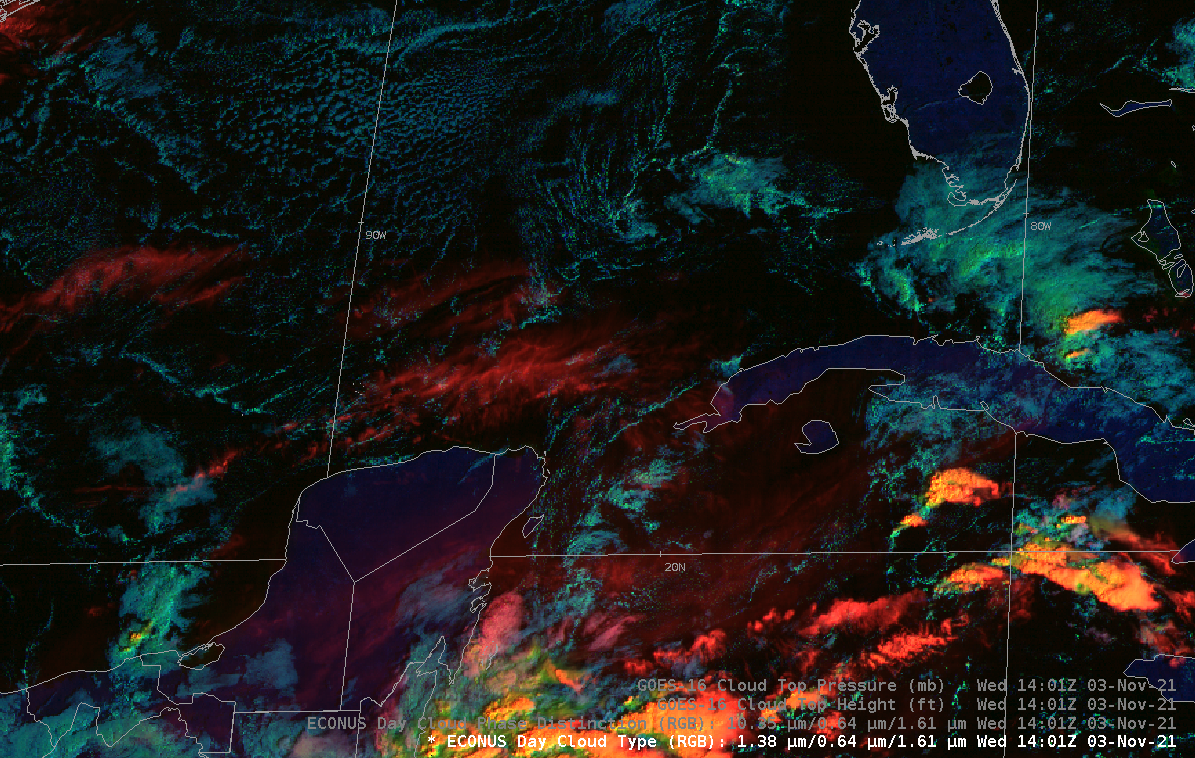
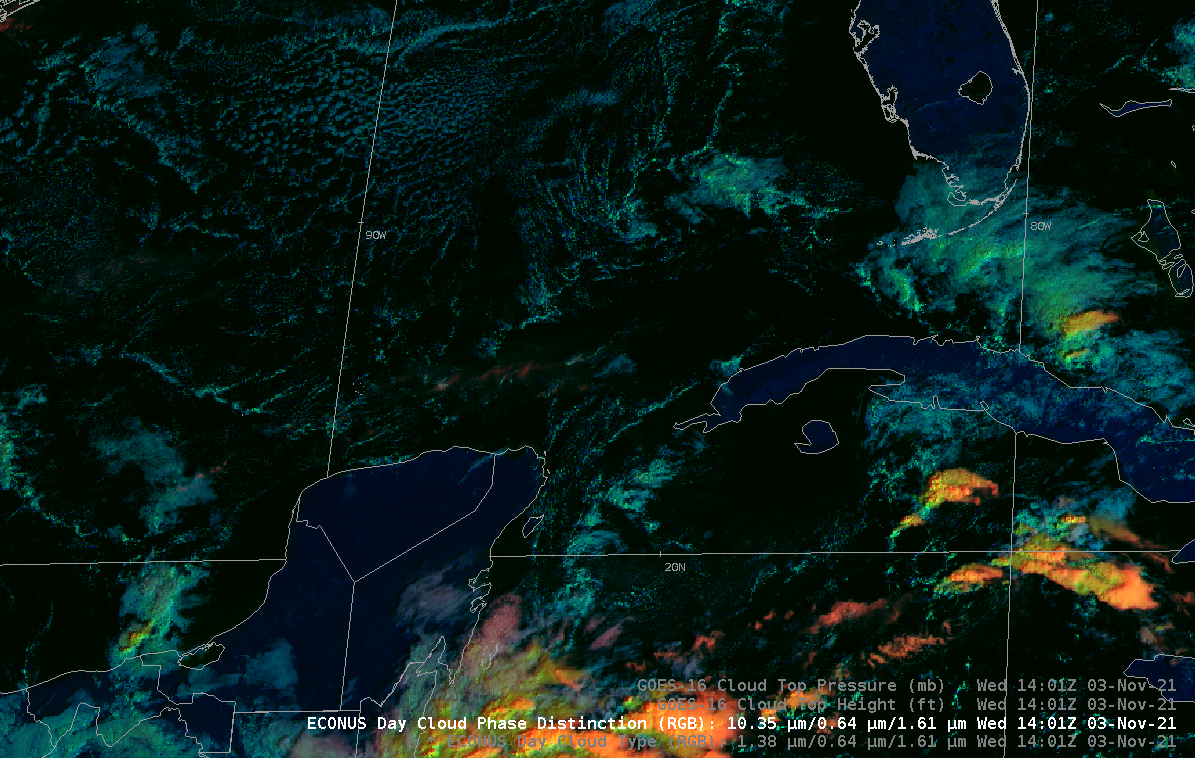
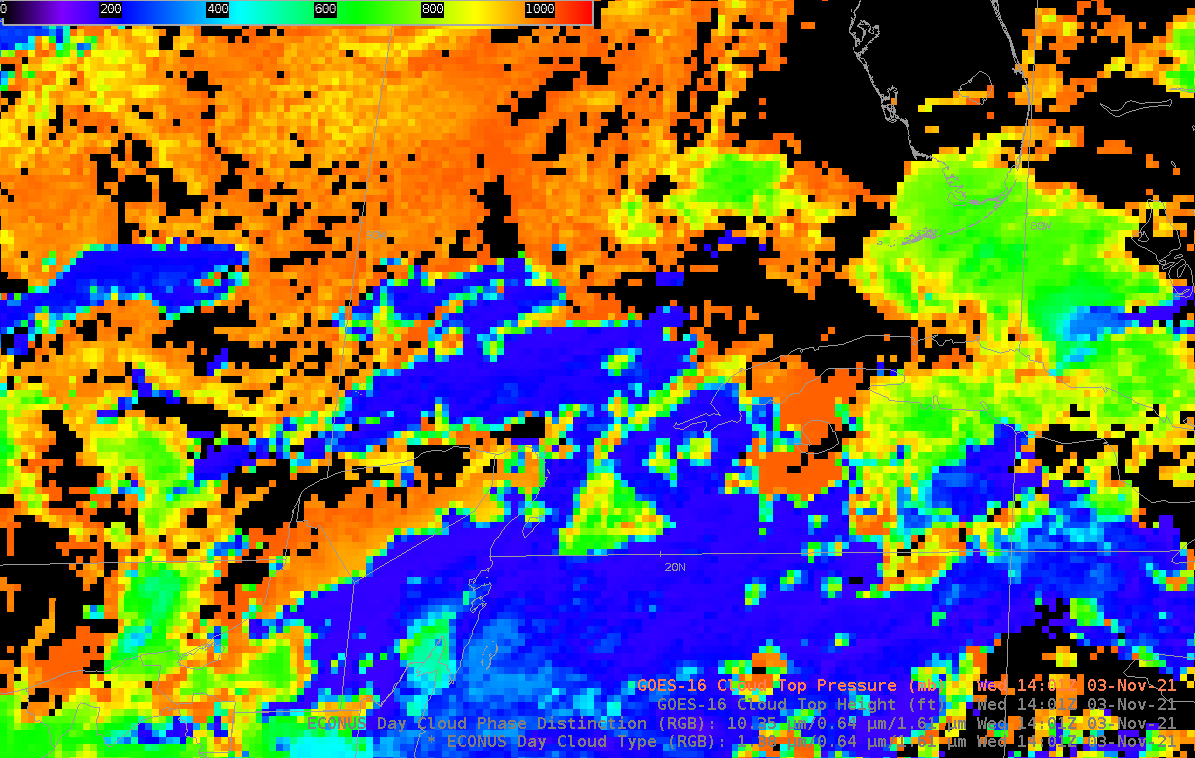
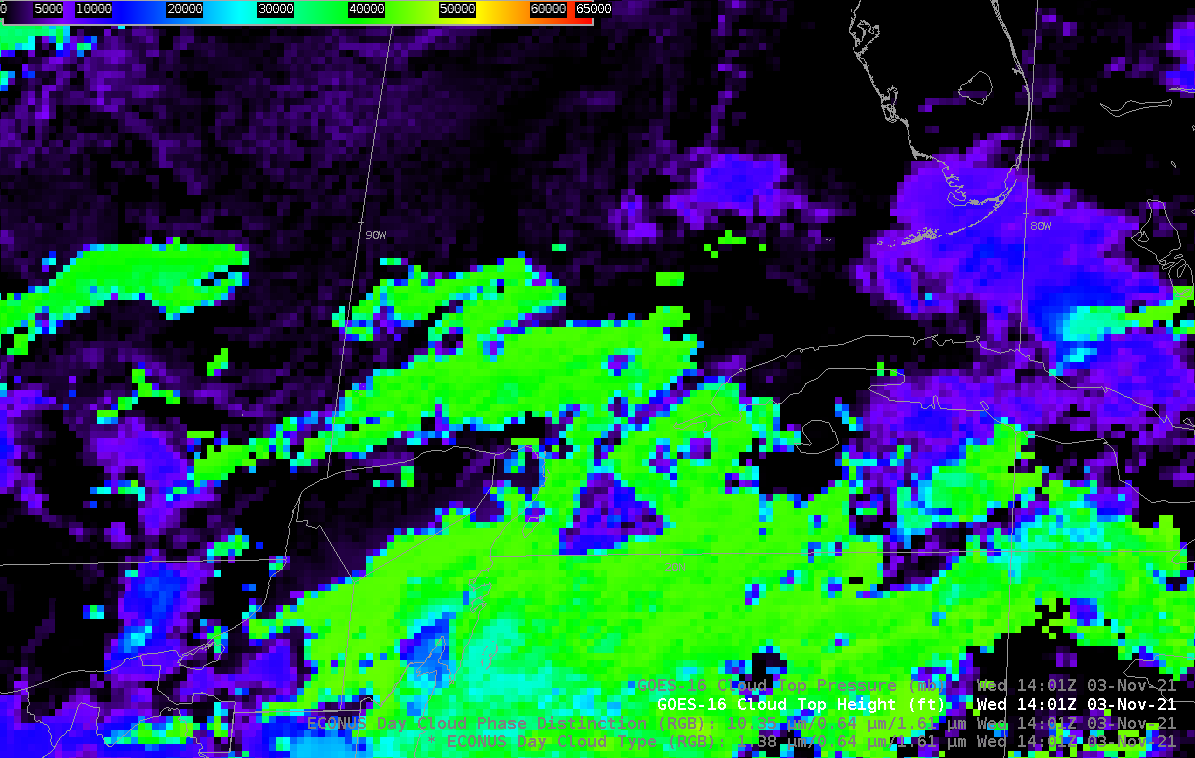
A new RGB will be implemented into AWIPS in the near future: it is scheduled for the next TOWR-S build to be released in December. Developed by NESDIS Geo Senior Scientist and Cirrus Channel (GOES-R Band 4, 1.38 µm) aficionado Dr. Andy Heidinger, the Day Cloud Type RGB starts with the Day Cloud Phase Distinction RGB (available online here, for example) and substitutes Cirrus Channel (Band 4, 1.38 µm) information for the Band 13 (10.3 µm) Clean Window information in the ‘Red’ component of the RGB. The result is much better detection of thin cirrus in this daytime-only product, as shown in the toggle above that includes the Day Cloud Type and Day Cloud Phase Distinction RGBs as well as the Level 2 Cloud Top Pressure. Note in particular the thin cirrus in the Gulf of Mexico just to the north of the Yucatán Peninsula. Cloud properties for this thin cirrus also show up in the Level Cloud Top Pressure (shown in the toggle above) and in Cloud Top Height.
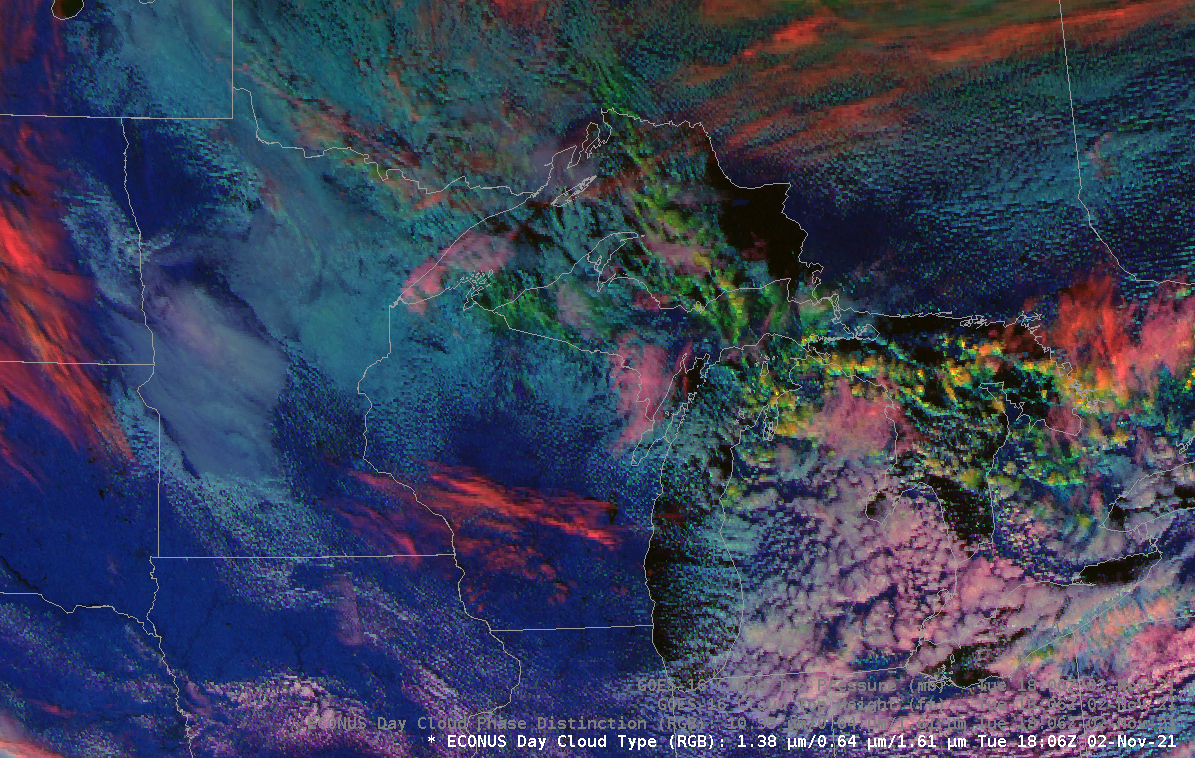
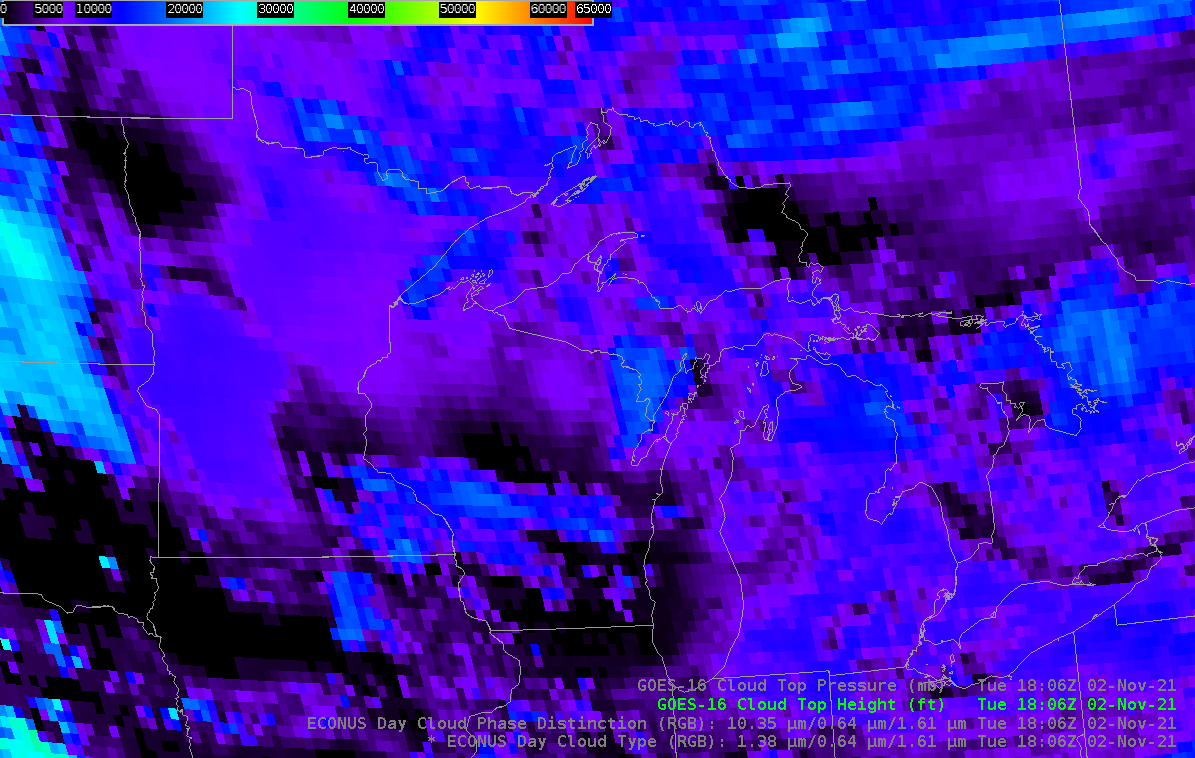
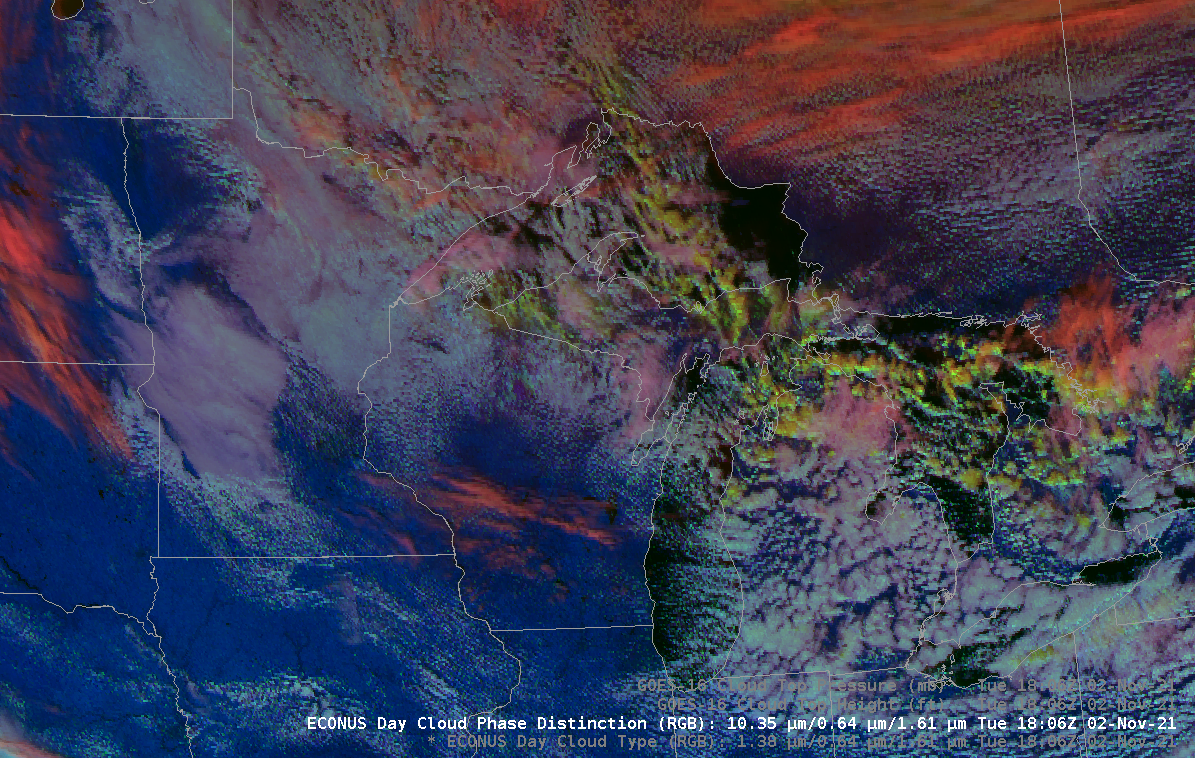
A similar relationship is shown in the toggle below, from 1806 UTC on 2 November. Note the thin cirrus over central Wisconsin, for example: much more obvious in the Day Cloud Type RGB, and present in the Cloud Top Pressure (and Cloud Top Height) product. A similar relationship is apparent over central North Dakota and over northern Ontario: the Day Cloud Type RGB better isolates regions of highest cirrus compared to the Day Cloud Phase Distinction RGB.
A preliminary Quick Guide for the Day Cloud Type RGB is here. XML Code used to add this RGB to AWIPS is available from the blogpost author.
View only this post Read Less


