Using gridded NUCAPS lapse rate to identify (and track) Elevated Mixed Layers
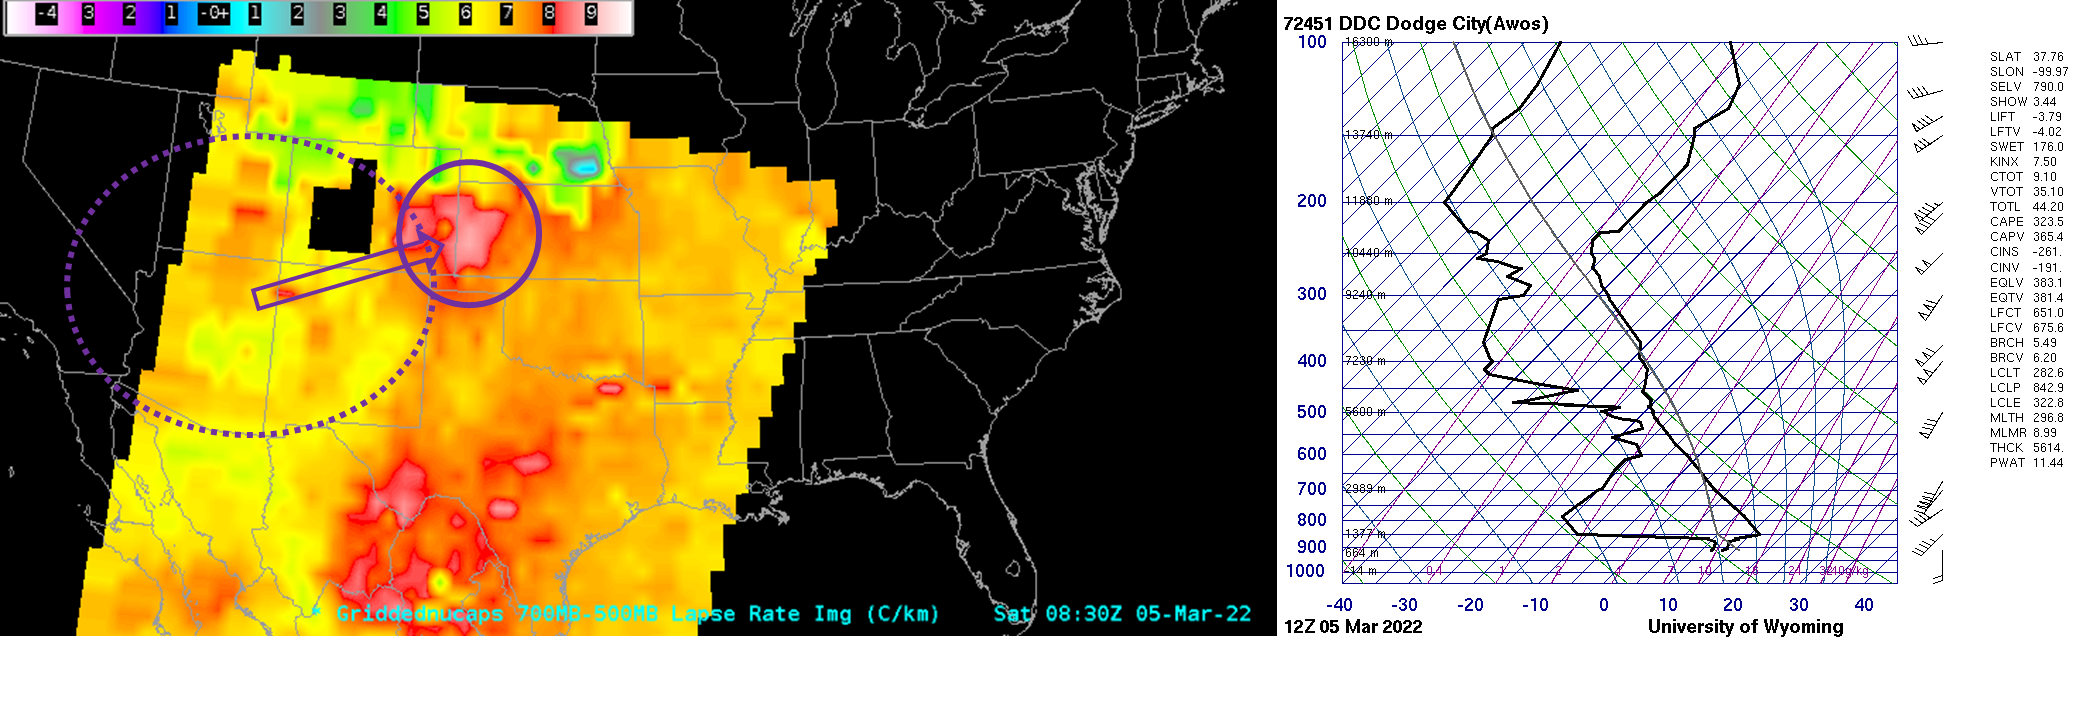
The animation above shows a progression of mid-tropospheric lapse rates between late on 4 March and late on 6 March 2022. The purple circles enclose regions of steep mid-level lapse rates; dotted purple circles show the location of the steep mid-level lapse rates in the previous image. This slow animation... Read More
