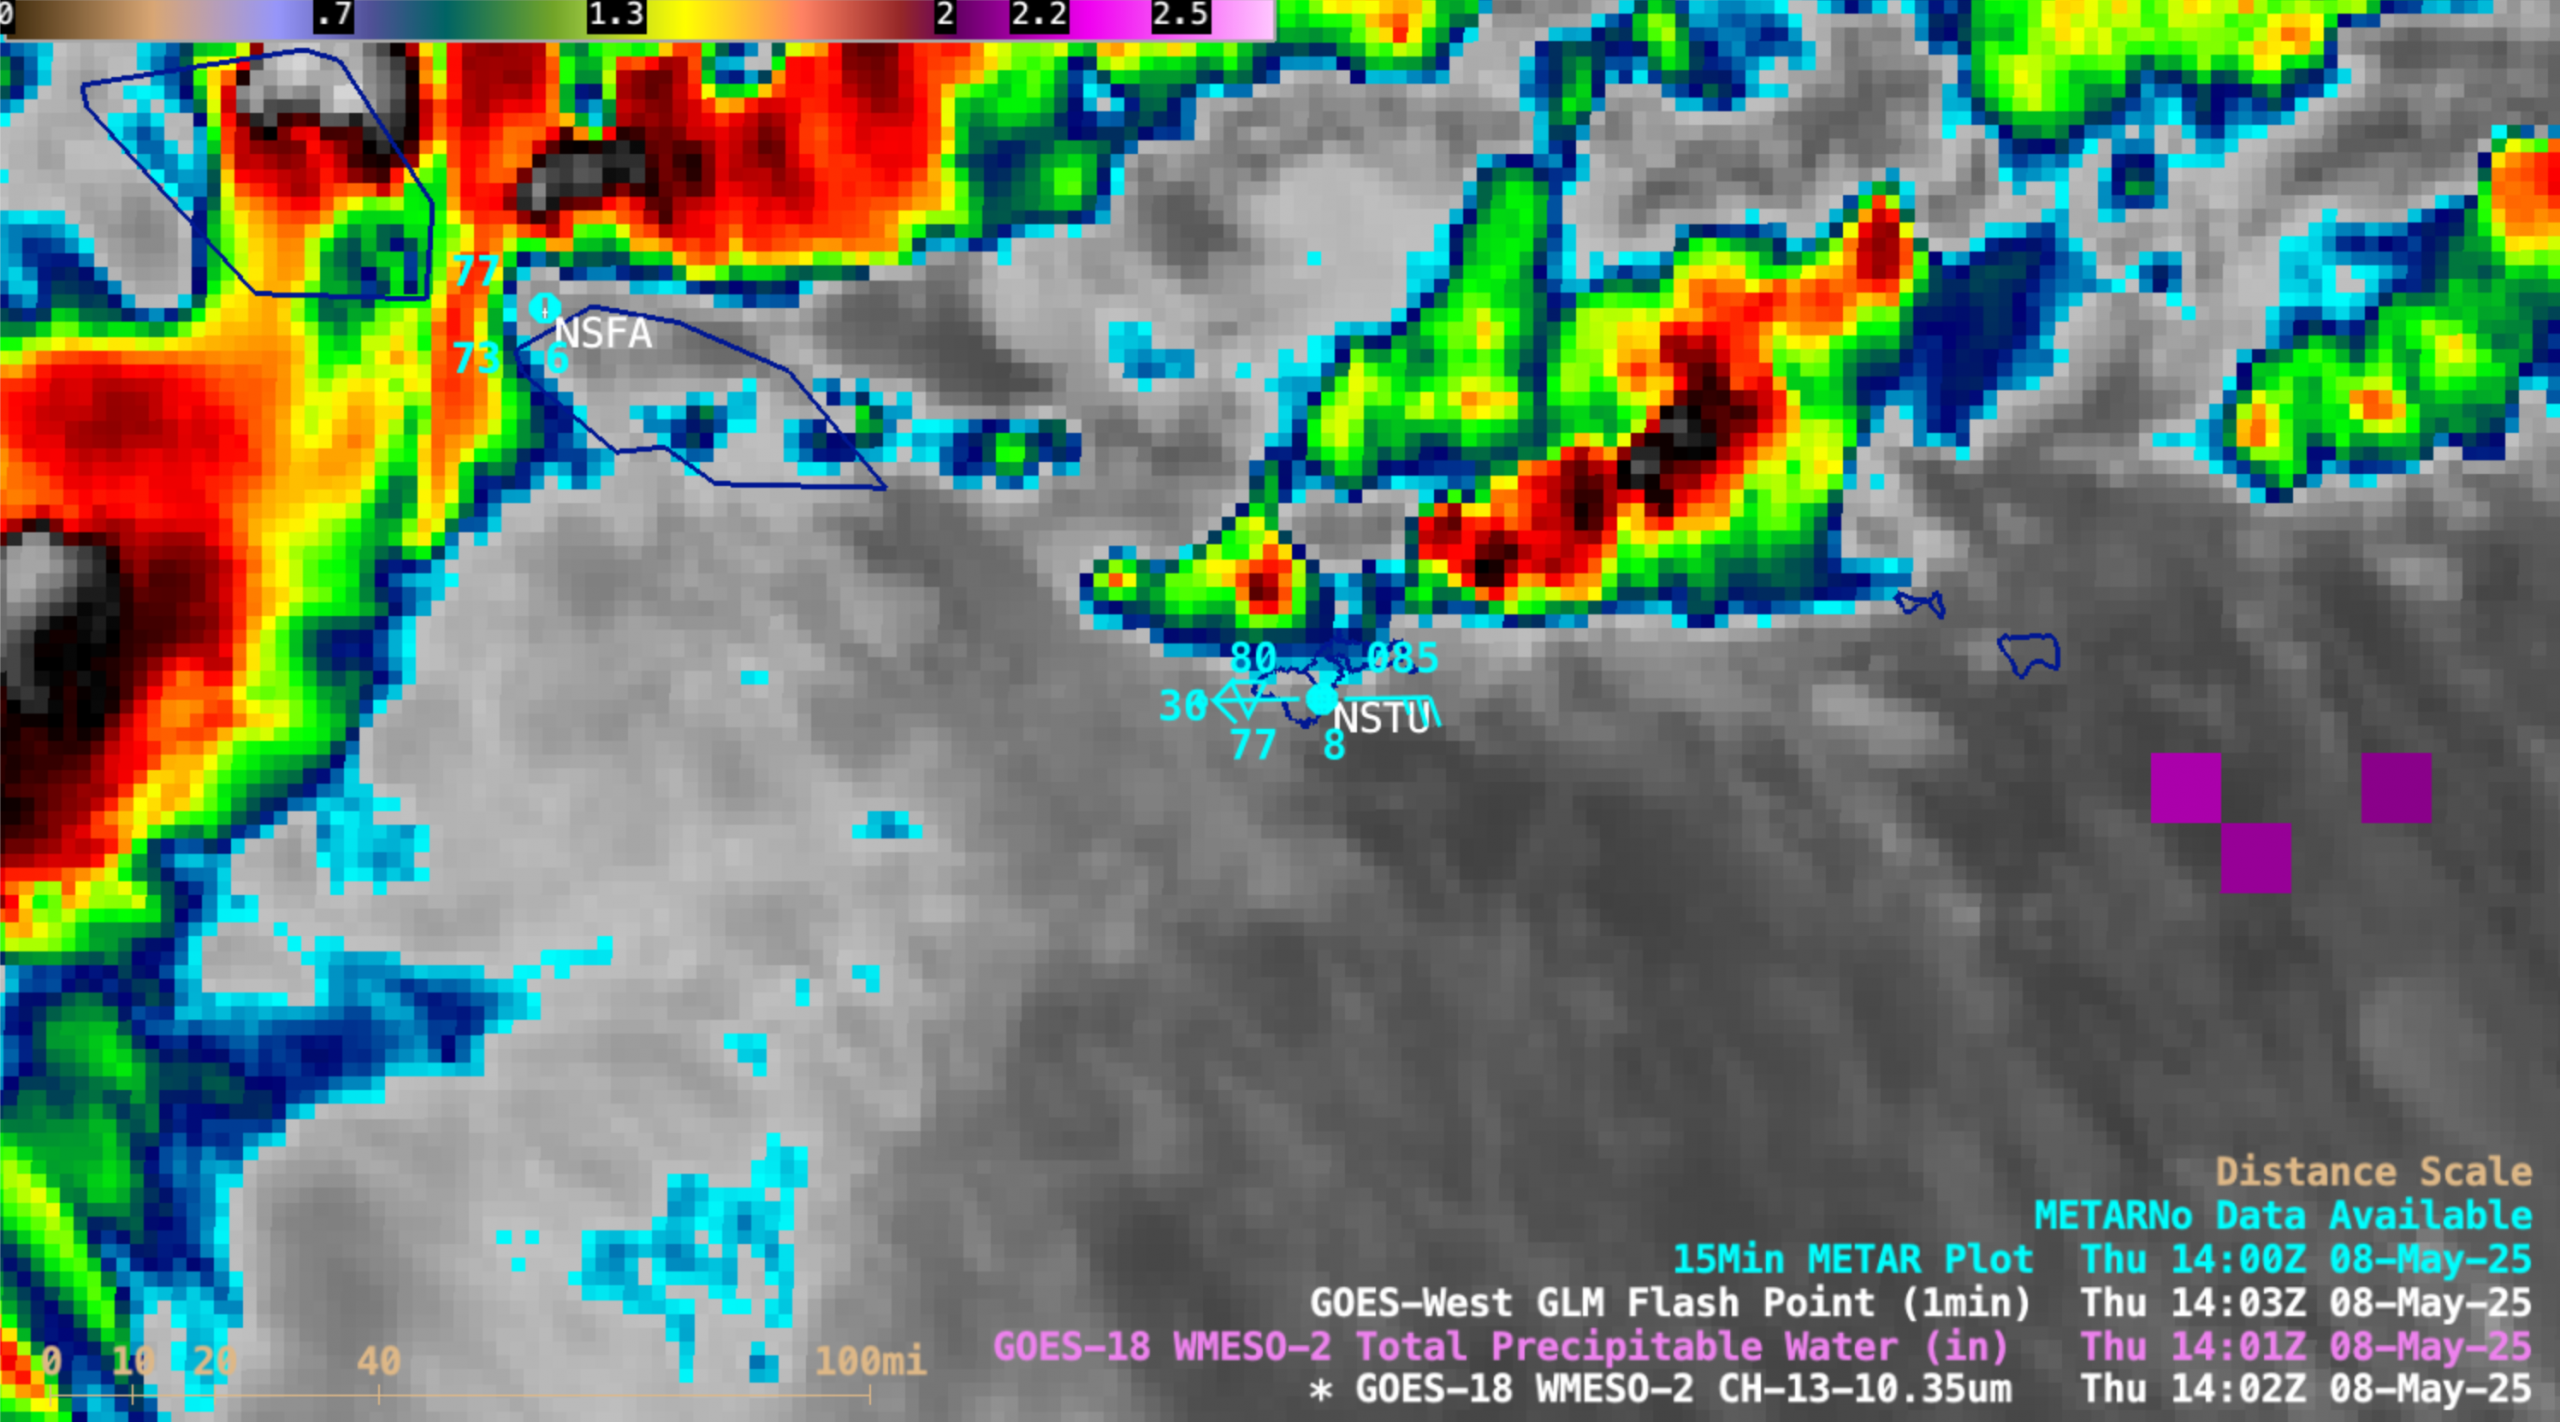

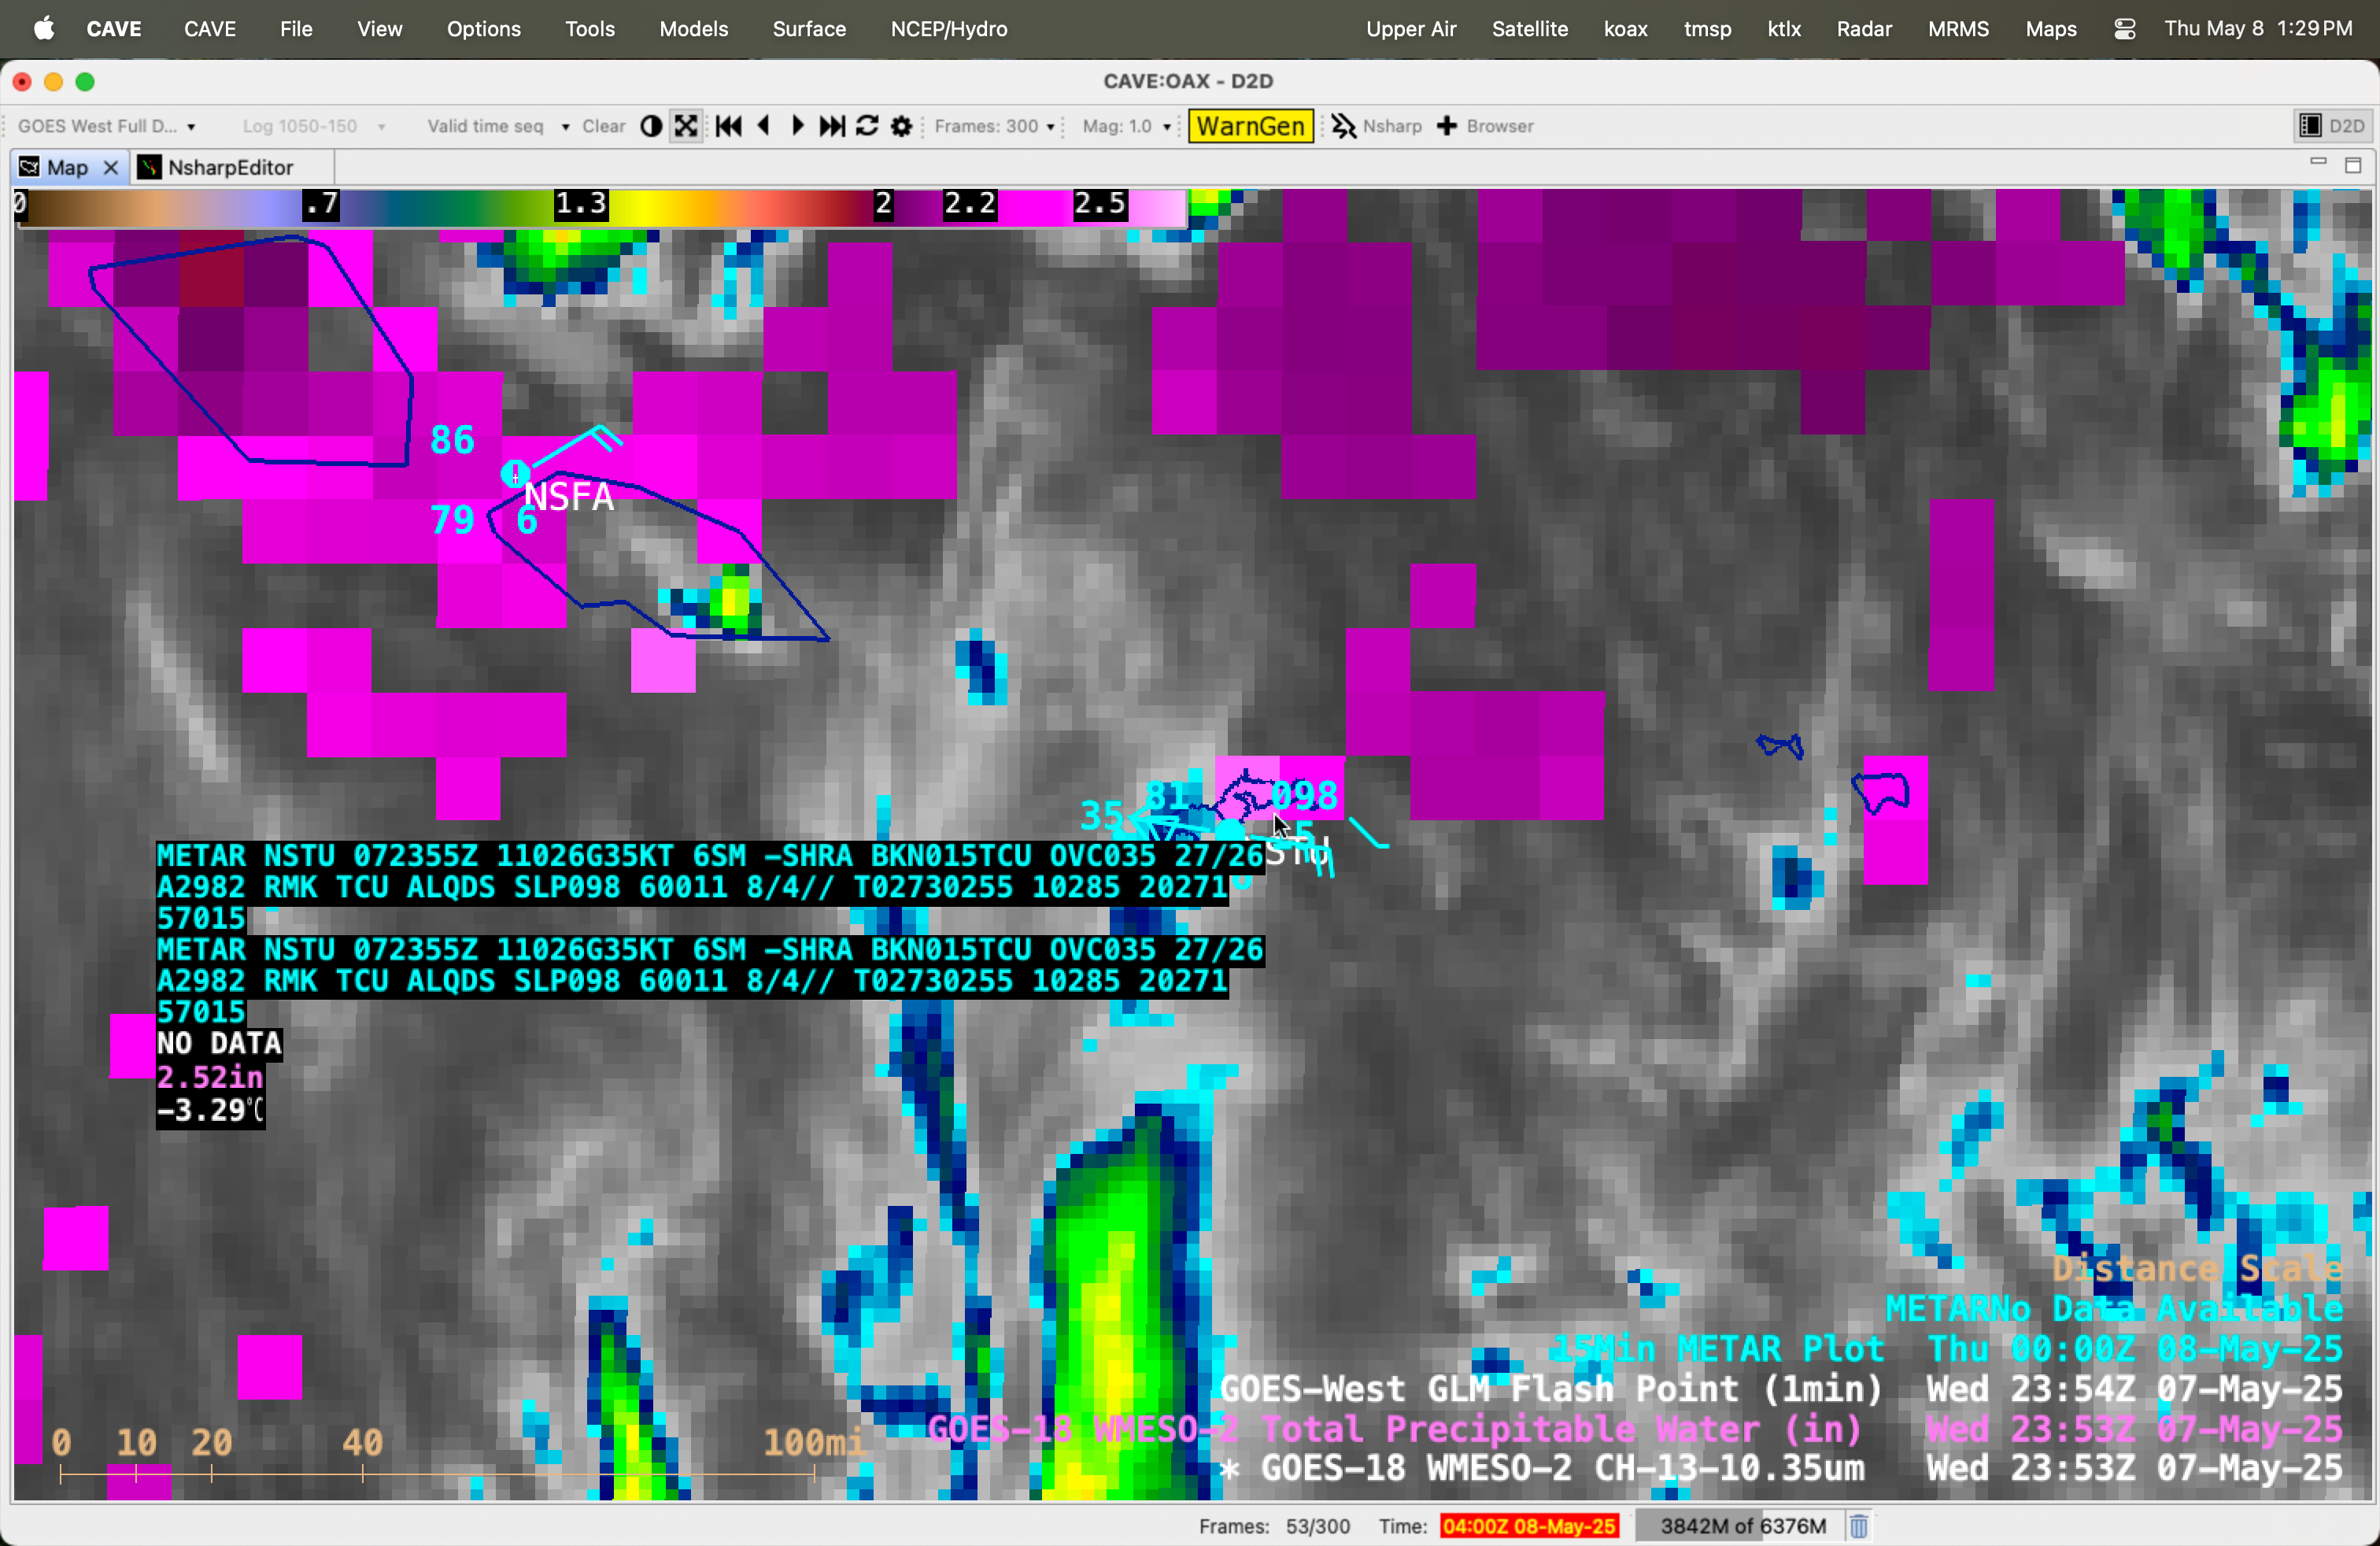
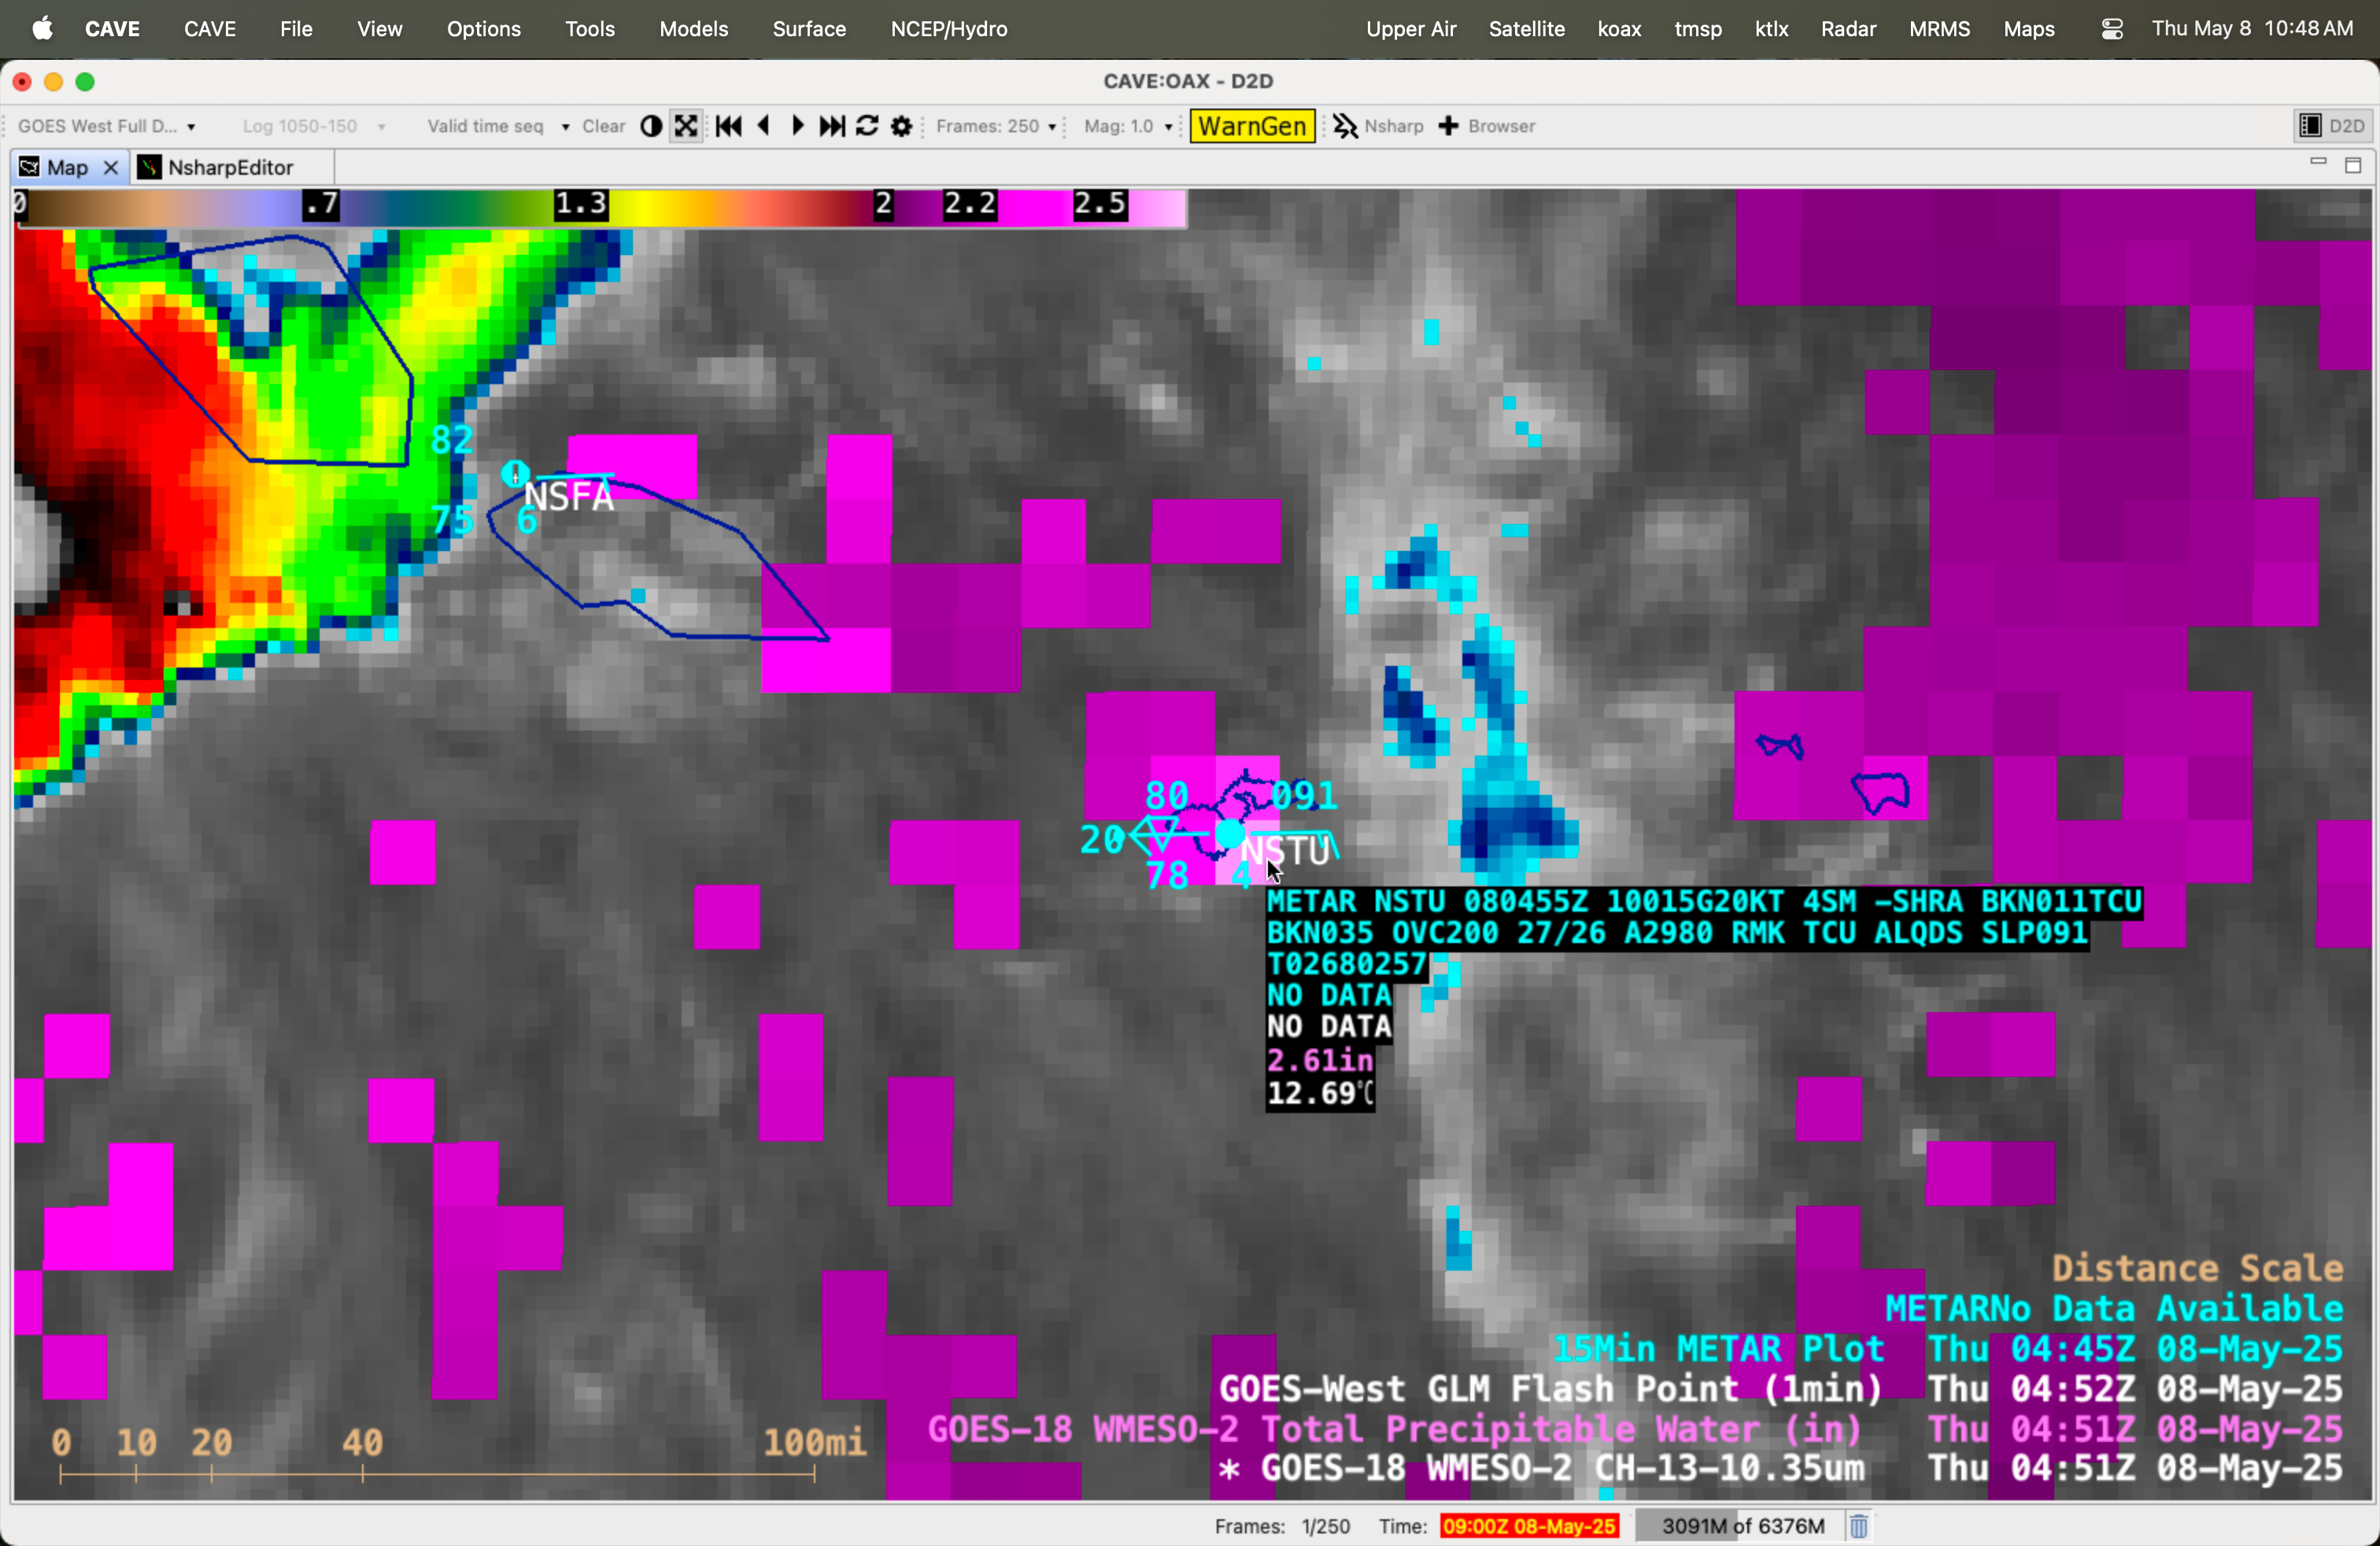
Due to a lack of radar coverage over American Samoa, WSO Pago Pago requested 1-minute Mesoscale Domain Sector coverage over the islands to monitor convective development and the potential for flash flooding. GOES-18 (GOES-West) Clean Infrared Window (10.3 µm) images (above) showed showers and thunderstorms that developed in the general vicinity of the American Samoa island of Tutuila (where Pago Pago International Airport NSTU is located) on 08 May 2025. The coldest cloud-top infrared brightness temperatures associated with some of these thunderstorms were in the -80 to -85ºC range (shades of violet to purple embedded within brighter white regions). GLM Flash Points indicated that there was only intermittent lightning activity with this convection (and the lightning occurred north of Tutuila — no thunderstorms or lightning was reported at Pago Pago).
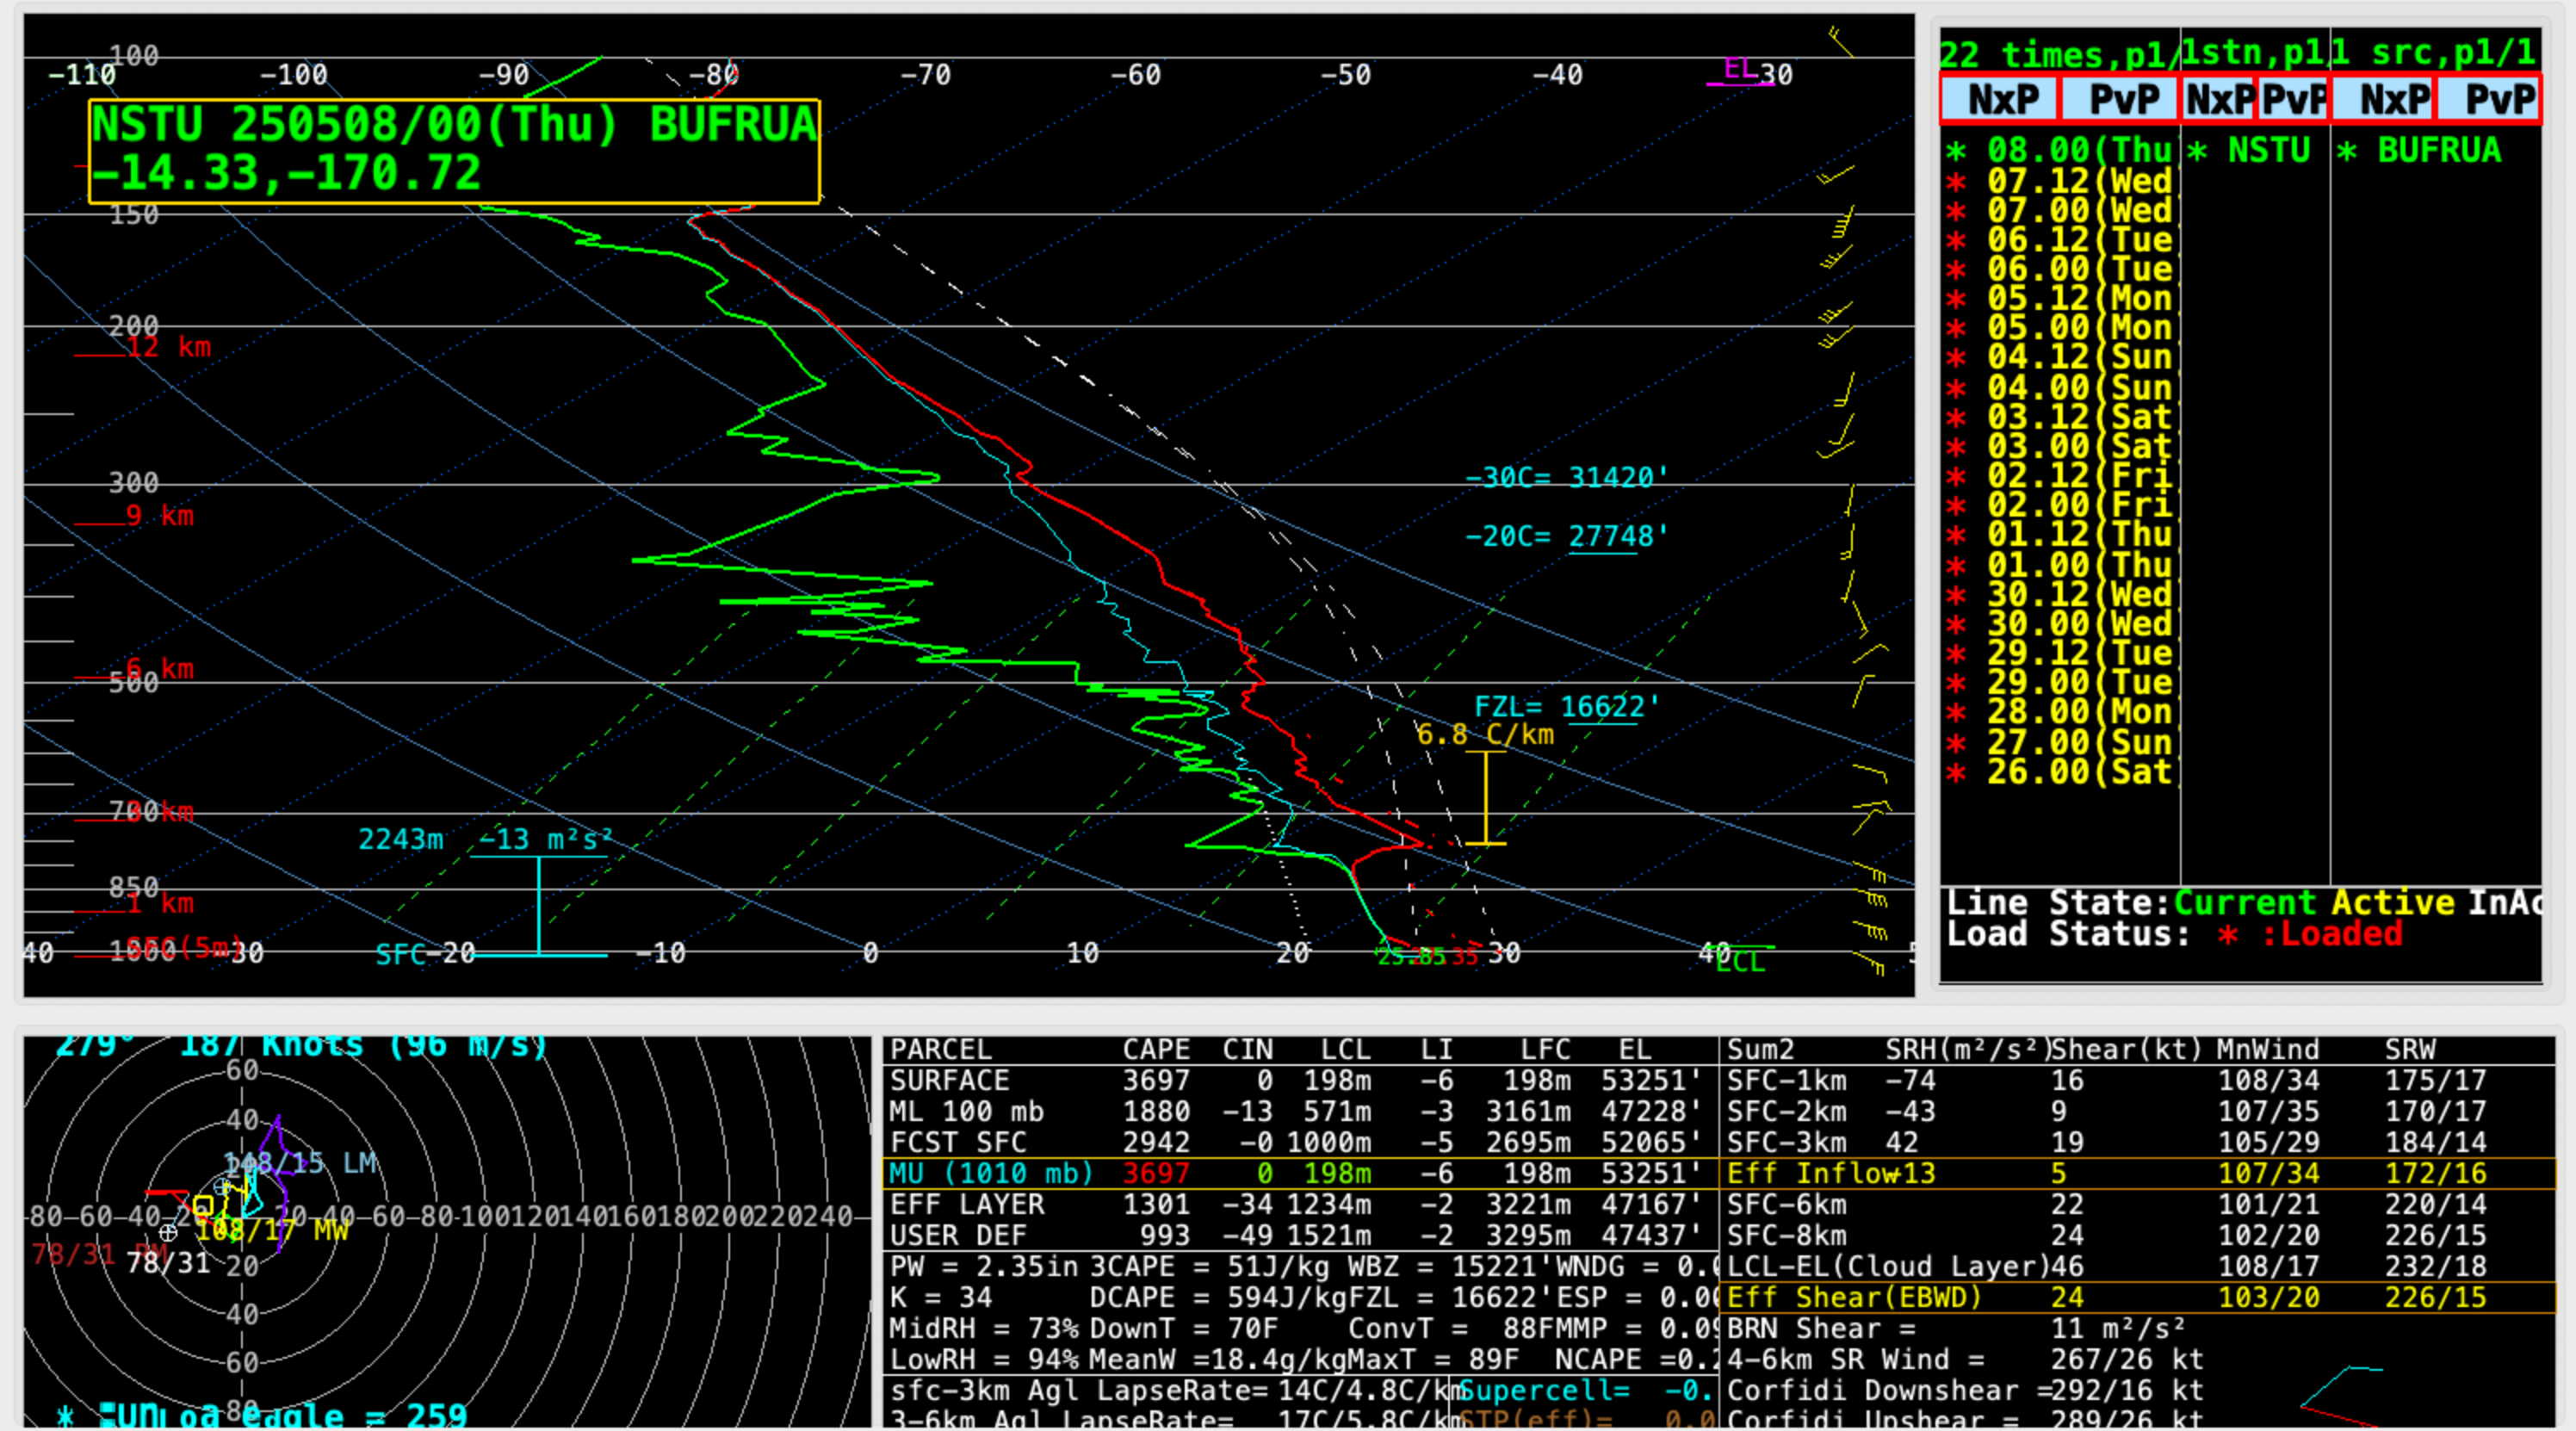
A plot of rawinsonde data from Pago Pago at 0000 UTC (below) displayed a Total Precipitable Water (PW) value of 2.35″ — and a GOES-18 derived Total Precipitable Water value near Tutuila around that time was somewhat higher at 2.52″ (GOES-18 derived Total Precipitable Water values in the vicinity of the island were as high as 2.61″ at 0451 UTC).
The MIMIC Total Precipitable Water product (below) showed that American Samoa (centered at 14.3ºS, 170.7ºW) was situated along the southern edge of a broad east-to-west oriented band of high moisture just north of the islands.
Hourly MIMIC Total Precipatable Water product, from 0000 UTC on 07 May to 2300 UTC on 08 May
_____________
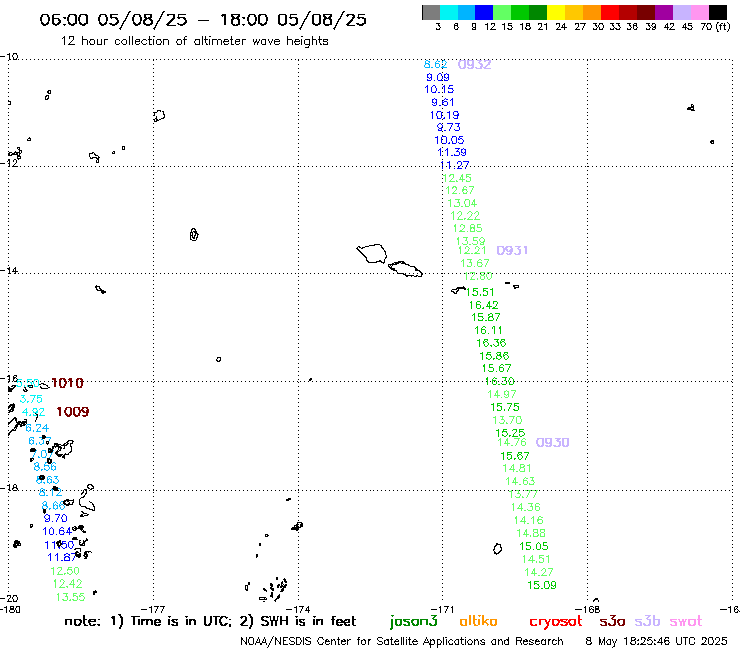
Sentinel-3B altimeter Significant Wave Height at 0931 UTC on 08 May
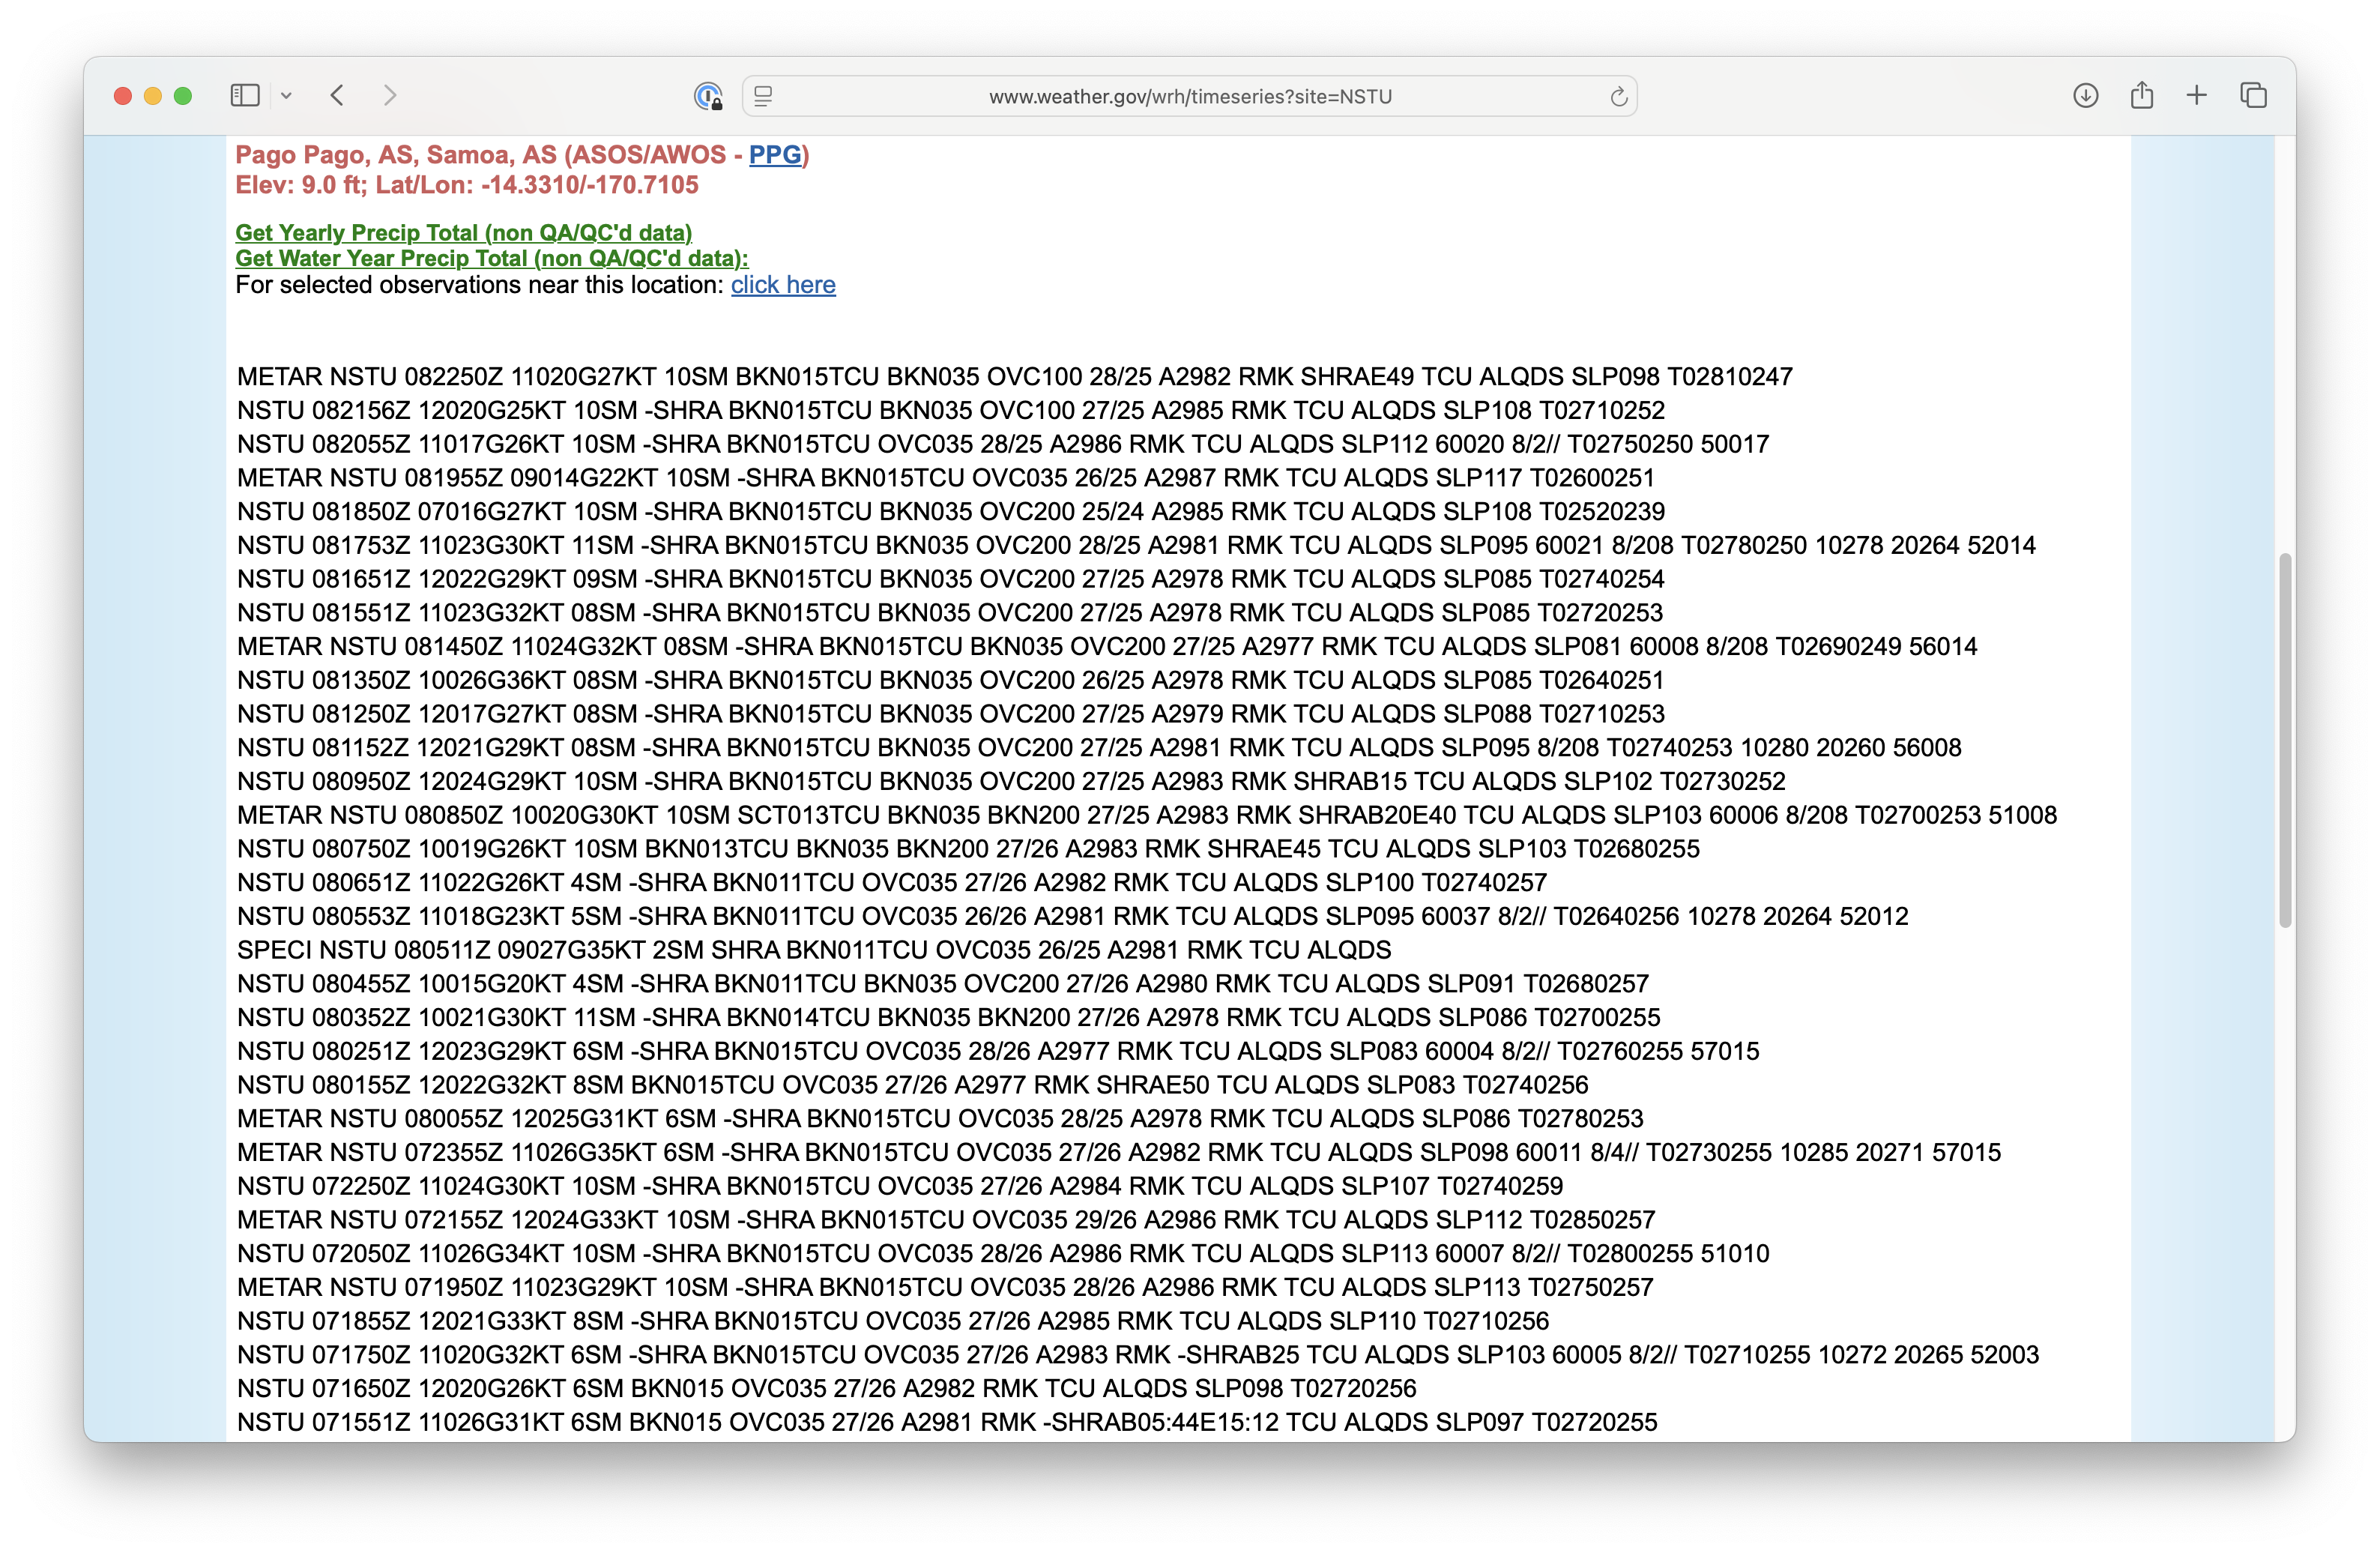
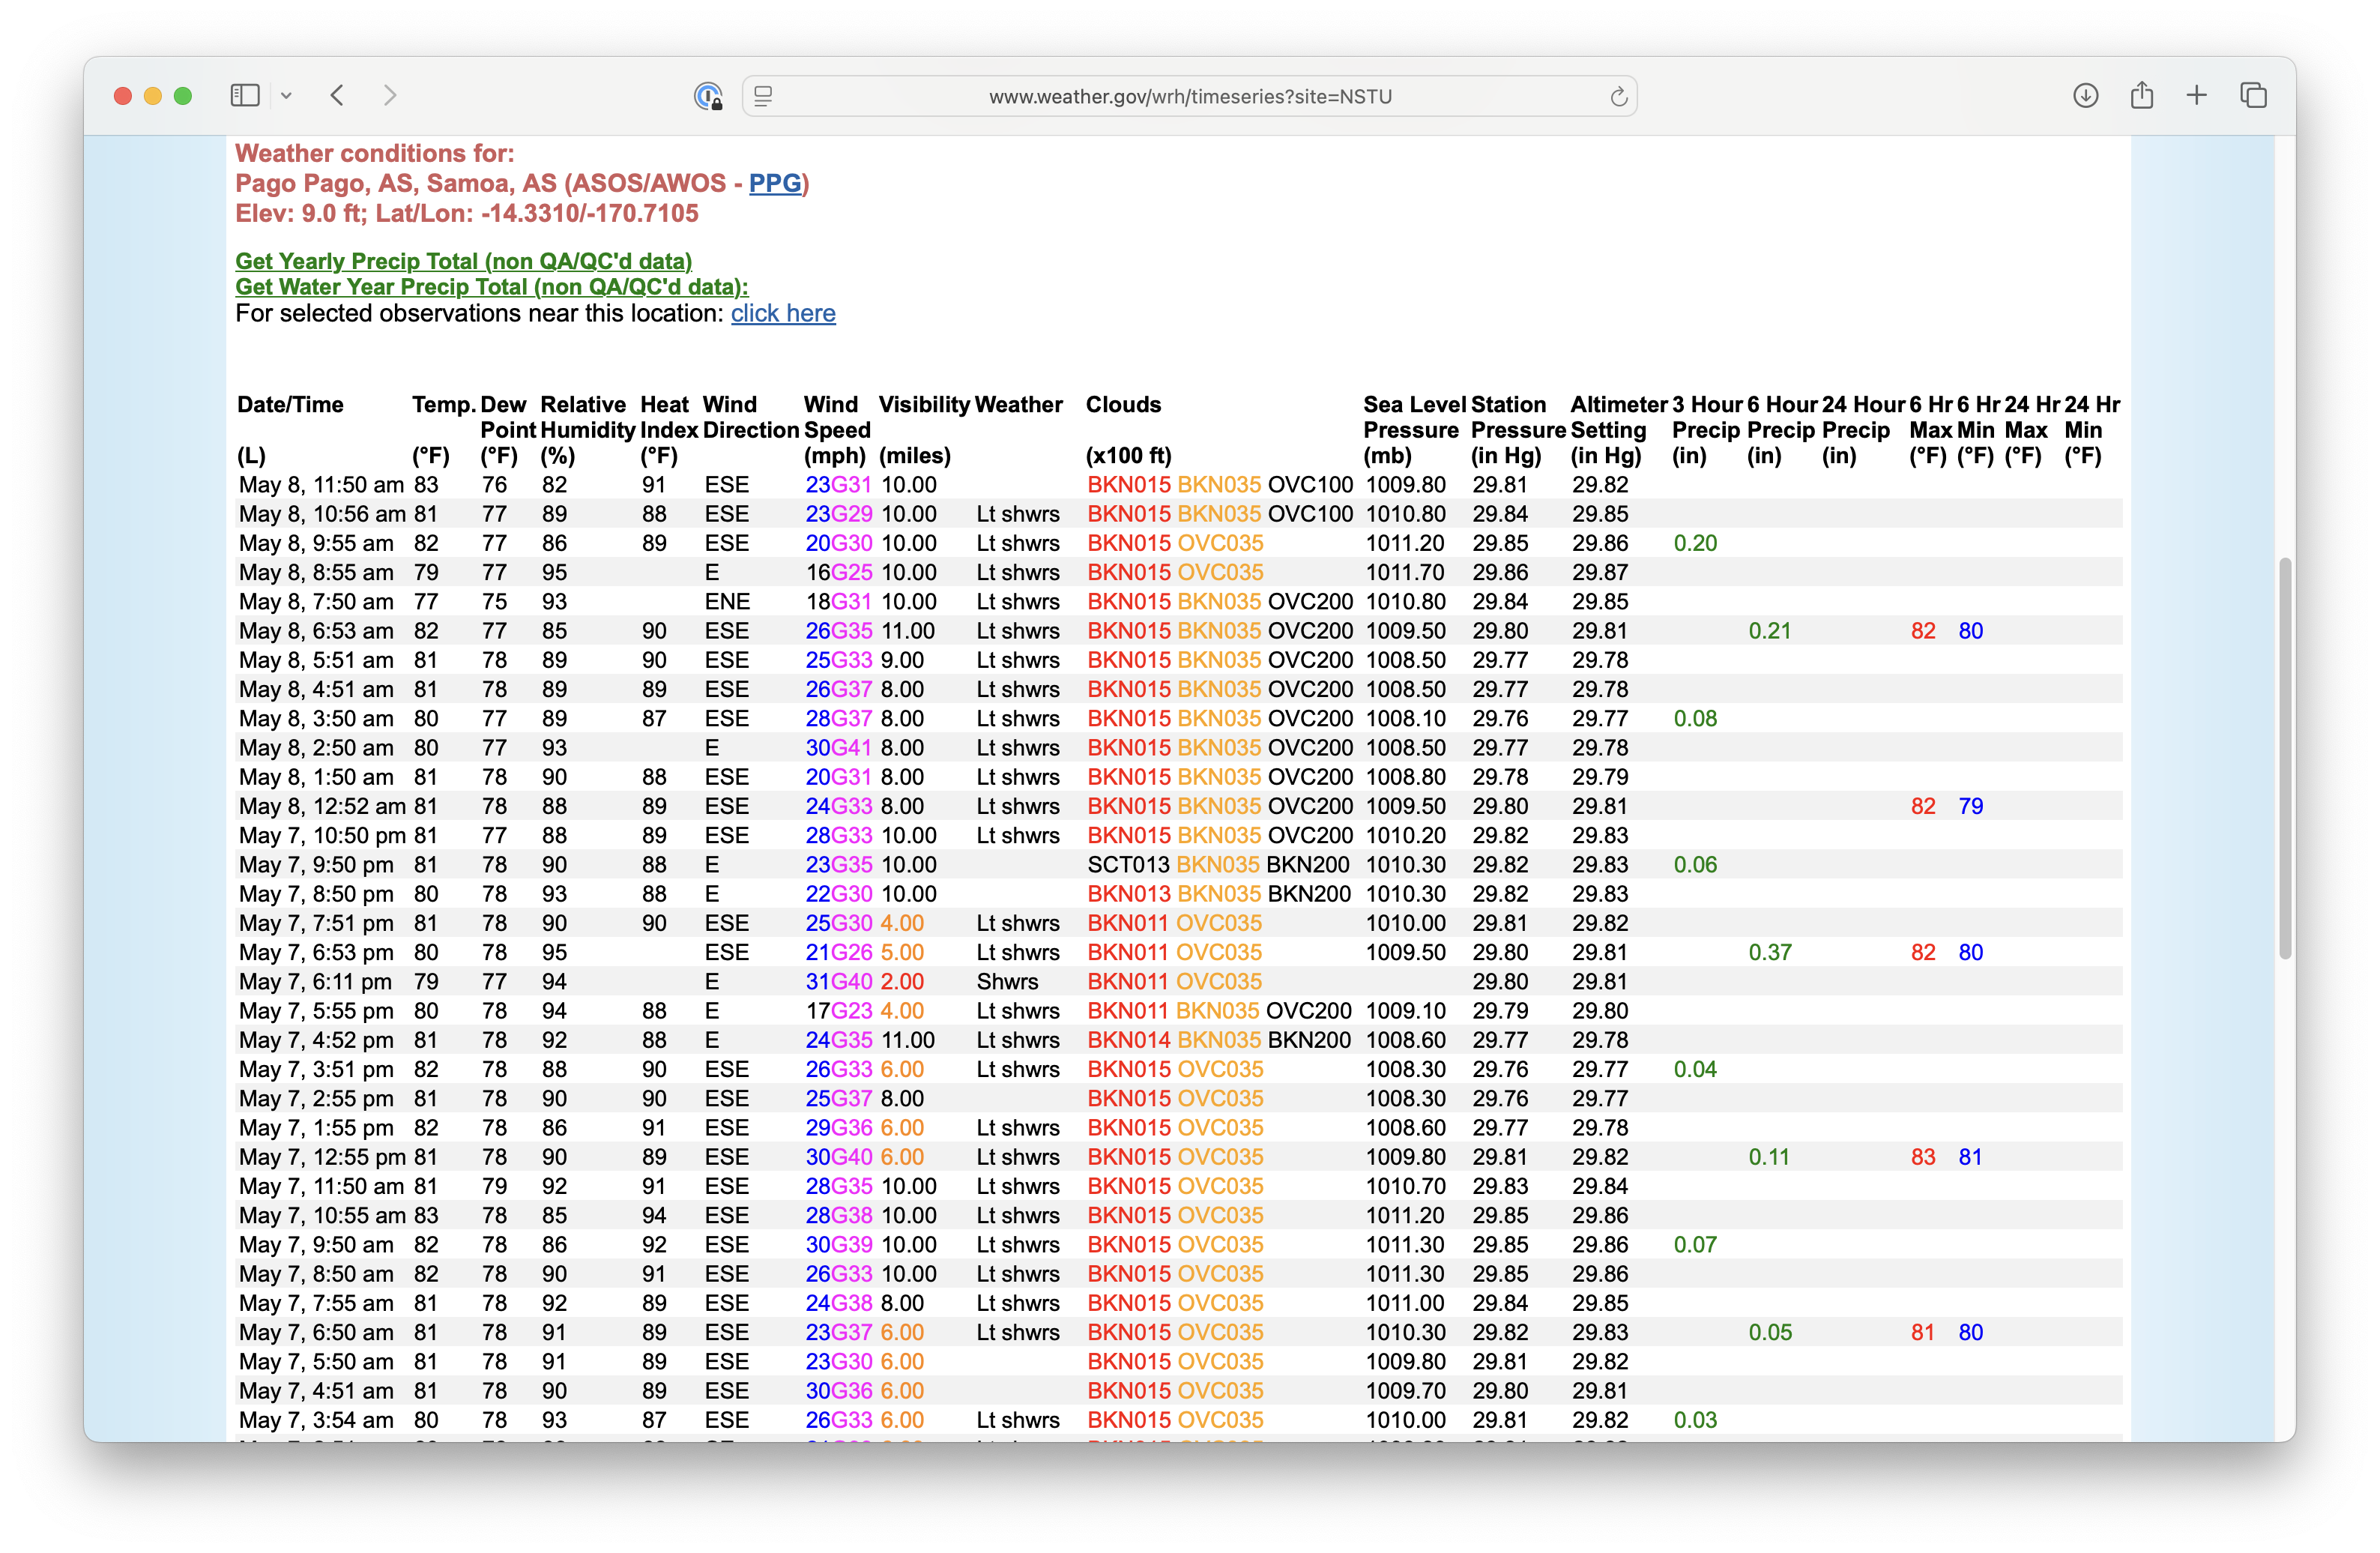
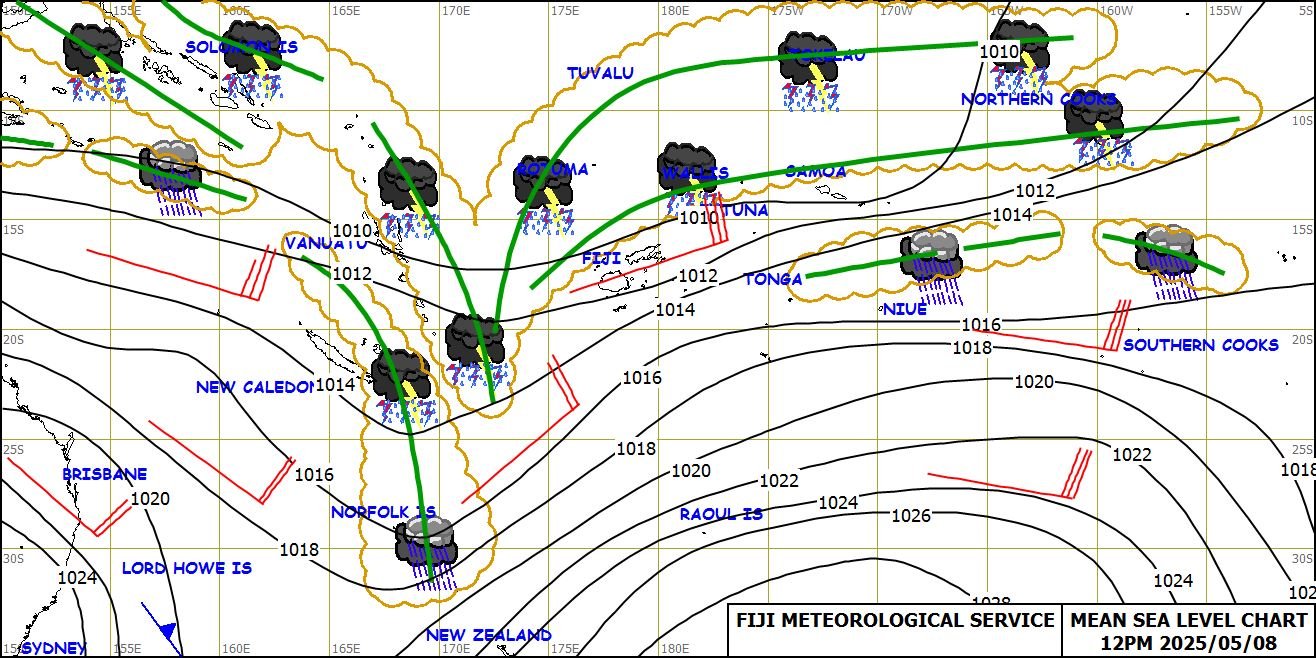
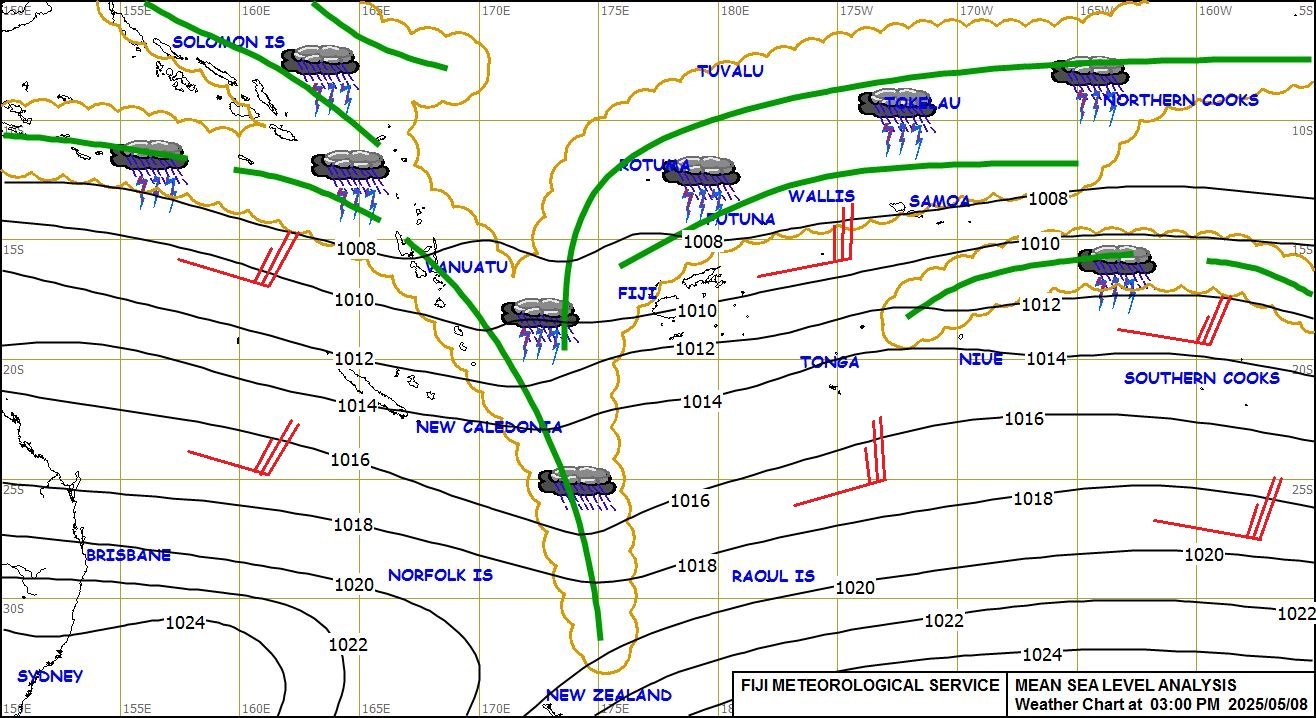
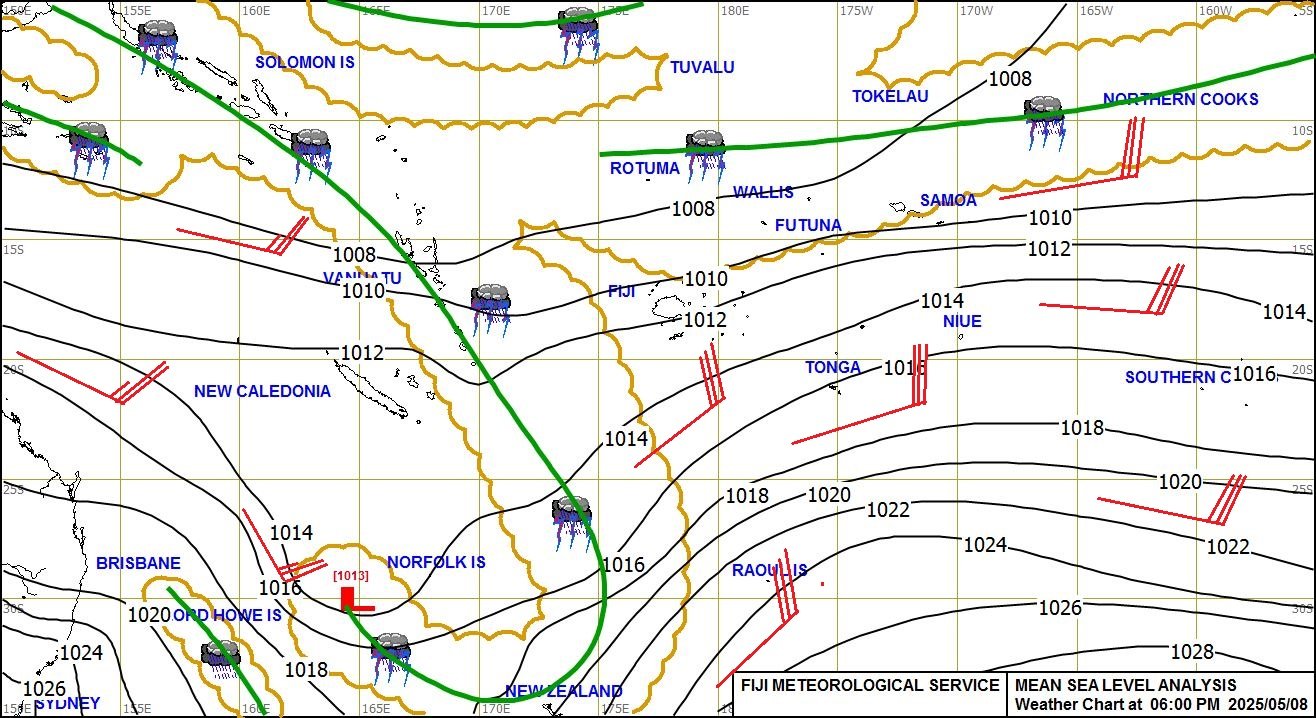
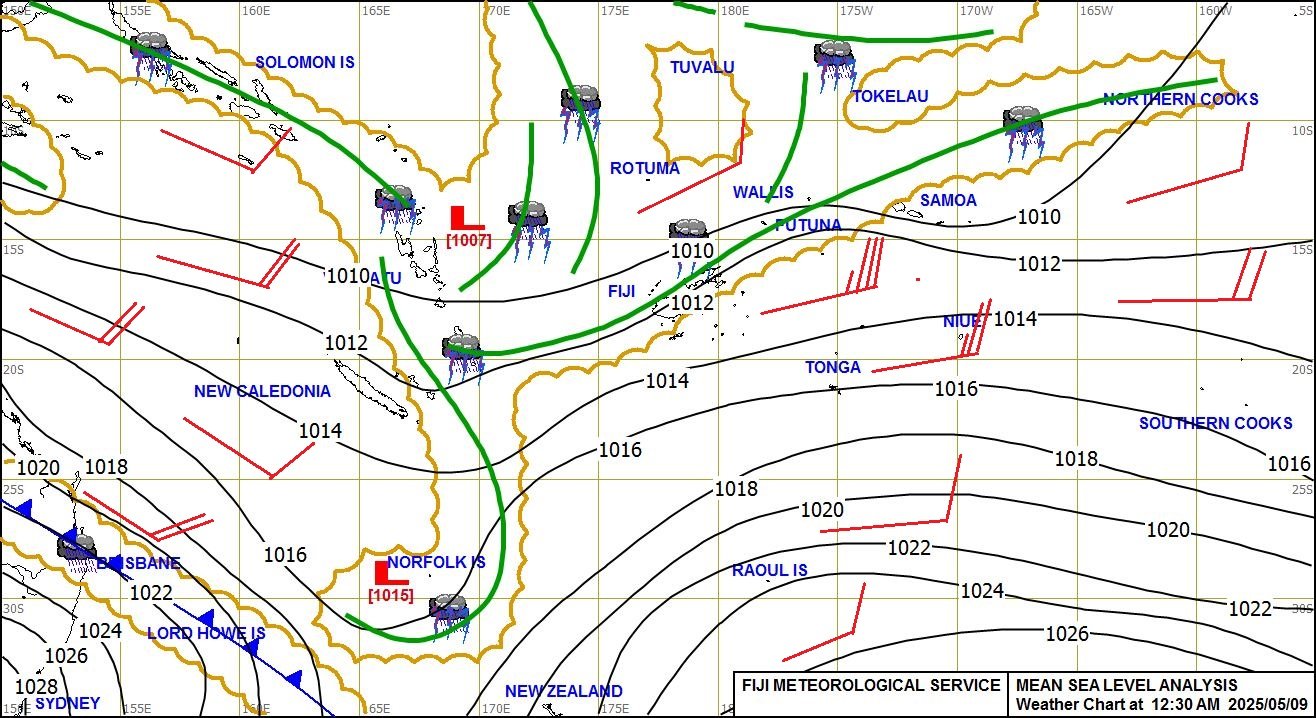
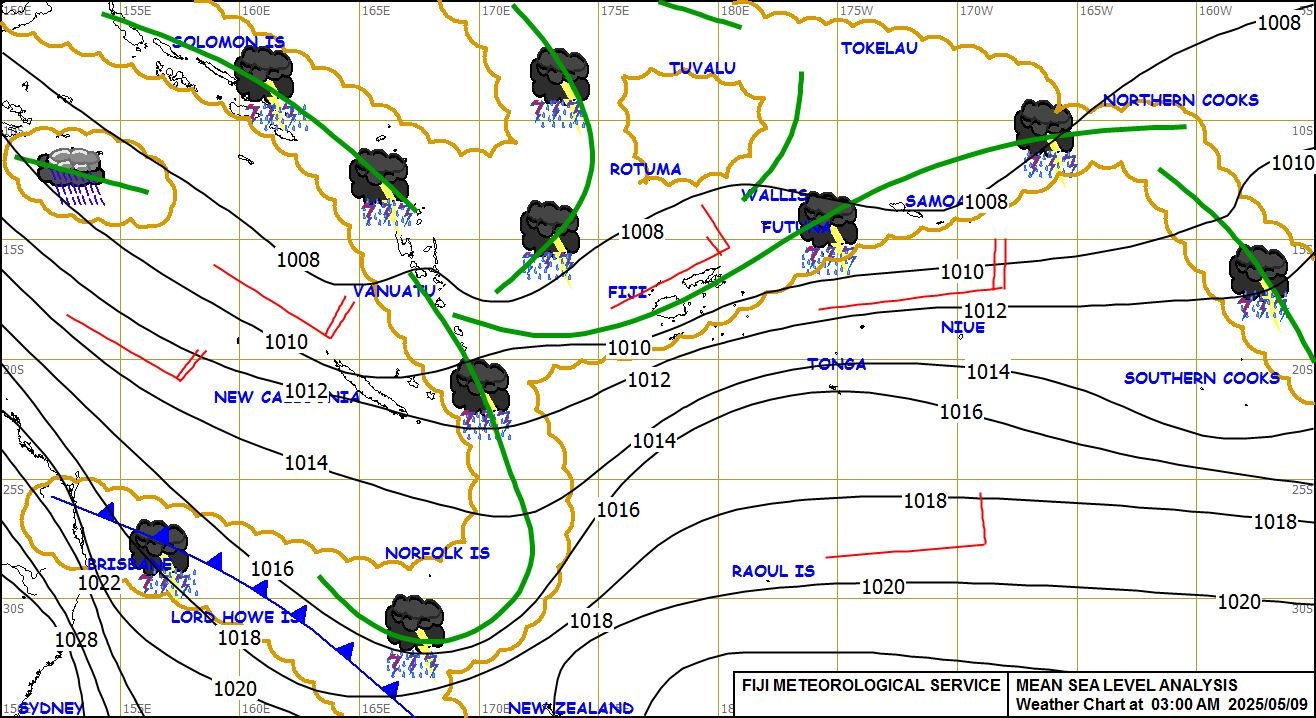
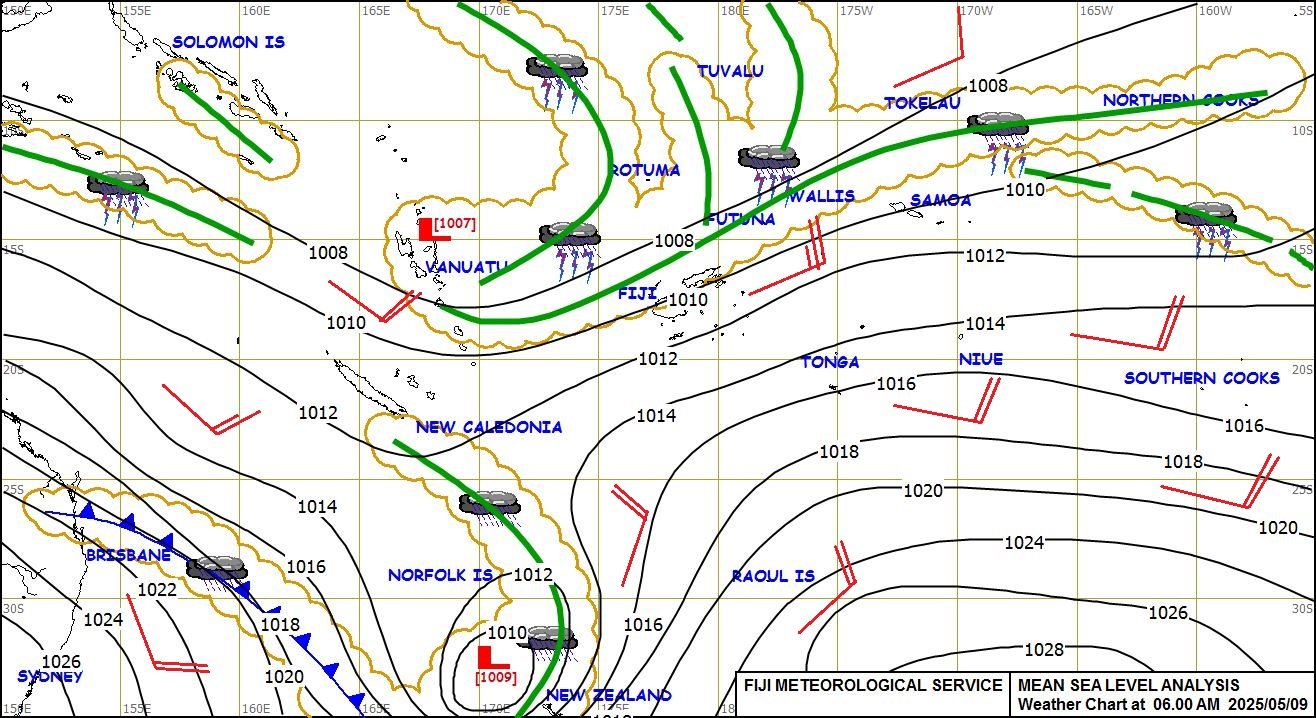
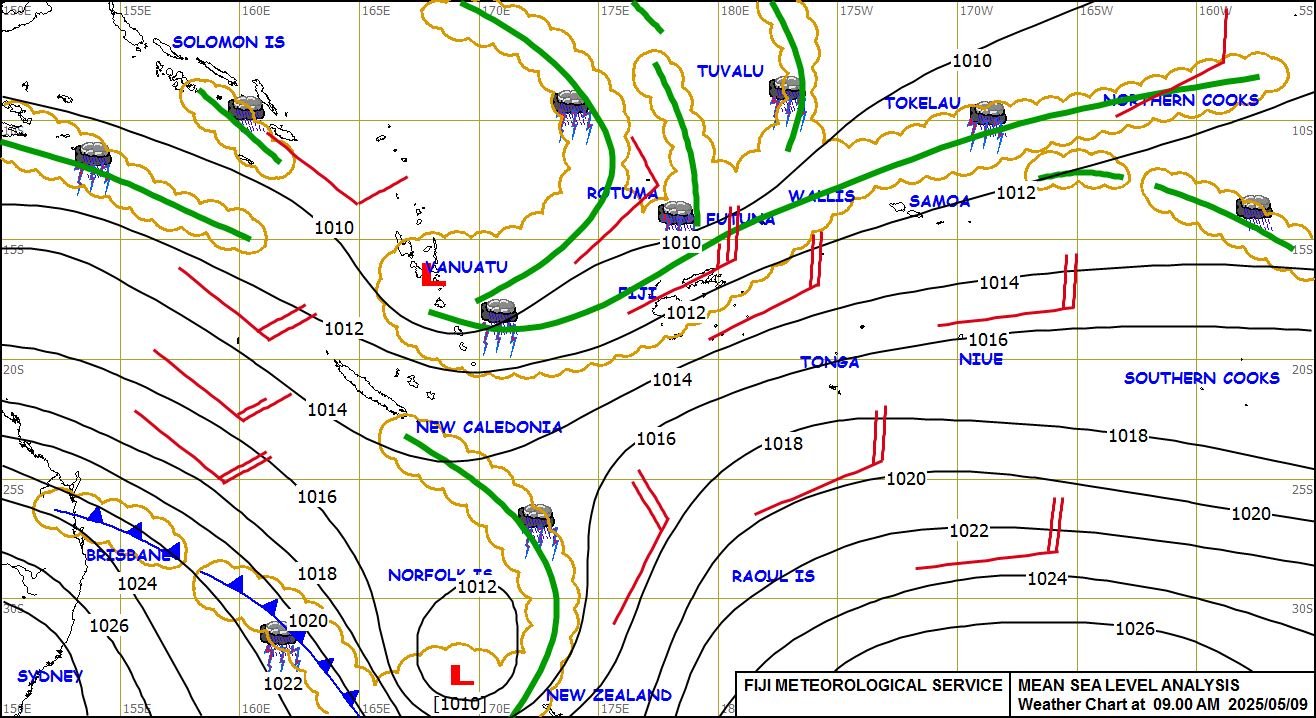
East-southeast surface winds at Pago Pago during this time period were gusting as high as 36 kts or 41 mph (METAR list | Decoded surface reports) — and these winds were creating Significant Wave Heights of 15-16 feet just east and southeast of the island of Tutuila at 0931 UTC (above). Widespread moderate southeasterly winds across the Samoan Islands region were caused by the pressure gradient between a trough of low pressure just north of the islands (along which the more pronounced convective activity was focused) and high pressure to the south (mean sea level analyses: 0000 UTC | 0300 UTC | 0600 UTC | 1230 UTC | 1500 UTC | 1800 UTC | 2100 UTC) — and the broad areal coverage of these winds was depicted in OSCAT-3 scatterometer data at 1158 UTC (below).
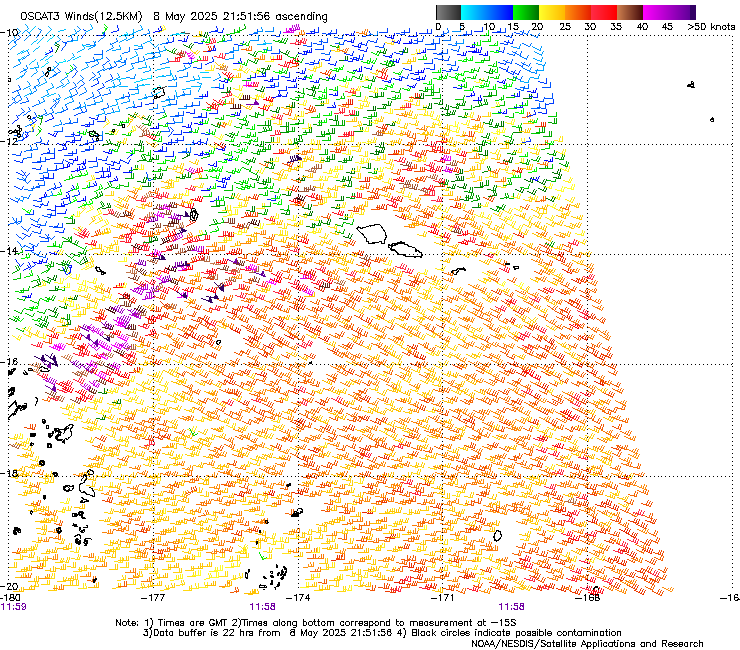
OSCAT-3 scatterometer winds at 1158 UTC on 08 May
The combination of these winds and periodic heavy rainfall was responsible for some flooding and wind damage across parts of Tutuila (Local Storm Reports).
GREMLIN (GOES Radar Estimation via Machine Learning to Inform NWP) fields use ABI and GLM data to estimate what radar reflectivity might look like. From 0700-1200 UTC on 8 May (below), GREMLIN showed heavier rains northwest of Samoa, but coverage is slowly increasing.
Between 1400 and 1700 UTC (below), rains have overspread American Samoa, although the bulk of the rains are to the north. (Note: GREMLIN fields are not parallax-corrected).
Between 1720 and 1920 UTC (below), rains continue, and they are widespread.
Widespread rains start to dissipate over Tutuila between 2100 and 2330 UTC, as shown below.
GREMLIN fields are available at the CIRA Slider.
View only this post Read Less


