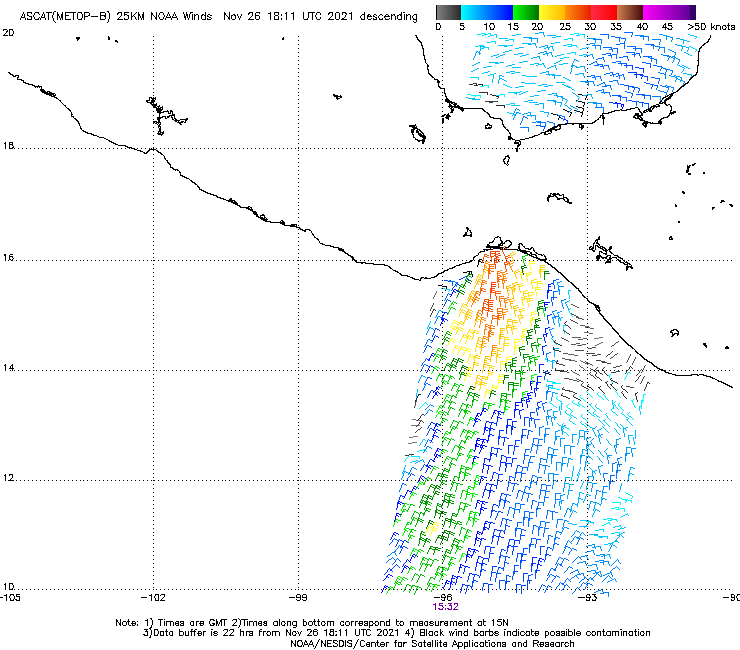
GOES-16 True-Color imagery from the CSPP Geosphere site (link showing the data above) on 26 November, above, show features associated with strong flow through Chivela Pass in southern Mexico, gap winds often called Tehuano winds or Tehuantepecers. Strong descent associated with these events can often limit the presence of clouds that can be used as tracers. However, scatterometry (from this website) will show surface winds, and an MetopB overpass shortly after the end of the animation above, below, shows a core of strong winds over the ocean.
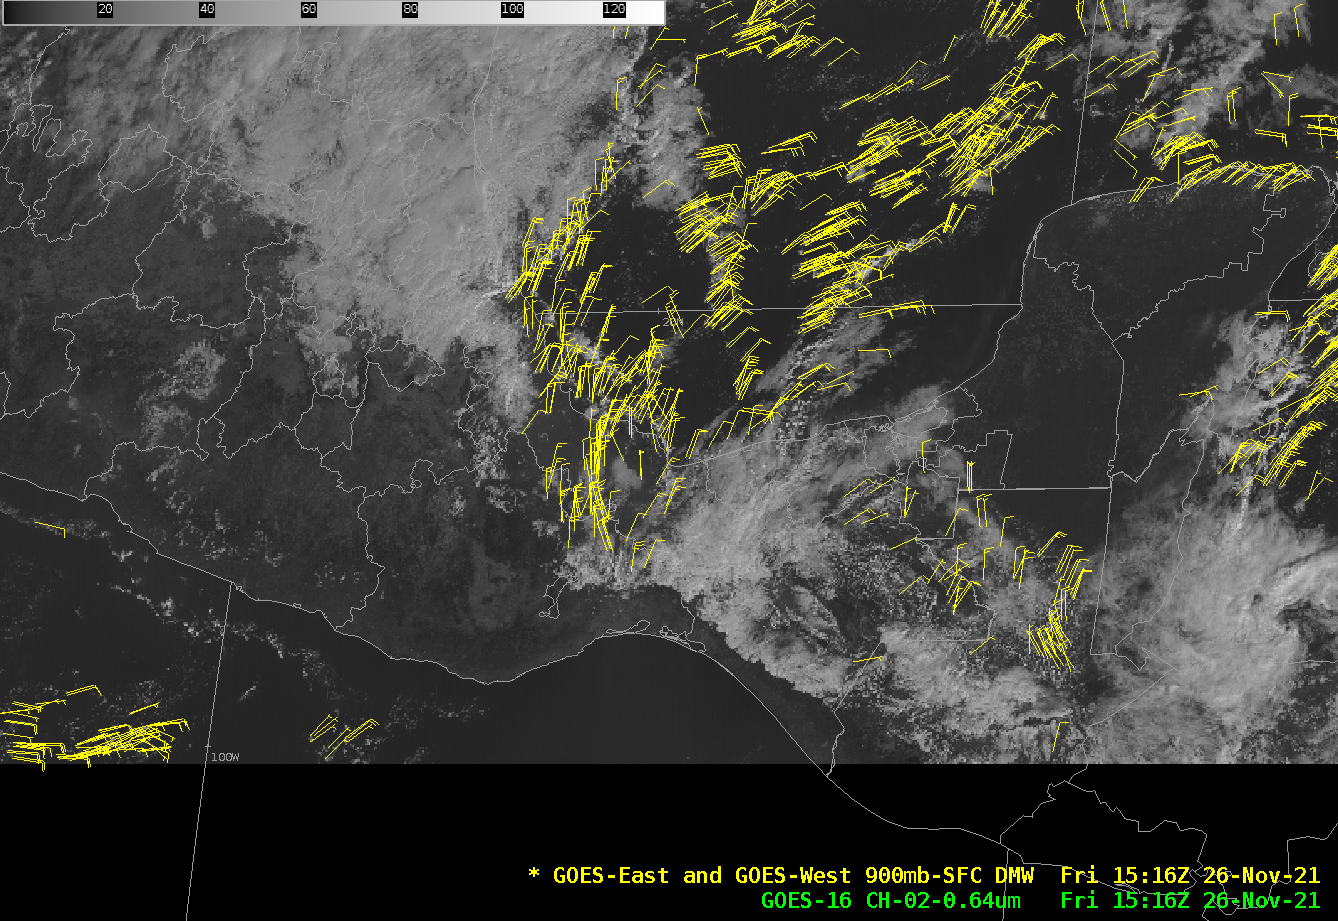
The GOES-16 CONUS domain extends southward to the northern part of the Gulf of Tehuantepec (about 14.6 N Latitude). Visible imagery from 1516 UTC, below, is overlain with the Derived Motion Wind vectors (in the surface – 900 mb layer) at the same time. Strong northerly winds north of Chivela Pass are apparent, but the lack of clouds to track in the Gulf prevented the inference of winds there from the GOES-16 data.
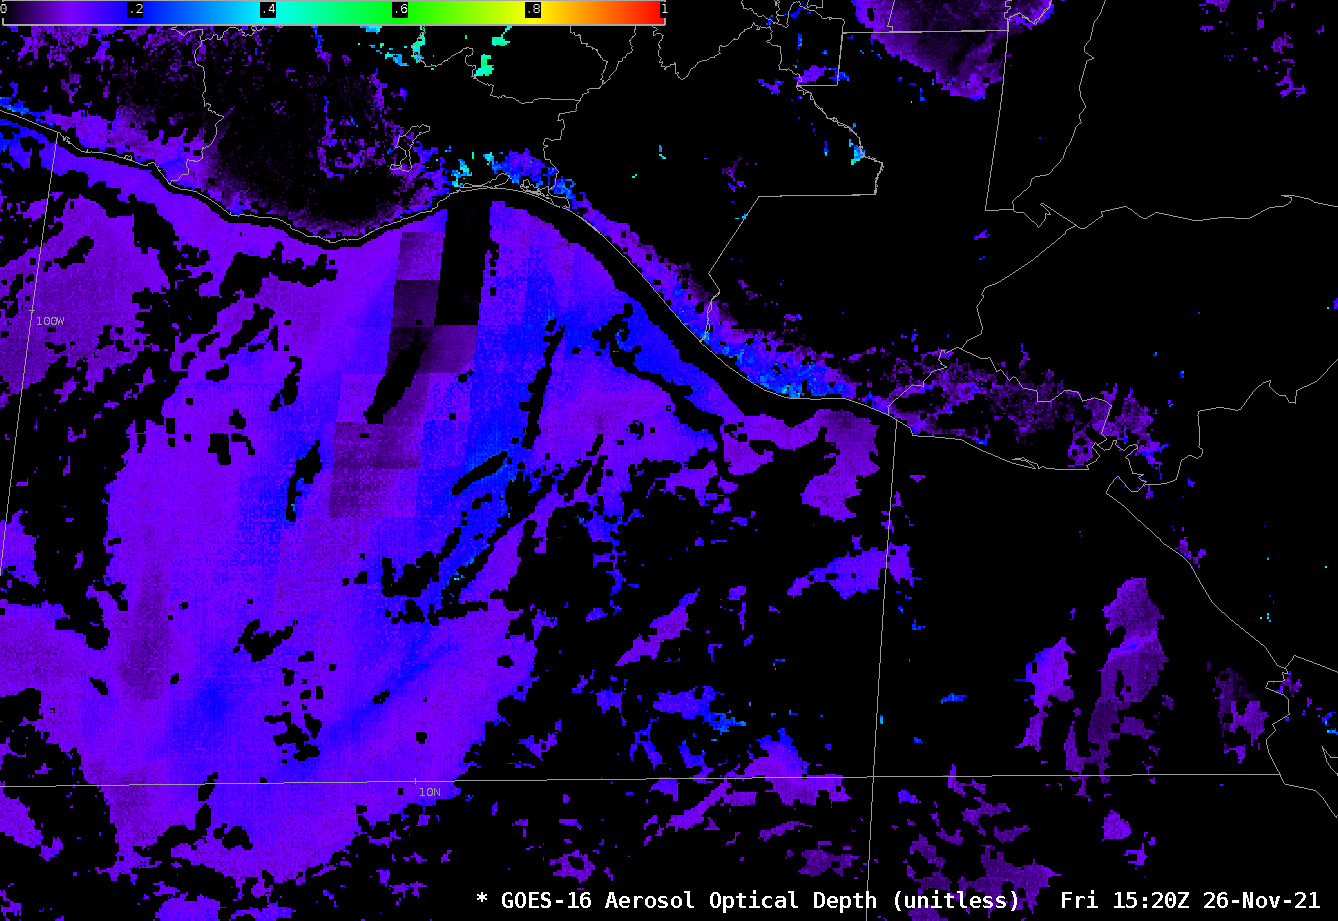
The strong winds are also associated with a local increase in Aerosol Optical Depth (AOD), as shown below.
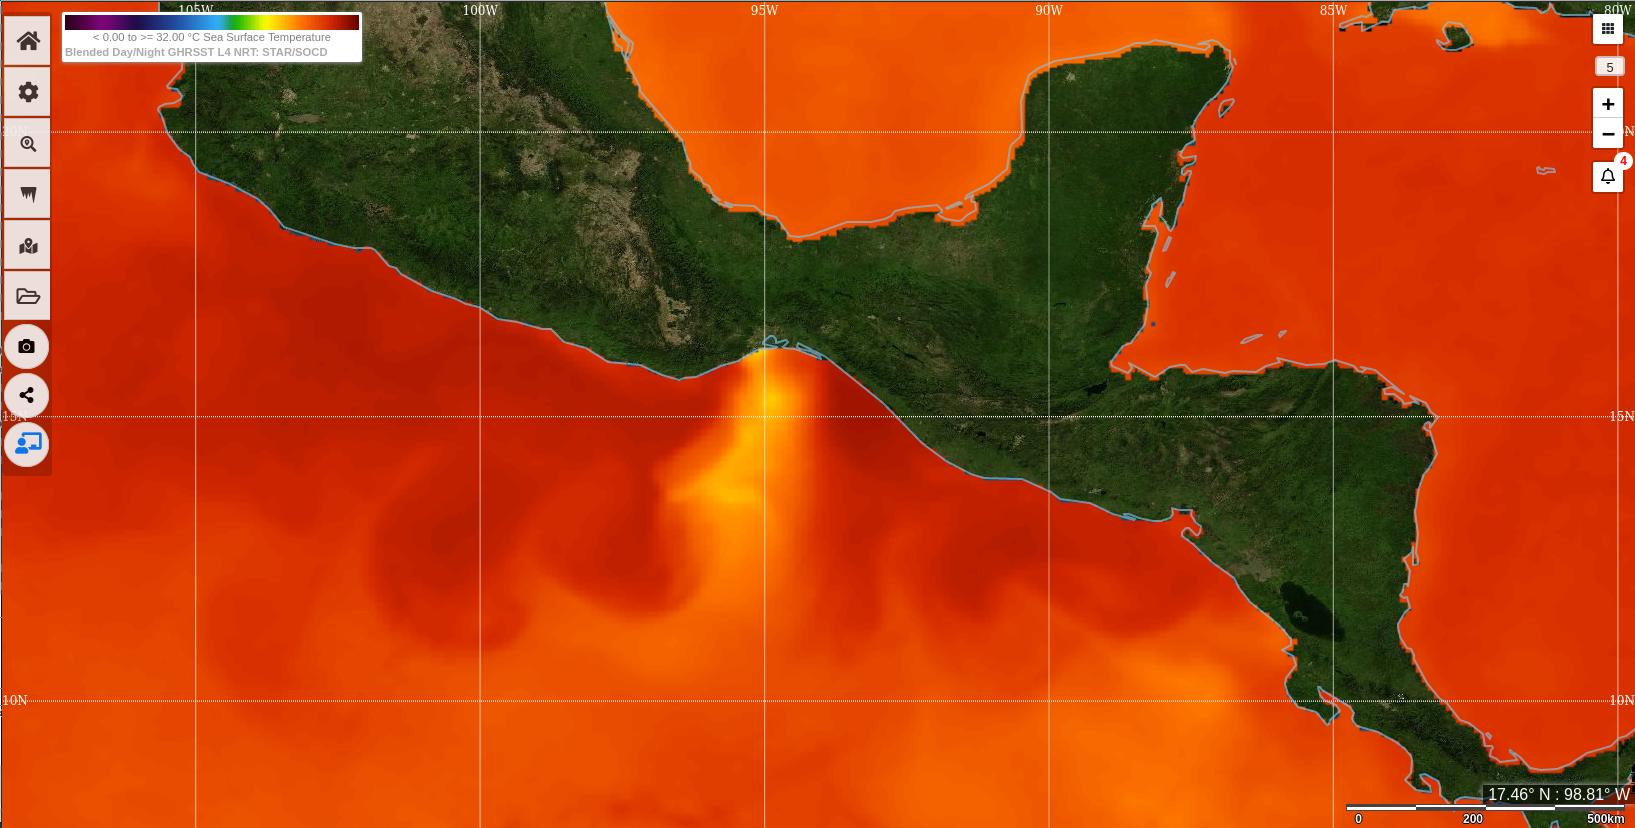
Strong winds will cause significant mixing in the upper part of the ocean, which will result in cooling. Imagery from this website (shown below) shows cooling in the Gulf from previous events. Here is an animation from that website, courtesy Tim Schmit, NOAA/NESDIS/STAR
____________________________________________________________________________________________

GOES-17 True Color RGB images (credit Scott Bachmeier, CIMSS) [click to play animated GIF | MP4]
In GOES-17 True Color images created using Geo2Grid (above), enhanced forward scattering during the morning hours helped to highlight the offshore transport of airborne dust.
Other blog posts discussing similar Tehuano wind events can be found here.
View only this post Read Less

