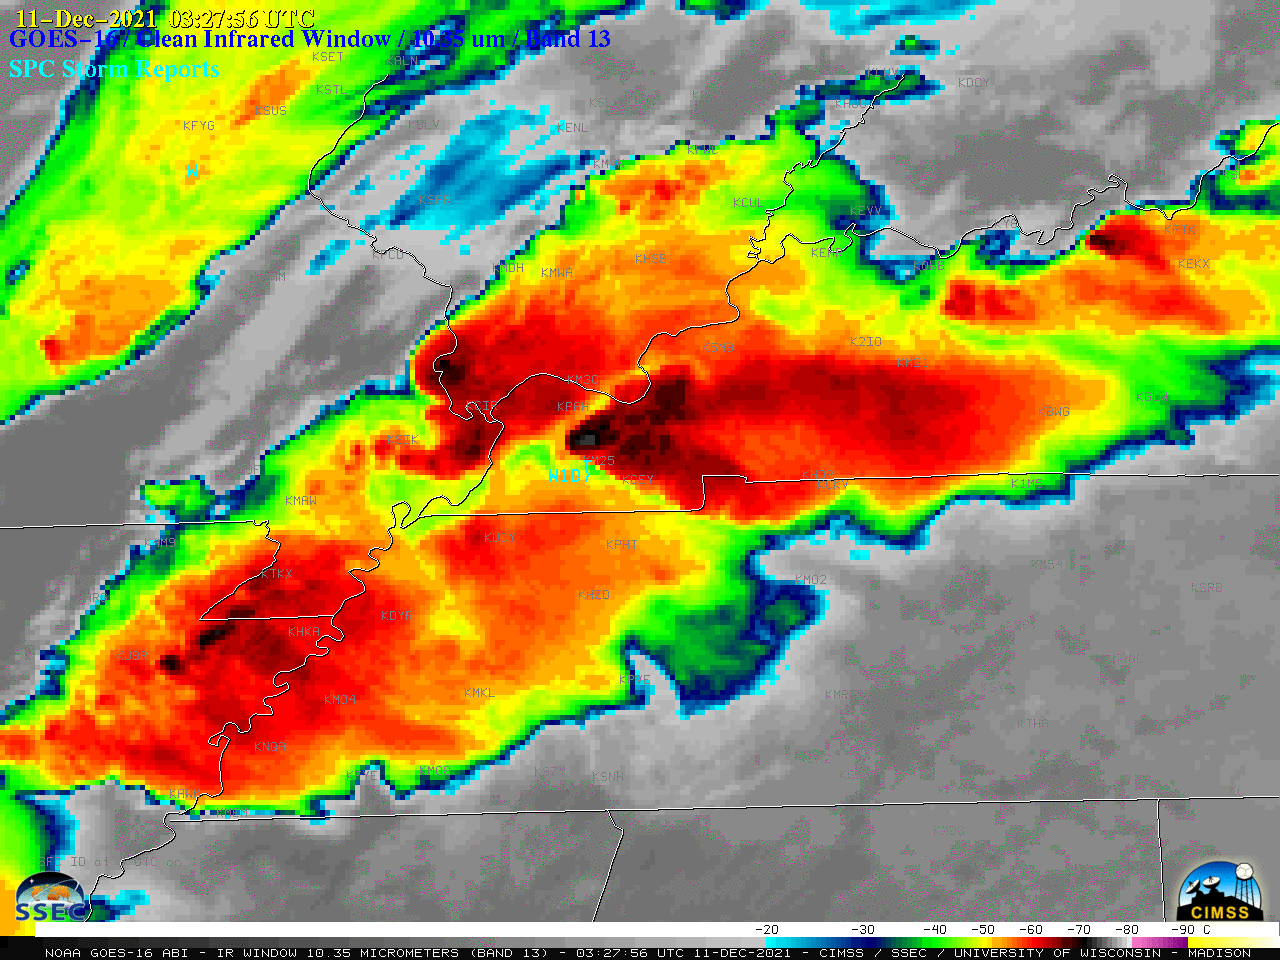

GOES-16 “Clean” Infrared Window (10.35 µm) images, with time-matched SPC Storm Reports plotted in cyan [click to play animated GIF | MP4]
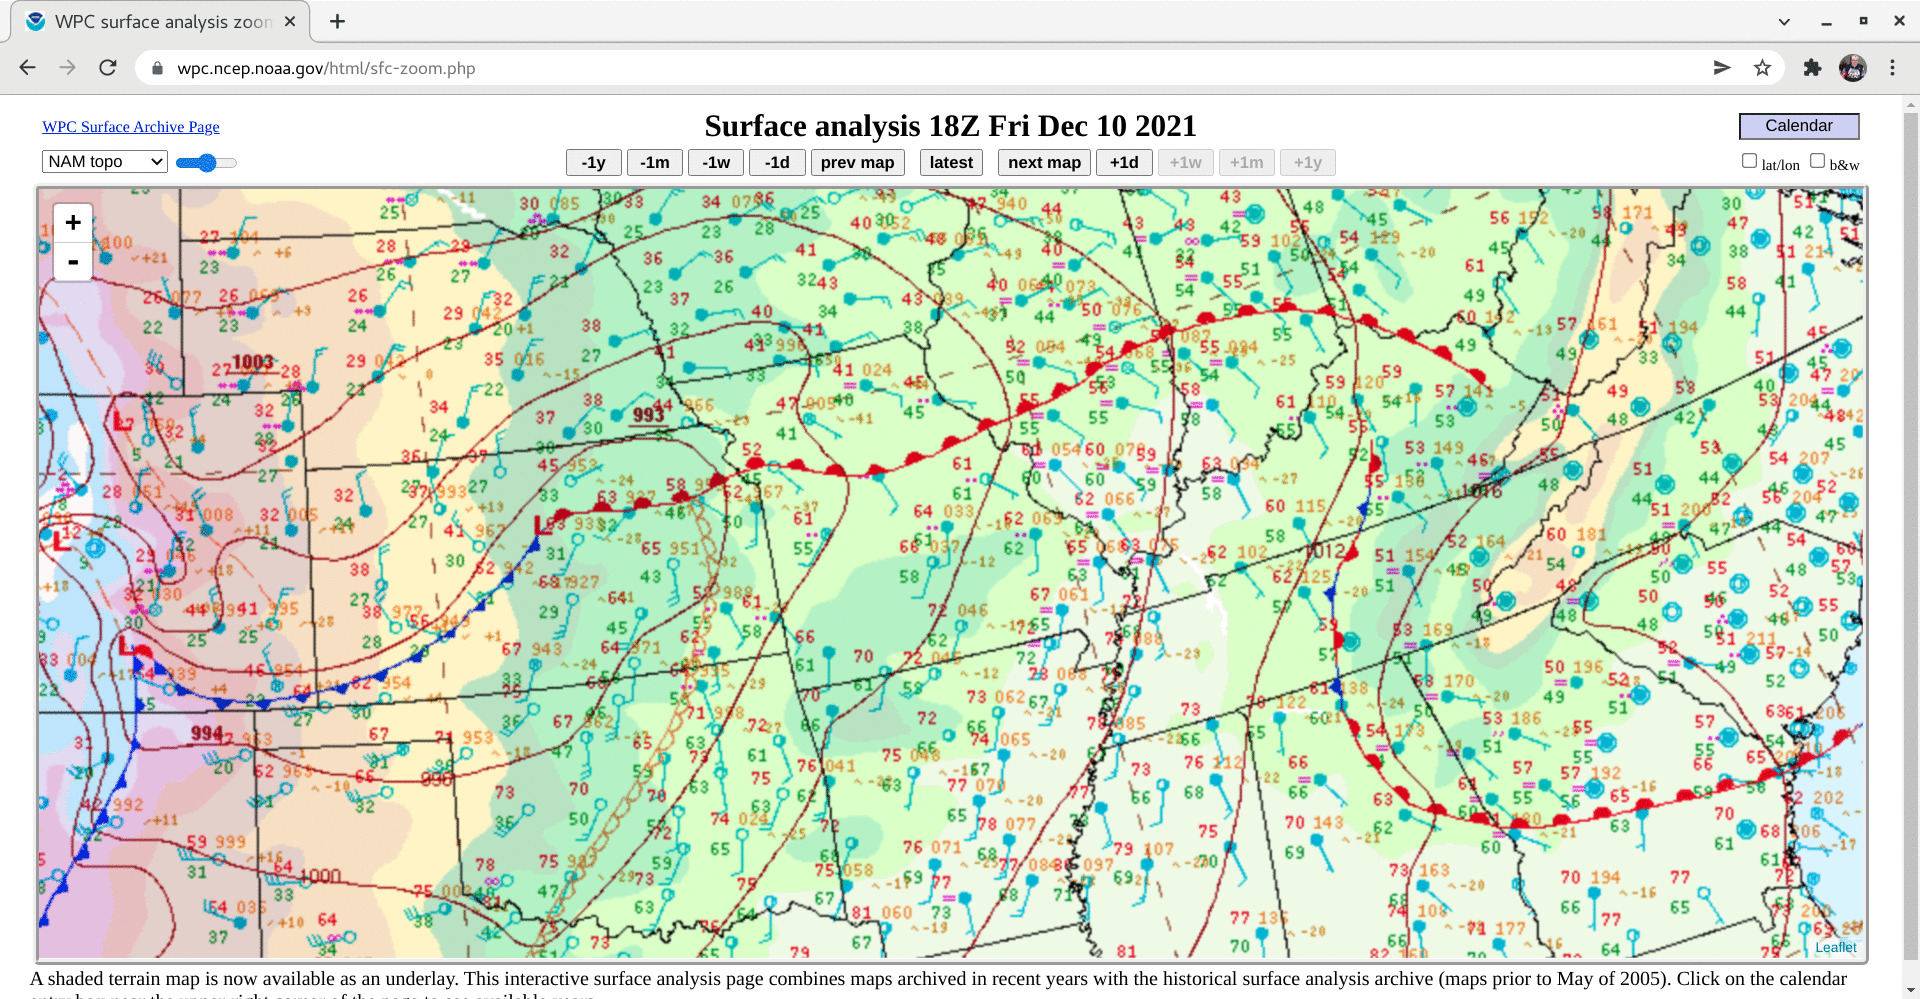
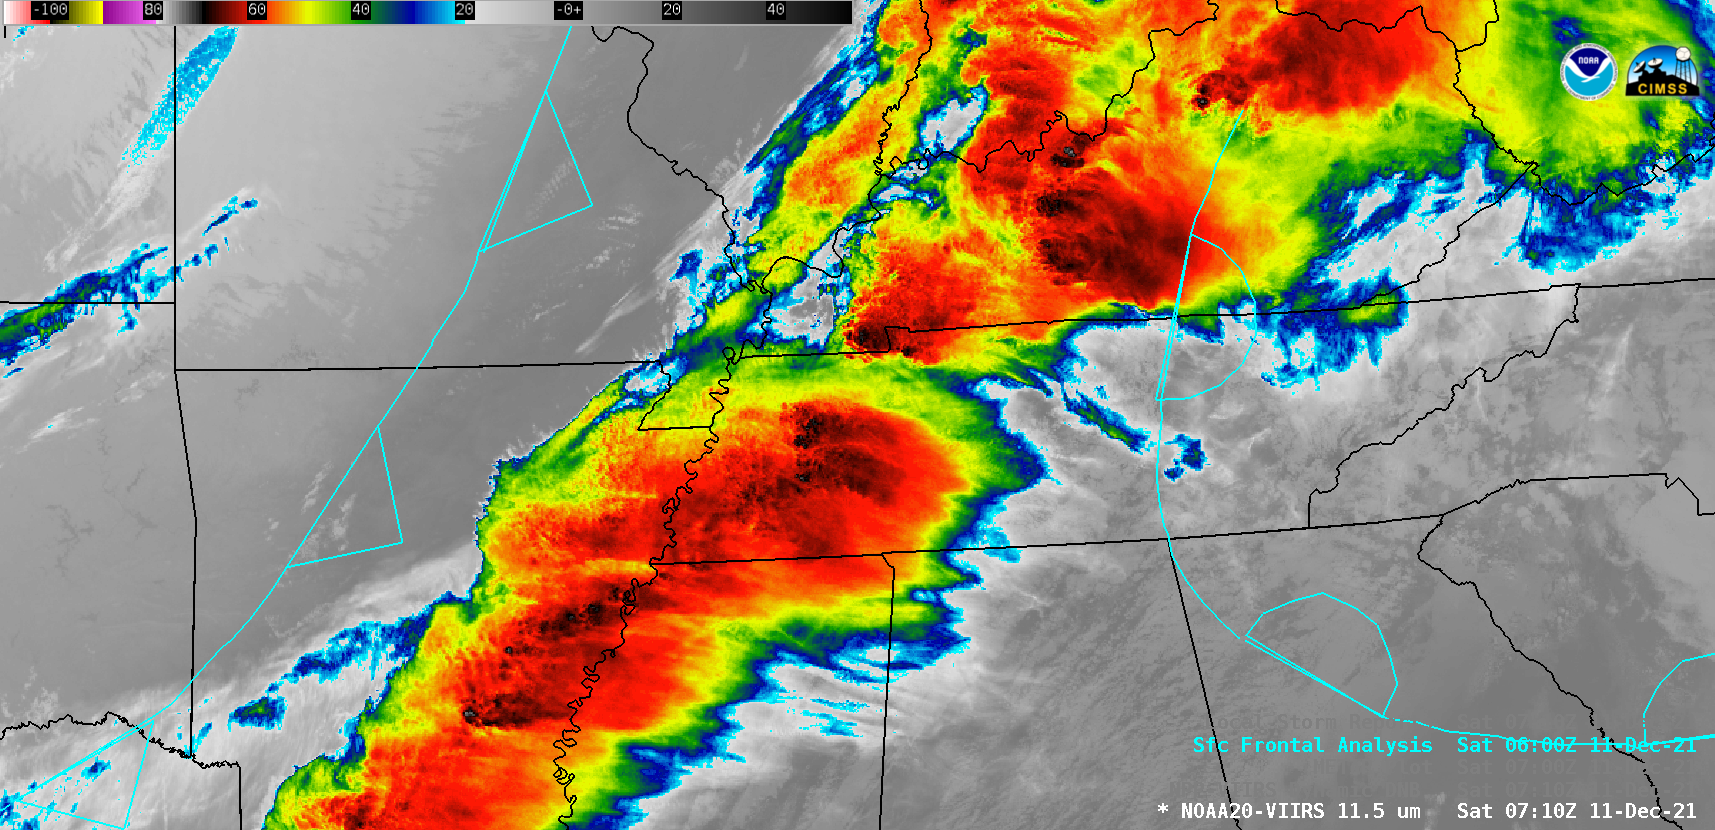
1-minute Mesoscale Domain Sector GOES-16 (GOES-East) “Clean” Infrared Window (10.35 µm) images (above) include time-matched plots of SPC Storm Reports during a large outbreak of severe weather across parts of the Midwest and Southeast US from late in the day on 10 December to a few hours after midnight on 11 December 2021. The severe thunderstorms developed in advance of a strong cold front that was moving toward the Lower Mississippi Valley (surface analyses | VIIRS Infrared image). There were dozens of tornado-related deaths in 5 states — Kentucky, Arkansas, Tennessee, Missouri and Illinois — with most of those (at least 70) being in Kentucky. This event has become the deadliest December tornado outbreak in modern history.
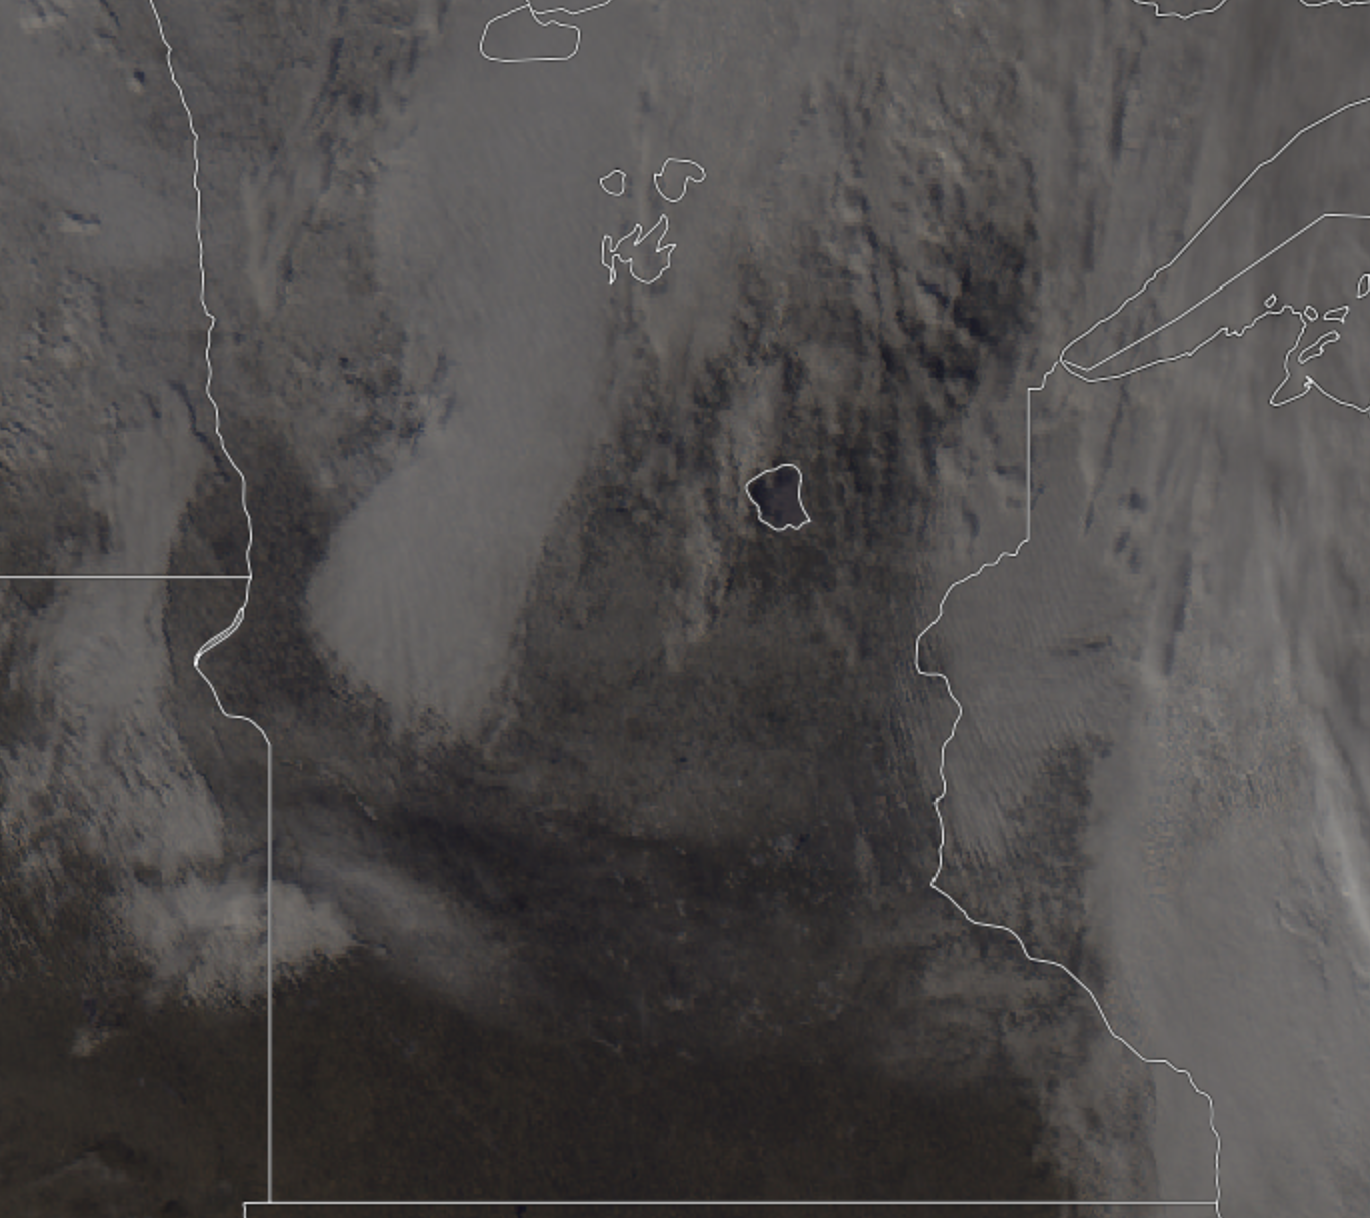
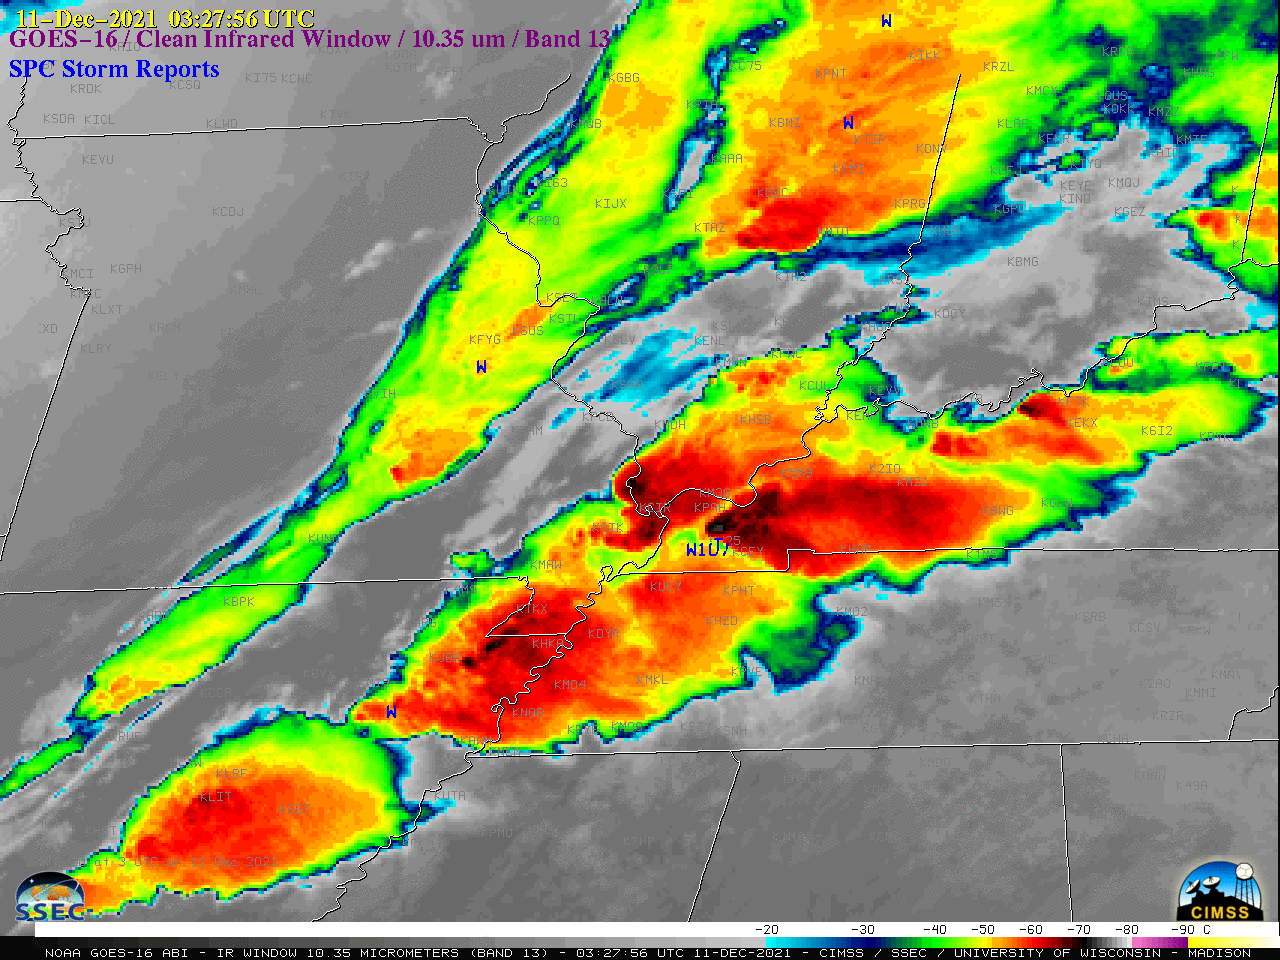
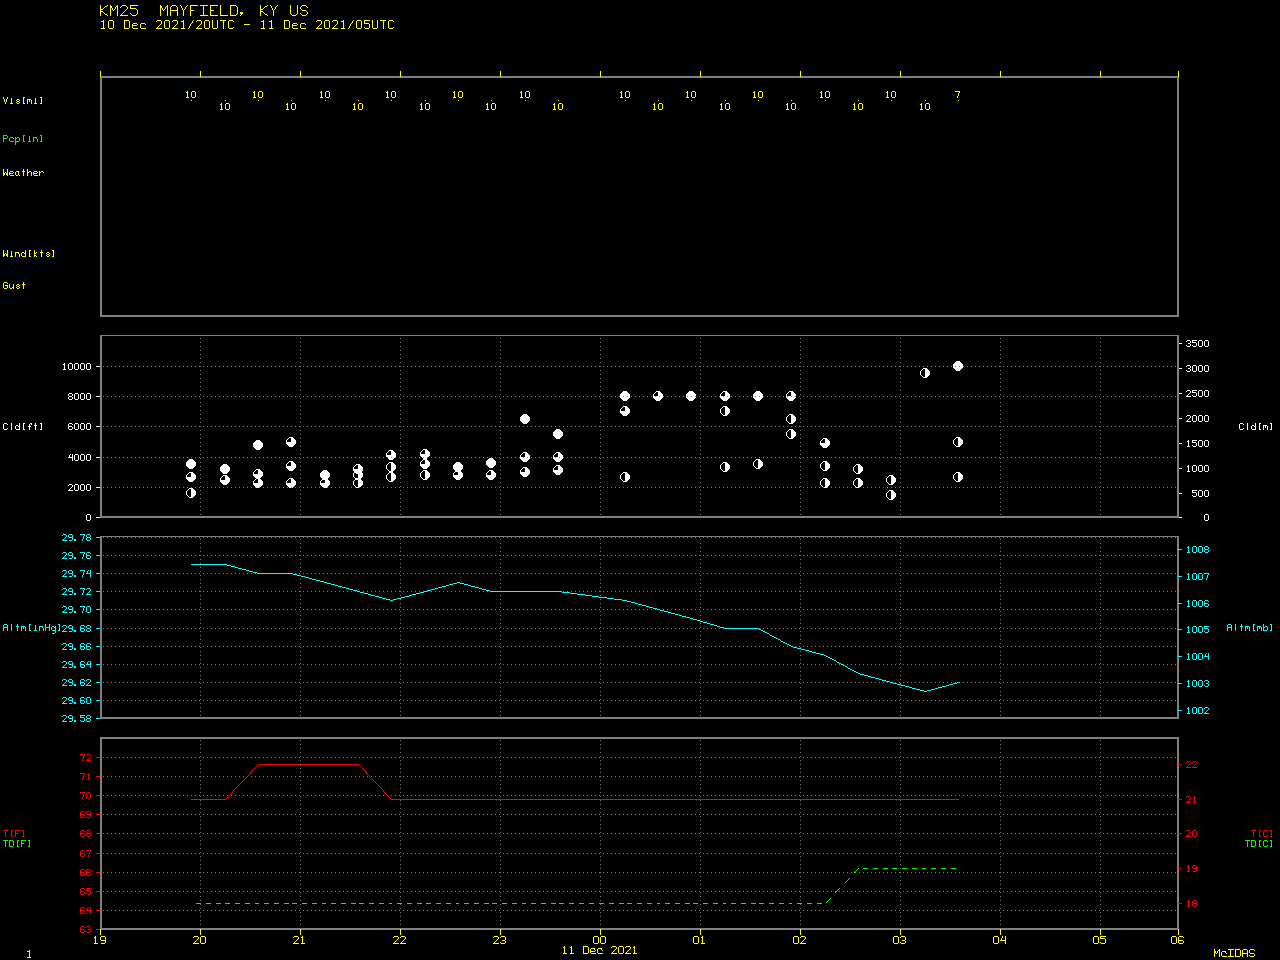
Shown below is a closer look at the long-lived “Quad-State Supercell” thunderstorm that likely produced a family of tornadoes that moved across northeast Arkansas, southeast Missouri, northwest Tennessee and western Kentucky. Note that a mesonet station 6 miles southwest of Mayfield, Kentucky reported a wind gust to 107 mph a few minutes before the tornado struck Mayfield — and after 0335 UTC, the Mayfield Airport (KM25) stopped providing data (presumably due to widespread tornado-related power outages). The pulsing of colder overshooting tops (highlighted by shades of white within black-enhanced cloud tops) was evident at the vertex of a prominent Enhanced-V signature — and this signature indicated that an Above-Anvil Cirrus Plume (reference | VISIT training) was likely present.

GOES-16 “Clean” Infrared Window (10.35 µm) images, with time-matched SPC Storm Reports plotted in cyan [click to play animated GIF | MP4]
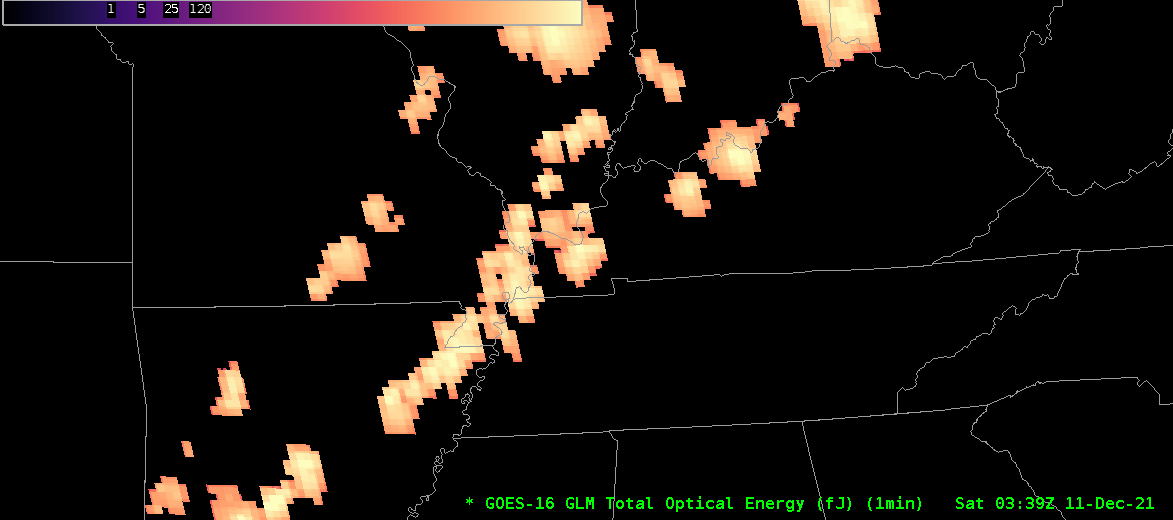
For the fatal tornado that struck Mayfield, Kentucky this pulsing of overshooting tops during the time from Tornado Warning issuance (0305 UTC) to its arrival in Mayfield (around 0325 UTC) was seen in 1-minute GOES-16 Infrared images viewed using RealEarth (below).

GOES-16 “Clean” Infrared Window (10.35 µm) images [click to play animated GIF | MP4]
In addition to the severe weather produced by this event, farther to the west strong westerly winds — ahead of a pair of advancing cold fronts — lofted multiple plumes of blowing dust, whose source regions were in New Mexico and Texas. GOES-16 True Color RGB images created using Geo2Grid (below) highlighted the tan-colored dust plumes (along with a couple of brighter white wildfire smoke plumes).

GOES-16 True Color RGB images [click to play animated GIF | MP4]
GOES-16 Dust RGB mages (below) showed the eastward/northeastward transport of airborne dust (brighter shades of magenta) past sunset. At some locations, peak wind gusts were in the 50-60 knot range and surface visibility was reduced to 3 miles or less.

GOES-16 Dust RGB images [click to play animated GIF | MP4]
Additional information about this severe weather event is available from: NWS Little Rock AR | NWS Memphis | NWS Paducah KY | NWS Louisville KY.
View only this post Read Less
