This website works best with a newer web browser such as Chrome, Firefox, Safari or Microsoft Edge. Internet Explorer is not supported by this website.

Lake effect clouds downwind of Lake Sakakawea

As cold arctic air moved across the still-unfrozen waters of Lake Sakakawea on 06 December 2021, a lake effect cloud plume was seen downwind (southeast) of the lake in GOES-16 (GOES-East) Night Fog BTD (10.3 – 3.9 µm) and Day Snow Fog RGB images (above).In a comparison of NOAA-20 VIIRS True Color RGB, False Color RGB and Infrared Window (11.45... Read More

GOES-16 Night Fog BTD (10.3 – 3.9 µm) and Day Snow Fog RGB images [click to play animated GIF | MP4]

As cold arctic air moved across the still-unfrozen waters of Lake Sakakawea on 06 December 2021, a lake effect cloud plume was seen downwind (southeast) of the lake in GOES-16 (GOES-East) Night Fog BTD (10.3 – 3.9 µm) and Day Snow Fog RGB images (above).

In a comparison of NOAA-20 VIIRS True Color RGB, False Color RGB and Infrared Window (11.45 µm) images at 1925 UTC (below), the lake effect cloud plume was diminishing as winds across/along the lake became lighter — and the unfrozen portions of Lake Sakakawea appeared dark in RGB imagery, with surface infrared brightness temperatures in the 1 to 2ºC range (darker shades of orange).

NOAA-20 VIIRS True Color RGB, False Color RGB and Infrared Window (11.45 µm) images [click to enlarge]

View only this post Read Less

NUCAPS soundings along the Arctic Coast of Alaska

A benefit of Polar Orbiters over northernmost Alaska is a wealth of NUCAPS soundings from NOAA-20! The animation above shows useful profiles near Utqiagvik AK (formerly Barrow) for the nine hours between 1132 and 2128 UTC on 5 December 2021. The vibrant green point is the point selected for the... Read More

NUCAPS Sounding availability over northern Alaska: 1132, 1313, 1453, 1633, 1810, 1948 and 2128 UTC on 5 December 2021; the brighter green point denotes the profiles chosen to be shown below (Click to enlarge)

A benefit of Polar Orbiters over northernmost Alaska is a wealth of NUCAPS soundings from NOAA-20! The animation above shows useful profiles near Utqiagvik AK (formerly Barrow) for the nine hours between 1132 and 2128 UTC on 5 December 2021. The vibrant green point is the point selected for the profiles shown below. Note that the profiles at 1633, 1810 and 1948 UTC were microwave-only; that is, the infrared retrieval did not converge (click here to see the distribution from 1633-1948 UTC; you’ll see yellow points in the region near Utqia?vik). The sounding availability suggests near-continuous (at 90-minute timesteps!) monitoring of the tropopshere during the day.

The animation below shows 4 profiles (for which the infrared solution converged in the retrieval); A consistent warming in the profiles is noted, and perhaps a slight drying as well. The tropopause is also shown to rise. These profiles are not reliant on numerical model data; they are an independent measure of the polar atmosphere. It’s important to view similar dot colors in this kind of animation. The animation at the bottom of the post includes in the animation the microwave-only profiles at 1635, 1914 and 1953 UTC. The IR+MW profiles below have far different character than MW-only profiles at bottom; however, the MW-only profiles also show a slow warming.

SHARPPy profiles from NOAA-20 NUCAPS at a point near Utqiagvik AK (formerly Barrow), for profiles where IR solution converged, 1134, 1315, 1455, 2133 UTC on 5 December 2021 (Click to enlarge)
SHARPPy profiles from NOAA-20 NUCAPS at a point near Utqiagvik AK (formerly Barrow), for all profiles : (IR solution converged: 1134, 1315,1455 and 2133; IR solution did not converge, and Microwave-only profile is shown: 1635, 1914 and 1953 UTC) (Click to enlarge)

These NUCAPS profiles were displayed using a method that is detailed here, developed by scientists at STC and SPoRT. NWS forecasters who are interested in this functionality can contact the blog author.


Note that the high temperatures in Utqiagvik (Barrow) on 3, 4 and 5 December were 0º, 19º, and 25º F, respectively, entirely consistent with the warm advection depicted in the NUCAPS profiles.

View only this post Read Less

Solar eclipse shadow in the Southern Hemisphere

GOES-16 (GOES-East) Near-Infrared “Snow/Ice” (1.61 µm) images (above) showed the shadow of a total solar ecliipse in the Southern Hemisphere on 04 December 2021. Even though the 1.61 µm imagery is at a lower (1 km) spatial resolution, it provided better contrast than higher-resolution (0.5 km) 0.64 µm “Red” Visible imagery, helping to highlight... Read More

GOES-16 Near-Infrared “Snow/Ice” (1.61 µm) images (credit: Tim SchmIt, NOAA/NESDIS) [click to enlarge | MP4]

GOES-16 (GOES-East) Near-Infrared “Snow/Ice” (1.61 µm) images (above) showed the shadow of a total solar ecliipse in the Southern Hemisphere on 04 December 2021. Even though the 1.61 µm imagery is at a lower (1 km) spatial resolution, it provided better contrast than higher-resolution (0.5 km) 0.64 µm “Red” Visible imagery, helping to highlight the shadow (below). Note that the shadow passed over the Antarctic Peninsula.

GOES-16 “Red” Visible (0.64 µm) and Near-Infrared “Snow/Ice” (1.61 µm) images (credit: Tim Schmit, NOAA/NESDIS) [click to enlarge]

GOES-16 CIMSS True Color RGB images created using Geo2Grid (below) provided another view of the eclipse shadow’s progression. 

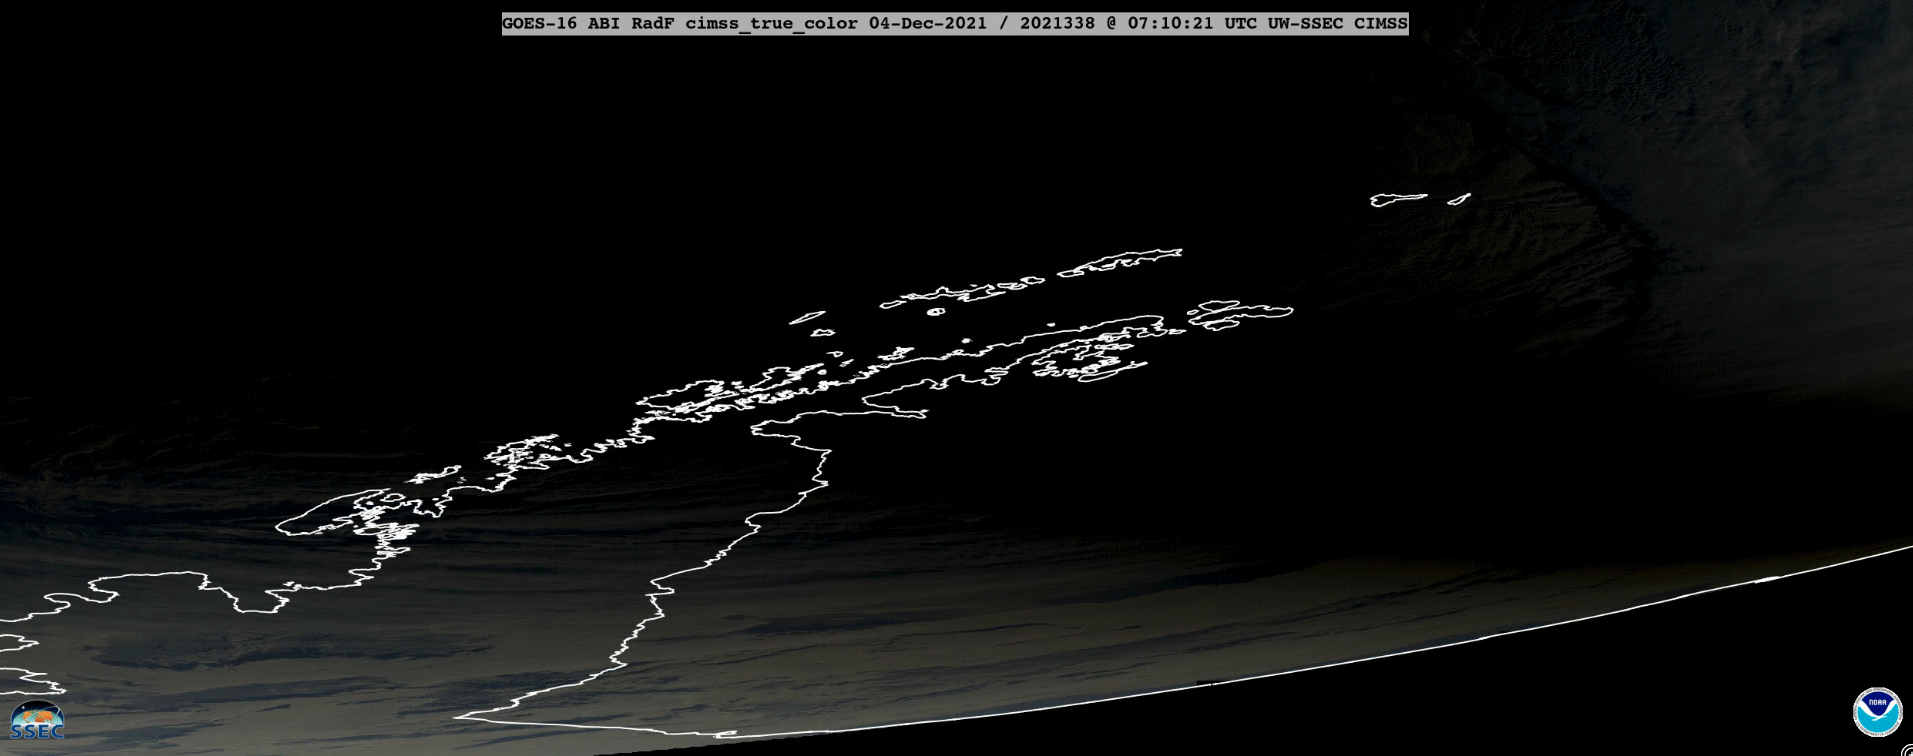
GOES-16 CIMSS True Color RGB images (credit: Tim Schmit, NOAA/NESDIS) [click to play animated GIF | MP4]

In a 3-panel comparison of GOES-16 “Red” Visible (0.64 µm), Near-Infrared “Snow/Ice” (1.61 µm) and Shortwave Infrared (3.9 µm) images (below), note that the lack of solar reflection within the eclipse shadow led to cooler 3.9 µm brightness temperatures (lighter shades of gray).    

GOES-16 “Red” Visible (0.64 µm, top), Near-Infrared “Snow/Ice” (1.61 µm, middle) and Shortwave Infrared (3.9 µm, bottom) images (credit: Tim Schmit, NOAA/NESDIS/ASPB) [click to play animated GIF | MP4]

The shadow was also apparent in GOES-17 (GOES-West) images (below).

GOES-17 Near-Infrared “Snow/Ice” (1.61 µm) images [click to play animated GIF | MP4]

A composite of POES AVHRR Visible (0.63 µm) swaths around 0700 UTC (below) showed the shadow extending southward across South Georgia and the South Sandwich Islands and reaching the coast of Antarctica. 

Composite of POES AHVRR Visible (0.63 µm) swaths [click to enlarge]

In addition, portions of the solar eclipse shadow could be seen in True Color RGB images from Suomi-NPP and NOAA-20, as viewed using RealEarth (below).

VIIRS True Color RGB images from Suomi-NPP and NOAA-20 [clck to enlarge]

This blog post discusses AMRC/AWS staff viewing the partial eclipse from Antarctica’s McMurdo Station.

View only this post Read Less

Eruption of Semeru in East Java

JMA Hmawari-8 True Color RGB images created using Geo2Grid (above) showed the southwestward-moving volcanic cloud associated with an eruption of Semeru –located at the center of the images — in East Java around 0750 UTC on 04 December 2021. Due to the high water and ice loading within upper portions of the... Read More

Himawari-8 True Color RGB images [click to play animation | MP4]

JMA Hmawari-8 True Color RGB images created using Geo2Grid (above) showed the southwestward-moving volcanic cloud associated with an eruption of Semeru –located at the center of the images — in East Java around 0750 UTC on 04 December 2021. Due to the high water and ice loading within upper portions of the volcanic cloud, no distinct lower-to-middle-altitude volcanic ash signature was seen. The eruption was responsible for over 40 fatalities and the destruction of over 5000 homes; 

View only this post Read Less