This website works best with a newer web browser such as Chrome, Firefox, Safari or Microsoft
Edge. Internet Explorer is not supported by this website.
US Space Force EWS-G1 (formerly GOES-13) Infrared Window (10.7 µm) images (above) showed Cyclone Batsirai in the South Indian Ocean — just north of the island nations of Mauritius and Réunion — during the time period it was classified as a Category 4 intensity storm (00 UTC on 02 February... Read More
EWS-G1 Infrared Window (10.7 µm) images [click to play animated GIF | MP4]
US Space Force EWS-G1 (formerly GOES-13) Infrared Window (10.7 µm) images (above) showed Cyclone Batsirai in the South Indian Ocean — just north of the island nations of Mauritius and Réunion — during the time period it was classified as a Category 4 intensity storm (00 UTC on 02 February to 15 UTC on 03 February 2022). Note that the small-diameter eye became notably larger by the end of the animation.
A DMSP-17 SSMIS Microwave (85 GHz) image from the CIMSS Tropical Cyclones site (below) displayed evidence that Batsirai had recently completed an eyewall replacement cycle (ERC), with the faint signature of the original small-diameter eye surrounded by the new large-diameter eye. This ERC process — seen in a 48-hour MIMIC-TC animation — initiated Batsirai’s gradual decline in intensity.
DMSP-17 SSMIS Microwave (85 GHz) image [click to enlarge]
EWS-G1 Visible (0.63 µm) images (below) showed that the small eye was initially cloud-filled, but eventually cleared during the day on 02 February — to reveal the possible existence of eye mesovortices (although such features are difficult to diagnose using 30-minute images) .
EWS-G1 Visible (0.63 µm) images [click to play animated GIF | MP4]
GOES-16 True-Color imagery from CSPP Geosphere (direct link to animation), above, shows high clouds over Lake Erie moving eastward as lake ice moves to the north. It is an unusual day that allows a (relatively) unobstructed view of the lake surface. Clouds are often present. Note that southern Lake Huron also seems ice-covered; western... Read More
GOES-16 True Color Imagery, 1601-1841 UTC on 1 February 2022 (Click to enlarge)
GOES-16 True-Color imagery from CSPP Geosphere (direct link to animation), above, shows high clouds over Lake Erie moving eastward as lake ice moves to the north. It is an unusual day that allows a (relatively) unobstructed view of the lake surface. Clouds are often present. Note that southern Lake Huron also seems ice-covered; western Lake Ontario is clear of ice.
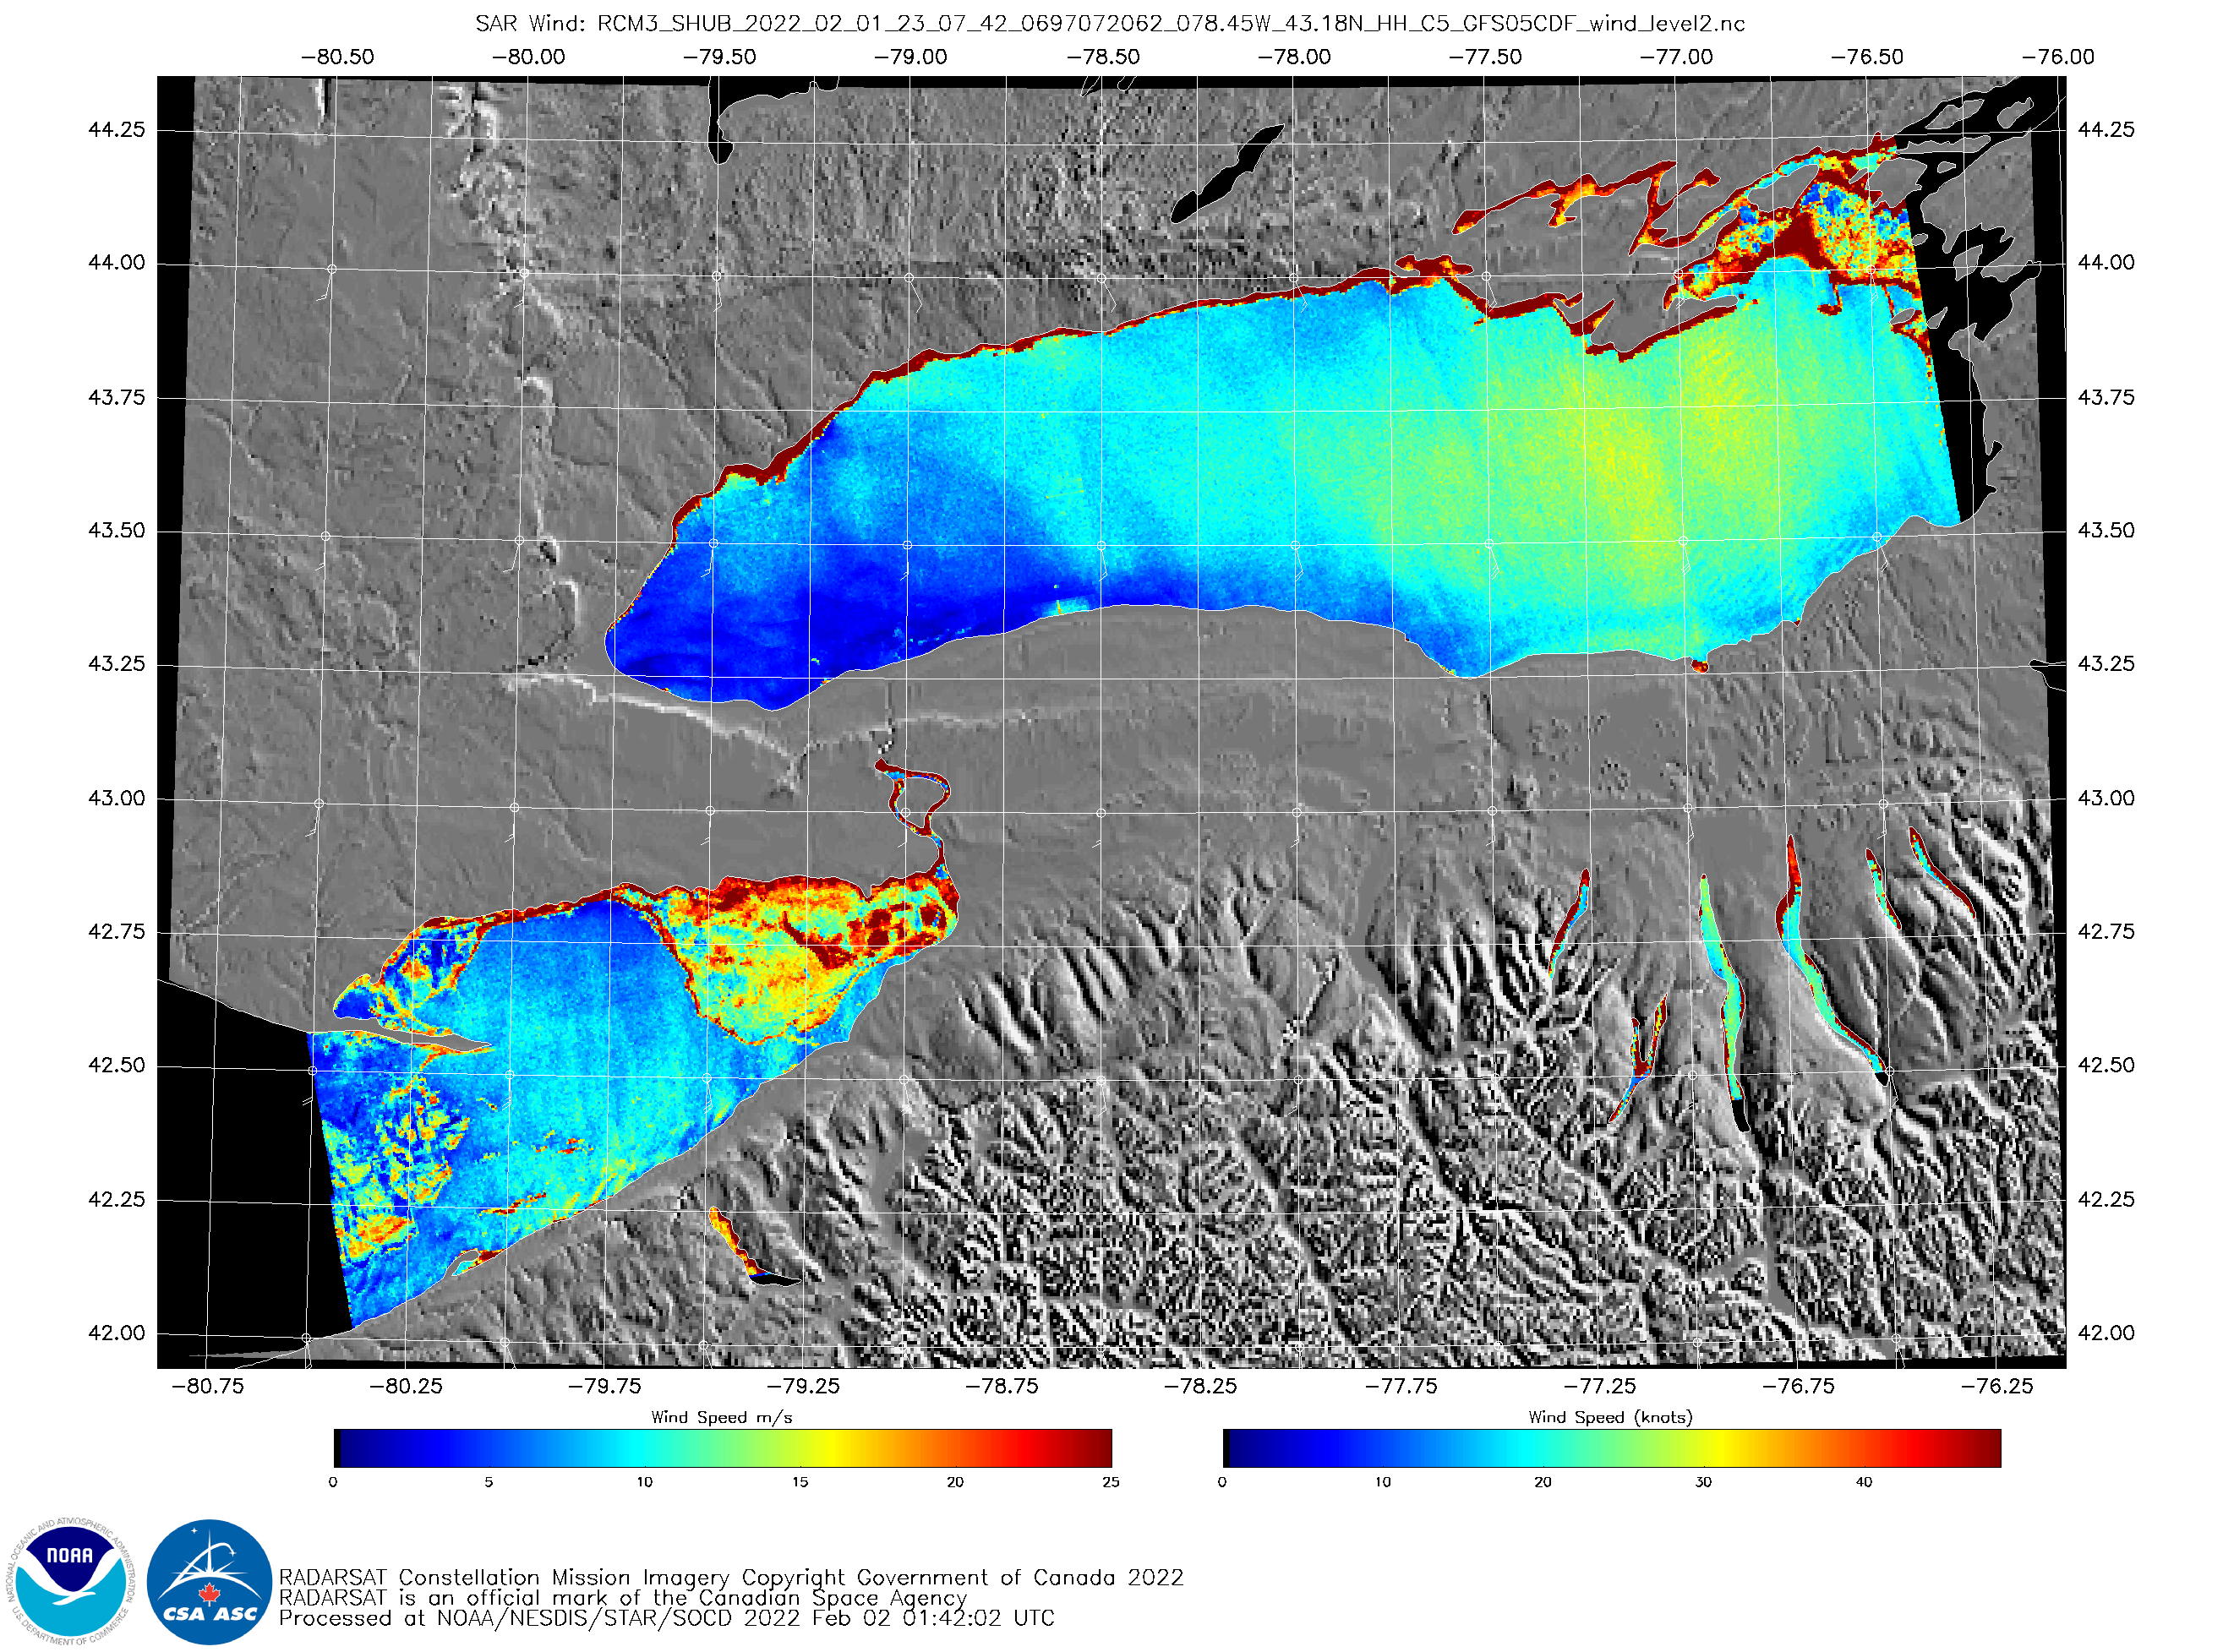
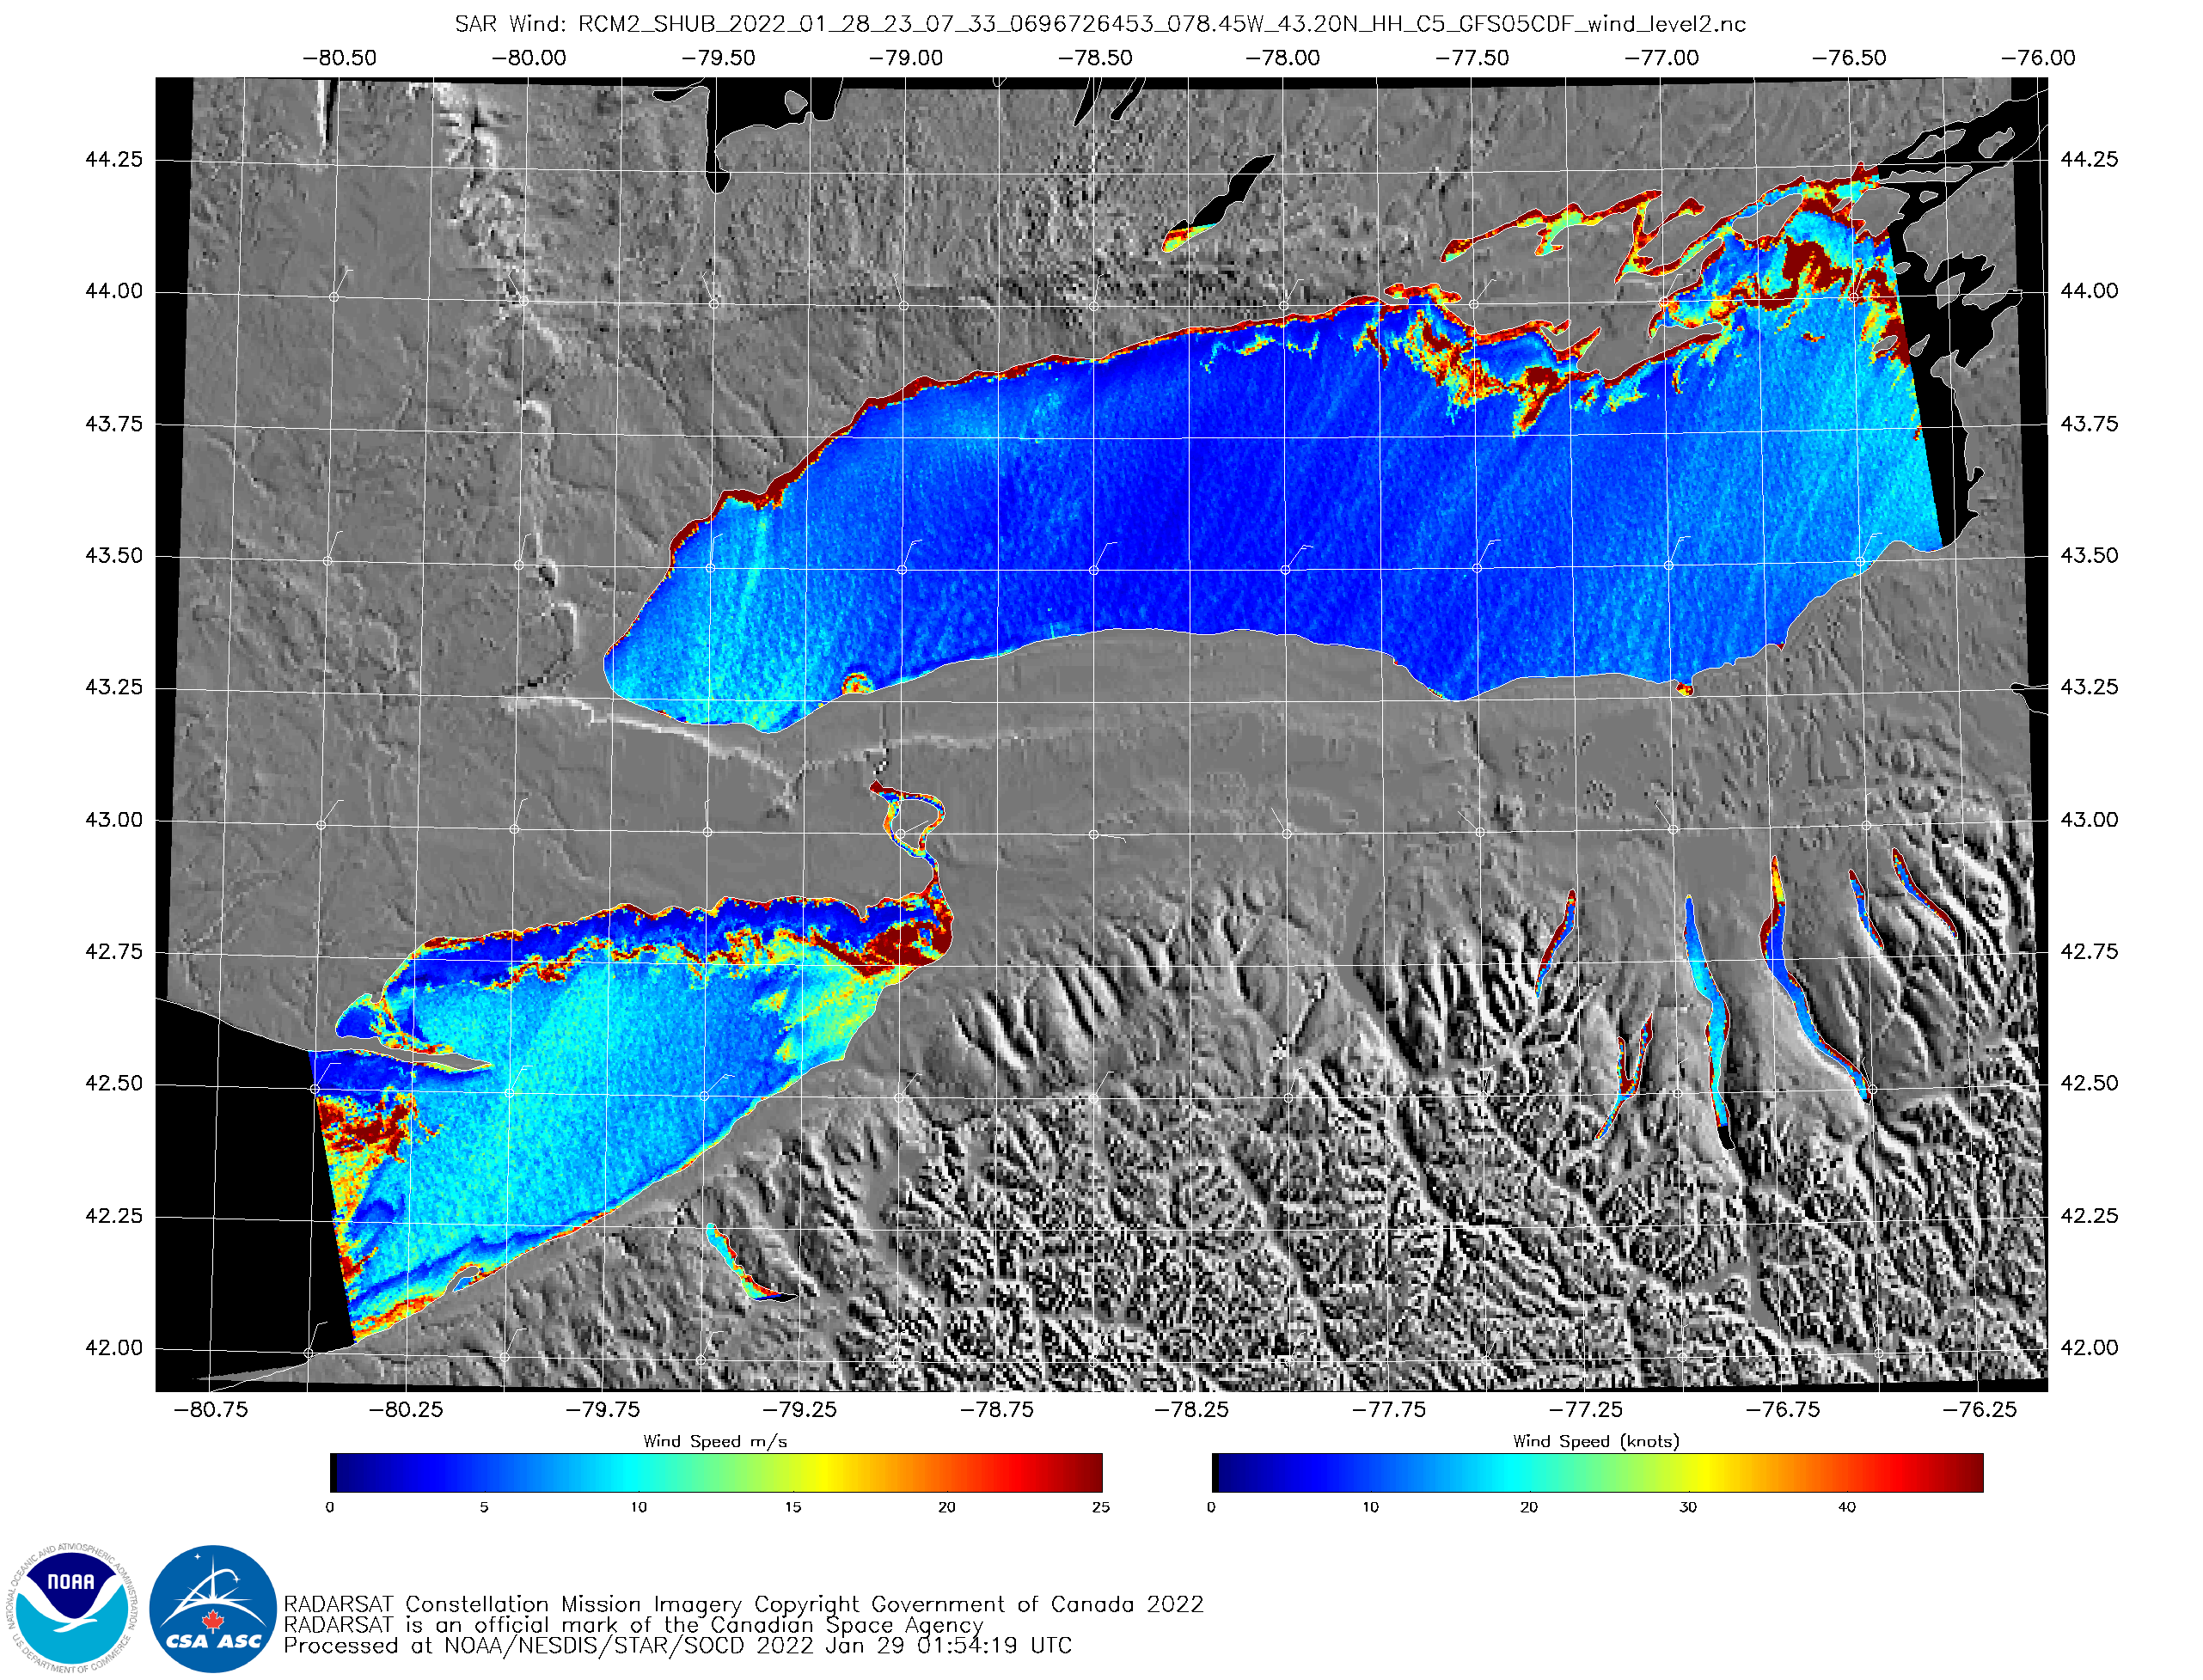
The image below shows ice over eastern Lake Erie and Lake Ontario from Synthetic Aperture Radar (SAR) data from the RADARSat Constellation Mission 3 (RCM3) satellite on 1 February (after sunset) from this website. Ice is indicated over eastern Lake Erie, and over central Lake Erie south of Long Point, Ontario. RCM orbits produce overlaps every 4 days, so a similar view occurred on 28 January; this is useful to see how things change. With practice, your eye will differentiate ice structures from wind features. This is especially true if you view the imagery daily.
RCM3 SAR imagery over eastern Lake Erie and Lake Ontario, 2307 UTC on 1 February 2022 (Click to enlarge)
Synthetic Aperture Radar (SAR) data from RADARSAT Constellation Mission (RCM) satellites do give very high-resolution views of wind and ice over water. Wind roughens the open water surface, and the capillary waves that form on the water surface produce Bragg Scattering to which the SAR instruments are sensitive. Past blog posts that relate SAR observations to winds are here. (In the imagery above, plotted winds — in white — are from the GFS analysis) When ice starts to cover a lake, the roughness of the lake is damped, and it becomes more difficult for the wind to perturb the lake surface. In addition, a smooth ice surface will reflect microwave signals, not scatter them. However, frozen lake surfaces are not always smooth, and strong microwave signals can be reflected back to the SAR satellites, as suggested in the imagery above.
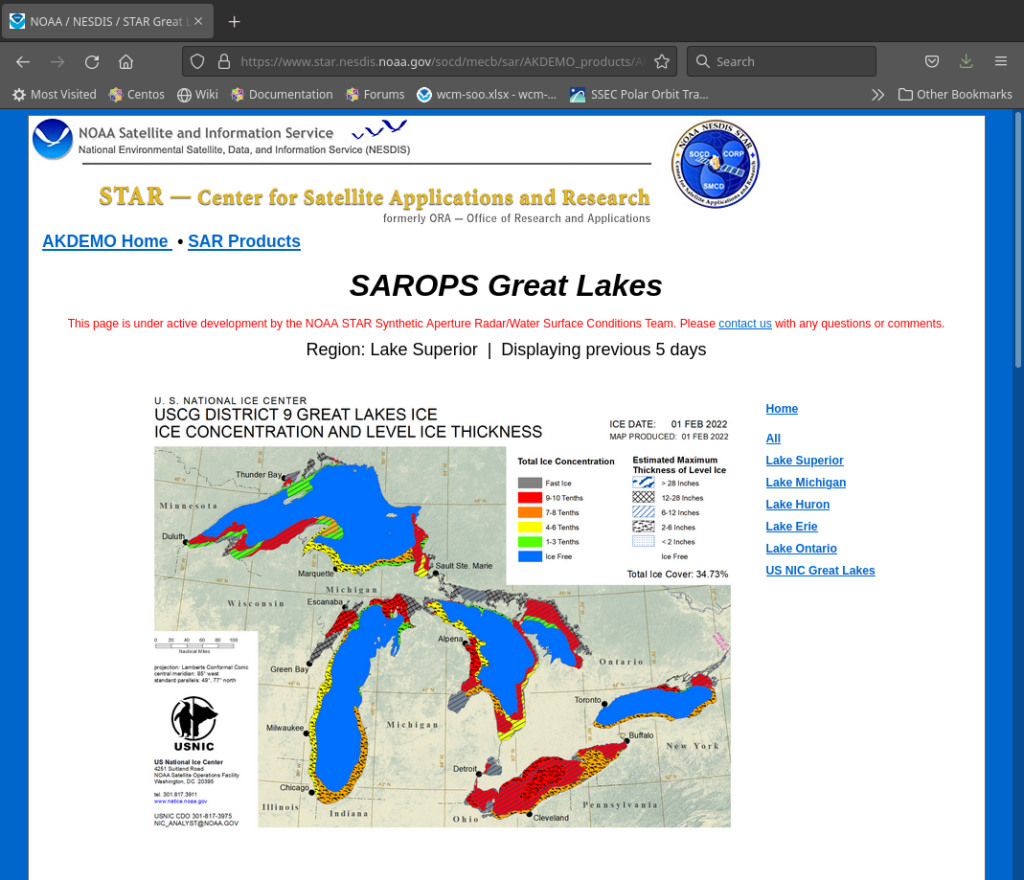
At the request of National Weather Service forecast offices, NOAA STAR’s SAR Team is creating a website that includes daily SAR imagery (when available) over the individual Great Lakes. The website is shown at bottom. Of particular interest for ice detection are the black and white NRCS (Normalized Radar Cross Section) images. The NRCS image that corresponds to the color image above is shown below. It has remarkable detail.
RCM3 NRCS imagery over eastern Lake Erie and Lake Ontario, 2307 UTC on 1 February 2022 (Click to enlarge)
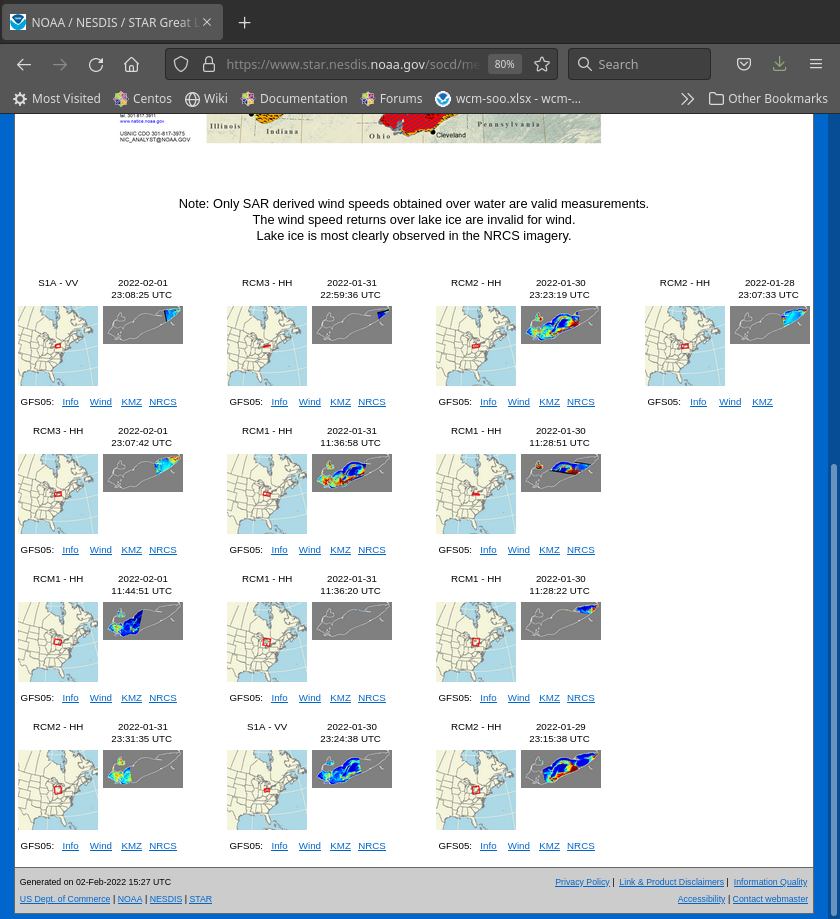
The Operational SAR website for the Great Lakes is shown below. Of special note are the individual Lake views that are available by clicking on the desired Great Lake. Click, and then scroll down and view all the recent SAR imagery available over that Lake, as shown below for Lake Erie.
MIMIC Total Precipitable Water esimates over the Indian Ocean for the 24 hours ending at 2000 UTC on 1 February 2022, above, show the strong cyclonic circulation associated with Cyclone Basirai. Its forecast motion is westward towards Madagascar, as shown in the toggle below that also includes sea-surface temperatures and... Read More
MIMIC Total Precipitable Water estimates, 2100 UTC 31 January – 2000 UTC 1 February 2022 (click to enlarge)
MIMIC Total Precipitable Water esimates over the Indian Ocean for the 24 hours ending at 2000 UTC on 1 February 2022, above, show the strong cyclonic circulation associated with Cyclone Basirai. Its forecast motion is westward towards Madagascar, as shown in the toggle below that also includes sea-surface temperatures and Window Channel (showing a well-structured storm; all images are from the SSEC/CIMSS Tropical Website). A wind shear analysis (also from the SSEC Tropical Website and valid at 1800 UTC on 1 February) for the Indian Ocean shows low shear values over the storm, but relatively high shear between the storm and the island of Madagascar.
Forecast Path for Batsirai, sea-surface temperature analysis, and window channel satellite imagery, times as indicated (Click to enlarge)
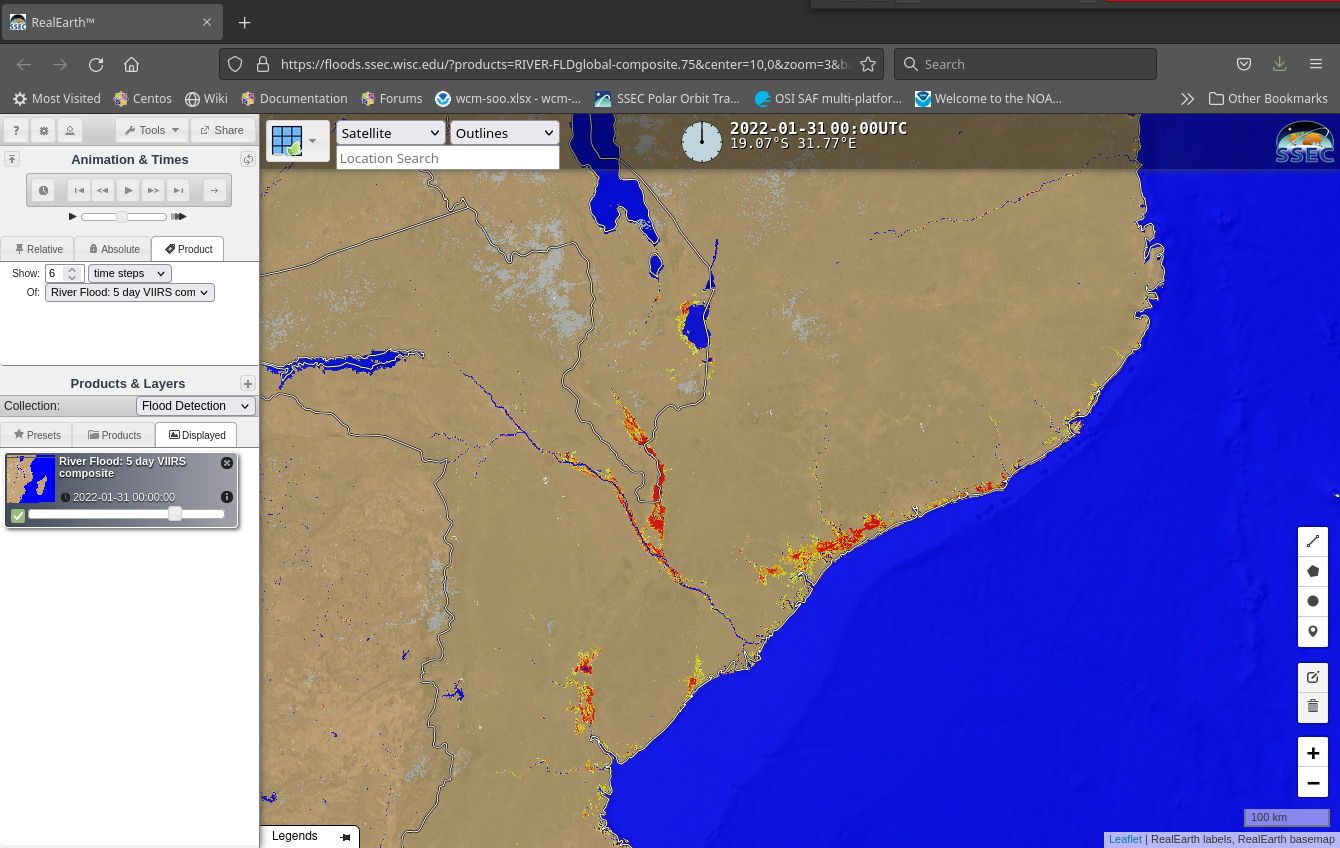
Batsirai’s path moves it close to Mozambique/Malawi, two countries that are still being flooded as a result of rains from Tropical Storm Ana a week ago. A VIIRS flood analysis (from this website), below, diagnoses active flooding occurring along the Shire River (south of Lake Malawi) and along the Zambezi River on 31 January 2022.
River Flood Analysis from VIIRS imagery, 5-day composite endings 31 January 2022 (click to enlarge)
GOES-16 (GOES-East) Near-Infrared “Snow/Ice” (1.61 µm), Near-Infrared “Cloud Particle Size” (2.24 µm) and Shortwave Infrared (3.9 µm) images (above) displayed the thermal signature of a fire at the Weaver Fertilizer Plant in Winston-Salem, North Carolina (airport identifier KINT) that began around 2346 UTC or 6:46 pm EST (about an hour after sunset) on... Read More
GOES-16 Near-Infrared (1.61 µm, left and 2.24 µm, center) and Shortwave Infrared (3.9 µm, right) images [click to play animated GIF | MP4]
GOES-16 (GOES-East) Near-Infrared “Snow/Ice” (1.61 µm), Near-Infrared “Cloud Particle Size” (2.24 µm) and Shortwave Infrared (3.9 µm) images (above) displayed the thermal signature of a fire at the Weaver Fertilizer Plant in Winston-Salem, North Carolina (airport identifier KINT) that began around 2346 UTC or 6:46 pm EST (about an hour after sunset) on 31 January 2022. The highest 3.9 µm infrared brightness temperature was 300.64 K at 0011UTC, 25 minutes after the fire was first detected by GOES-16.
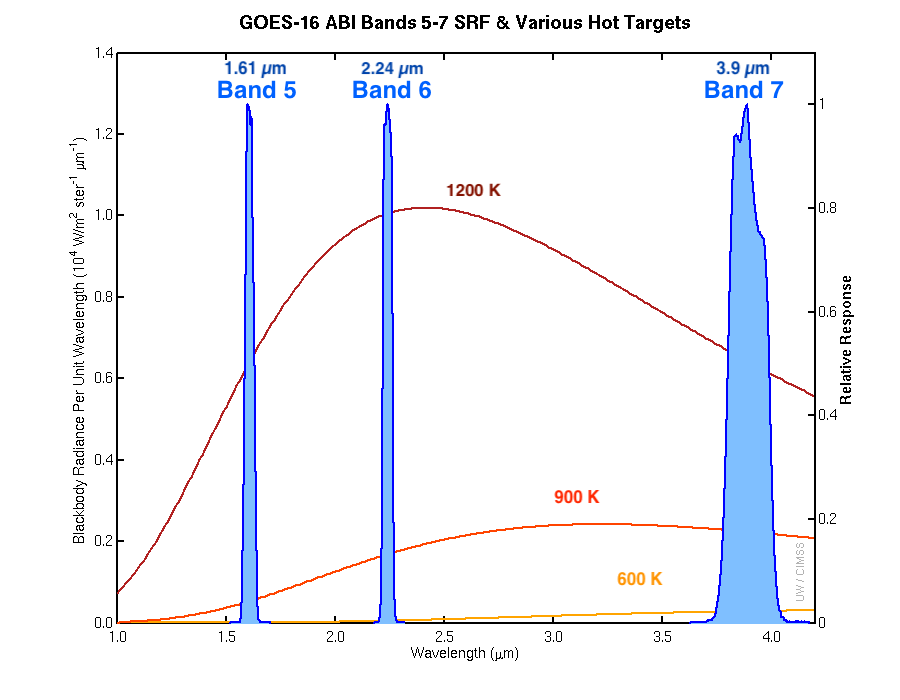
Note that a faint thermal signature of the fire (pixels exhibiting dim shades of white) was also seen in the Near-Infrared (1.61 µm Band 5 and 2.24 µm Band 6) images — this is because those two ABI spectral bands are located close to the peak emitted radiance of very hot features such as large fires (below).
Spectral Response Function (SRF) plots for GOES-16 ABI Bands 5, 6 and 7 (credit: Mat Gunshor, CIMSS) [click to enlarge]


