This website works best with a newer web browser such as Chrome, Firefox, Safari or Microsoft
Edge. Internet Explorer is not supported by this website.
The Ahyi Seamount is an underwater volcano in the northern Marianas that rises to within 137 m of the Pacific Ocean surface (Click here for more information). VIIRS True-color imagery within the past week shows discoloration in the ocean over the seamount location, suggestive of some sort of eruptive activity. (See this News Article). The image above... Read More
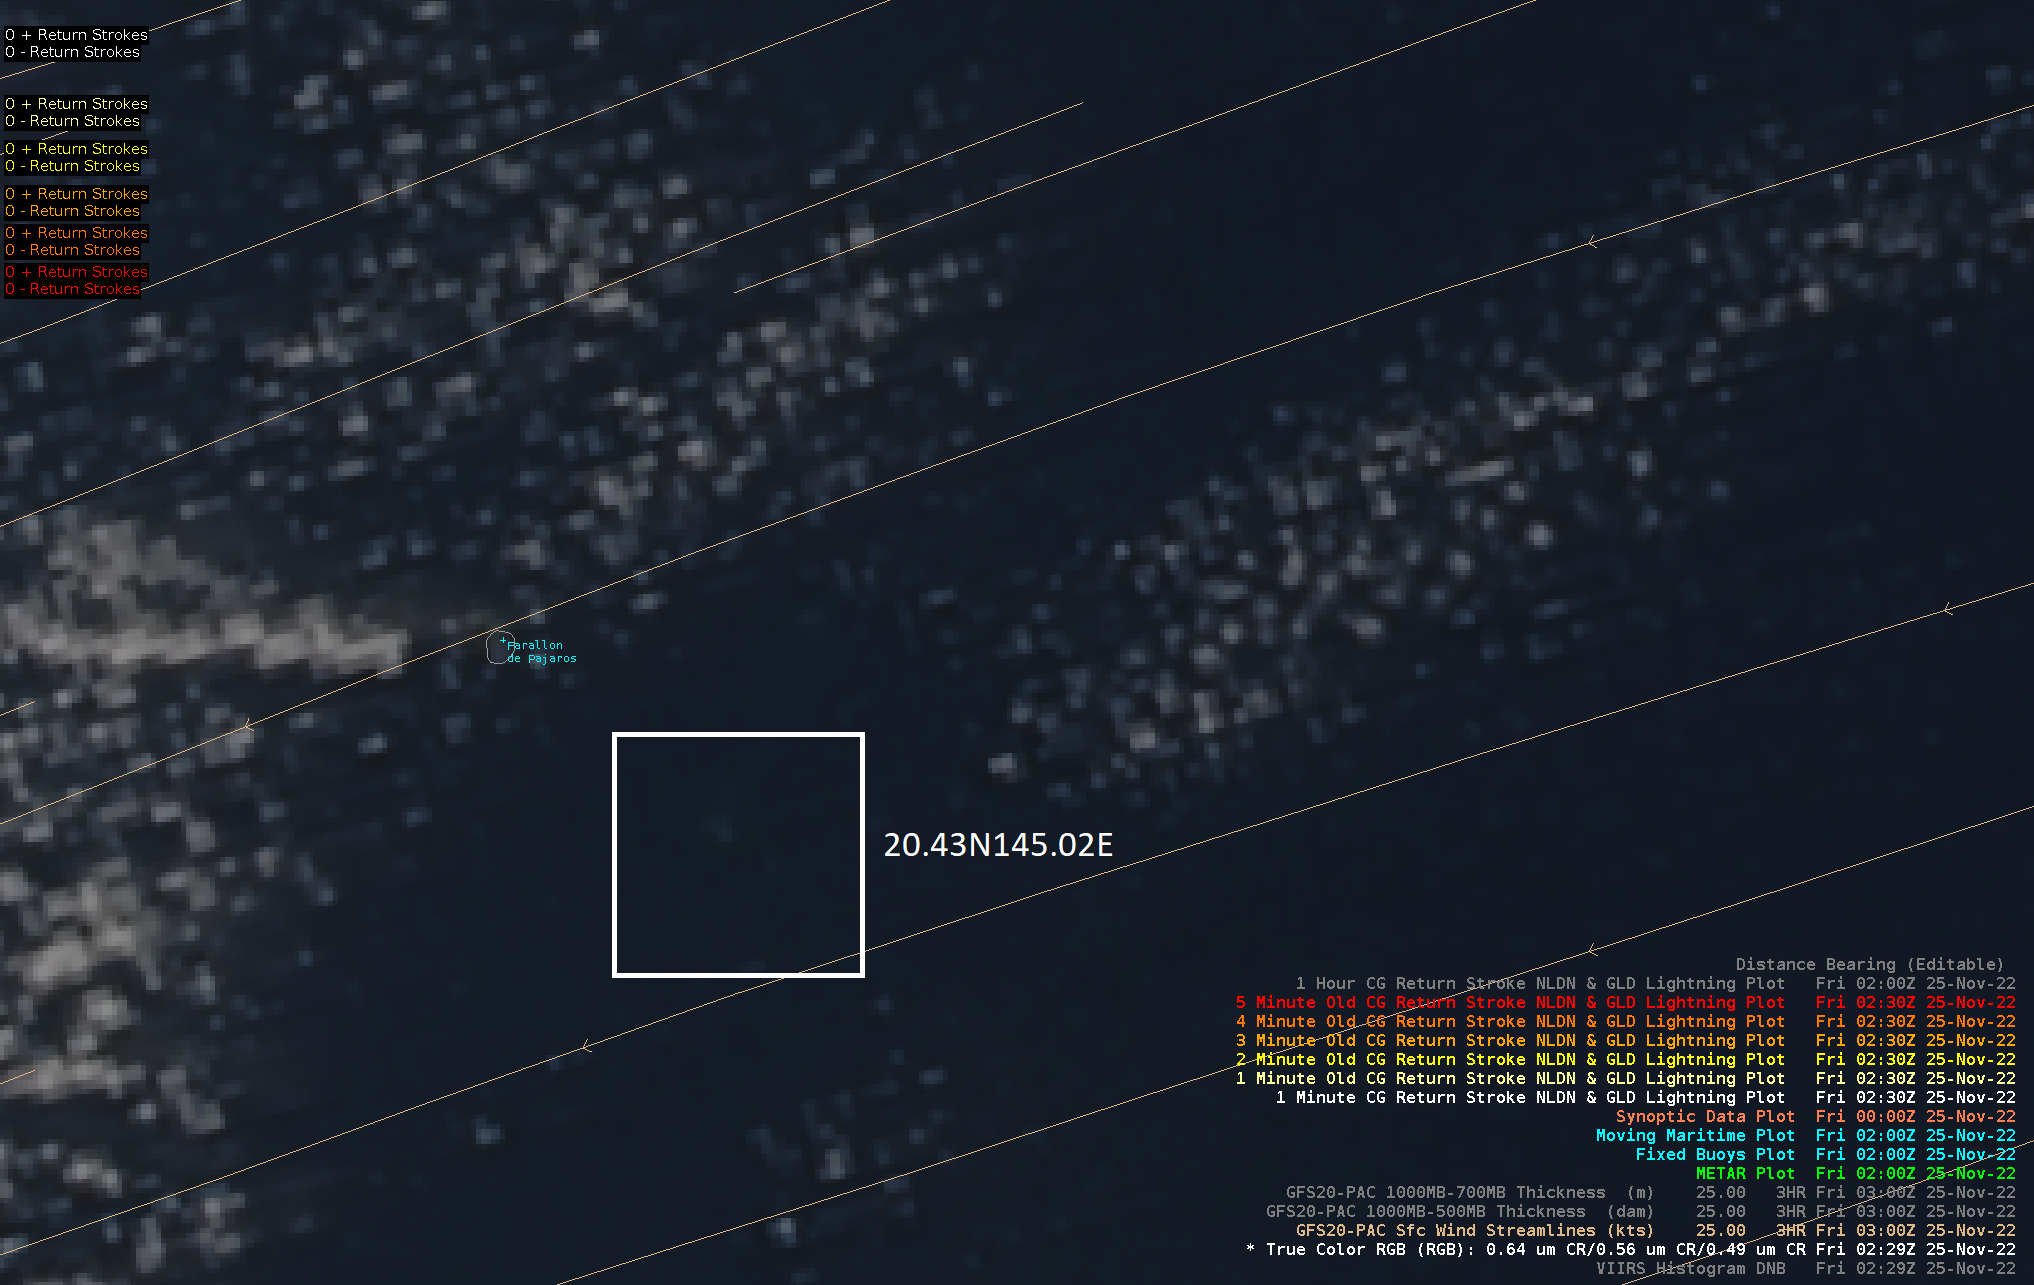
Suomi NPP VIIRS True-Color Imagery 0229 UTC on 25 November 2022 (Click to enlarge)
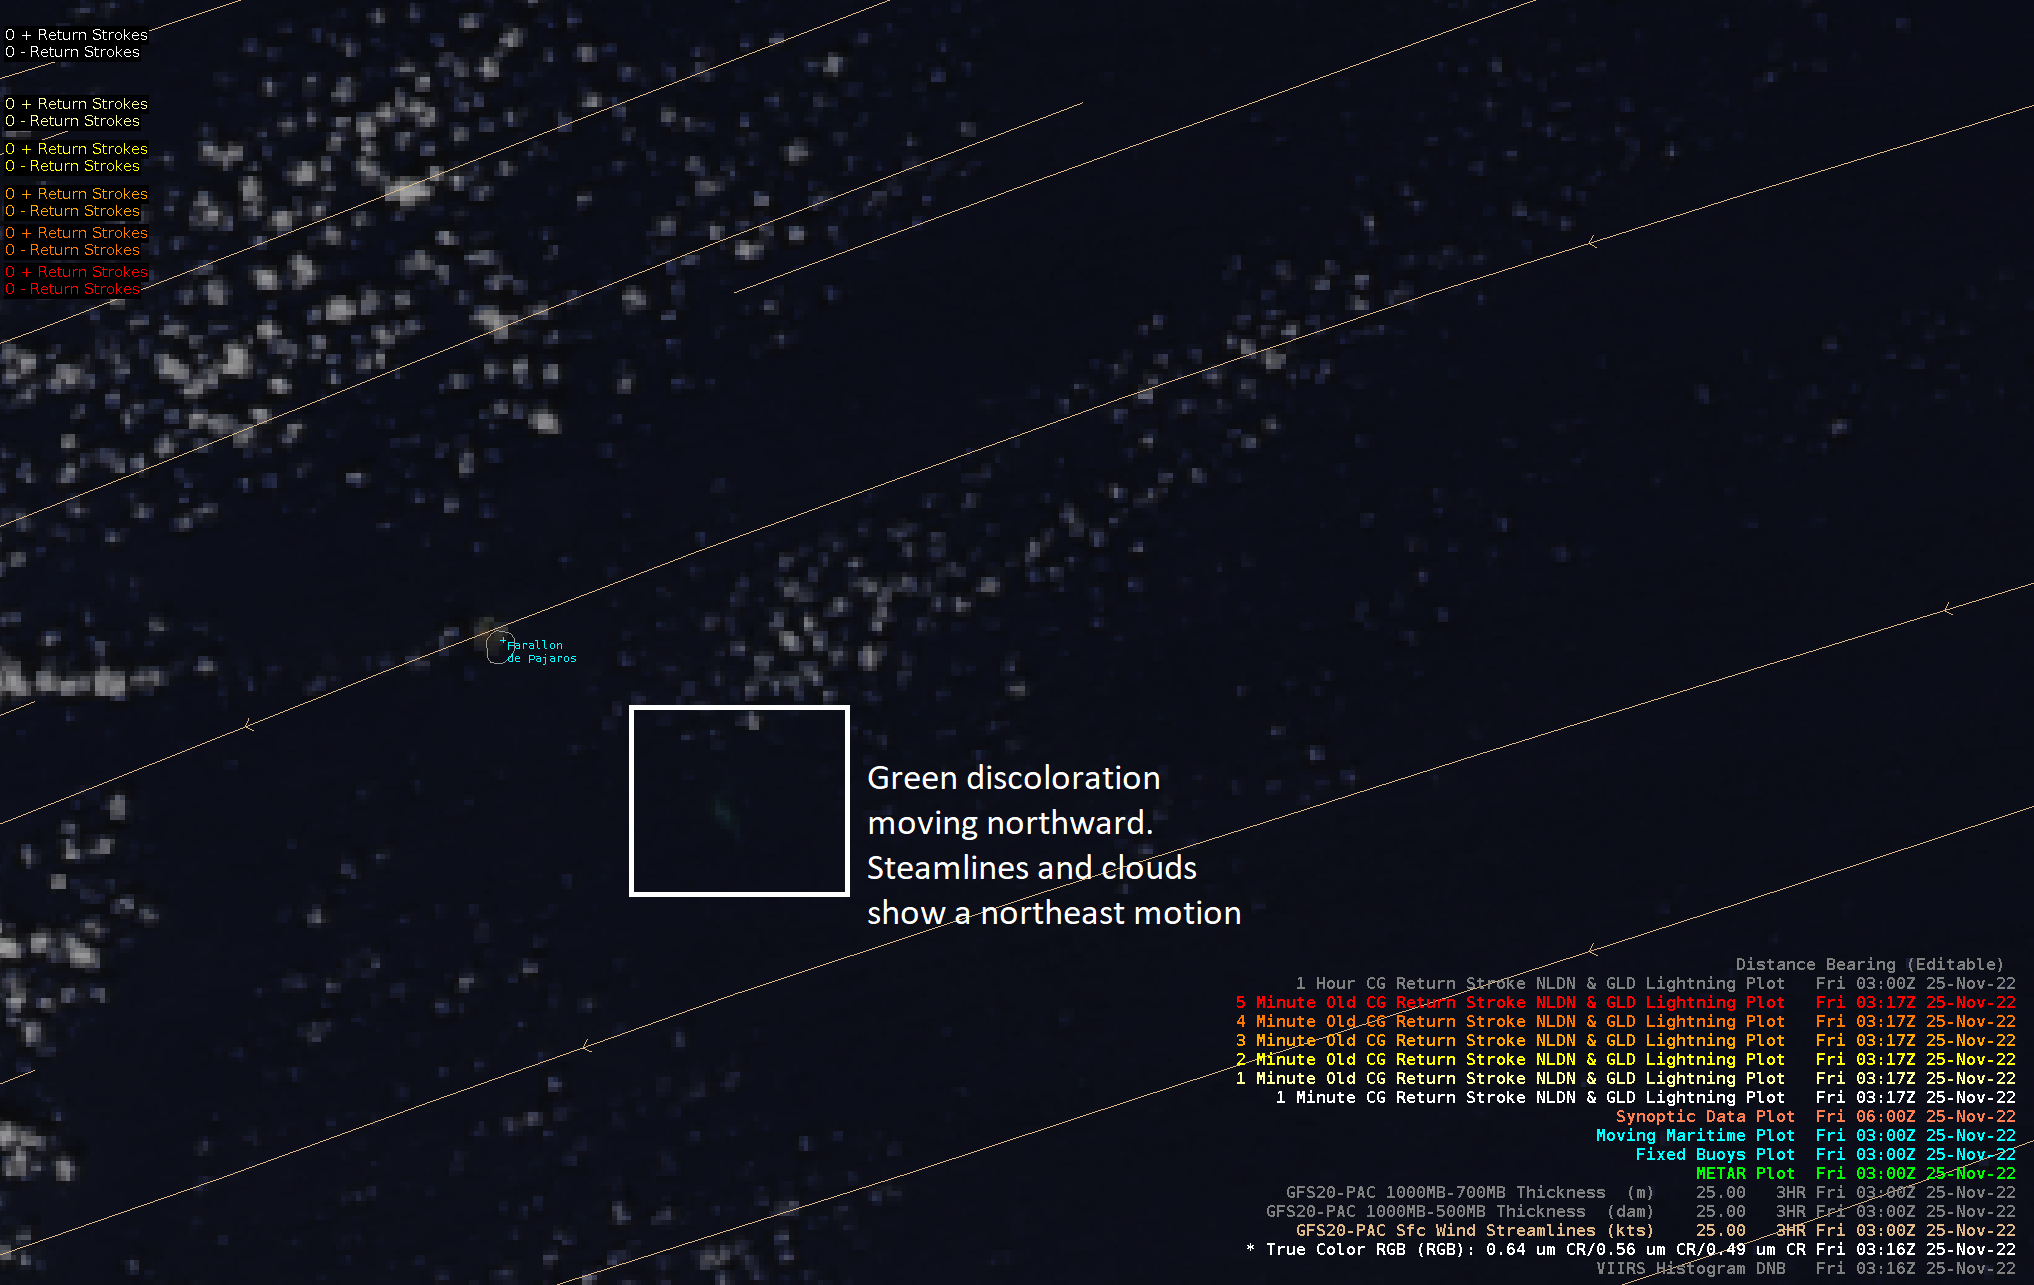
The Ahyi Seamount is an underwater volcano in the northern Marianas that rises to within 137 m of the Pacific Ocean surface (Click here for more information). VIIRS True-color imagery within the past week shows discoloration in the ocean over the seamount location, suggestive of some sort of eruptive activity. (See this News Article). The image above using Suomi NPP VIIRS data, (annotated images courtesy Meteorologist Nick Slaughter at the National Weather Service office on Guam), shows slight discoloration in the box centered on the seamount location. The NOAA-20 true-color image below, shows the evolution of the discoloration in the 45 minutes between images.
NOAA-20 VIIRS True Color Imagery, 0316 UTC on 25 November 2022 (Click to enlarge)
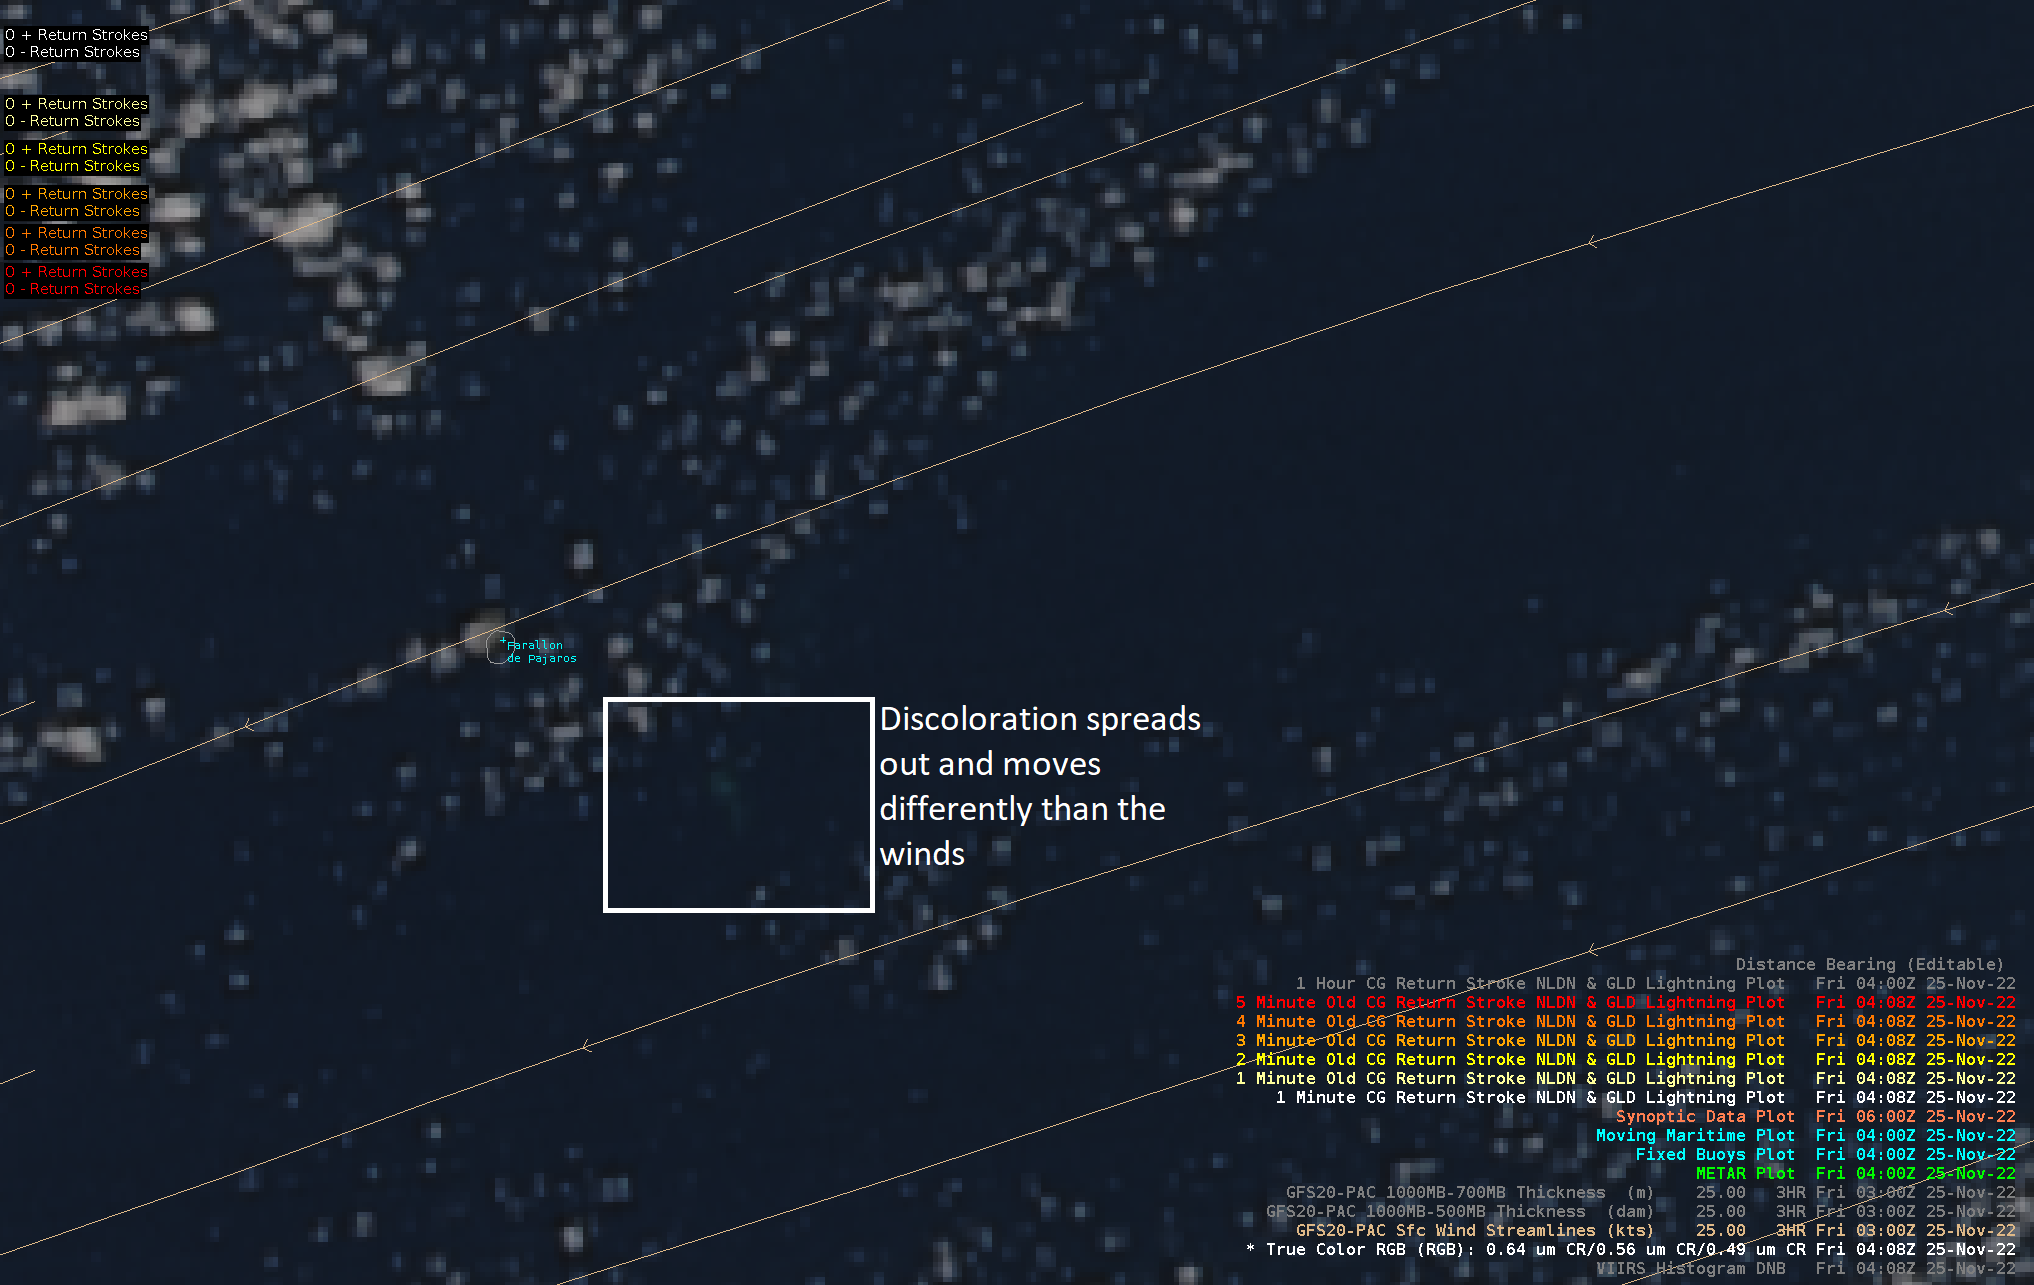
A second Suomi NPP Pass also viewed the scene at 0408 UTC on 25 November 2022 (NPP Orbits for the 25th can be viewed here; the NOAA-20 orbits are here). The movement of the discoloration, as noted by the annotations, differs from the atmospheric flow.
Suomi-NPP VIIRS True-Color Imagery, 0408 UTC on 25 November 2022 (Click to enlarge)
Suomi NPP and NOAA-20 data over Guam are provided by a Direct Broadcast antenna attached to the office. Data are processed for AWIPS using CSPP, the Community Satellite Processing Package, and Polar2Grid.
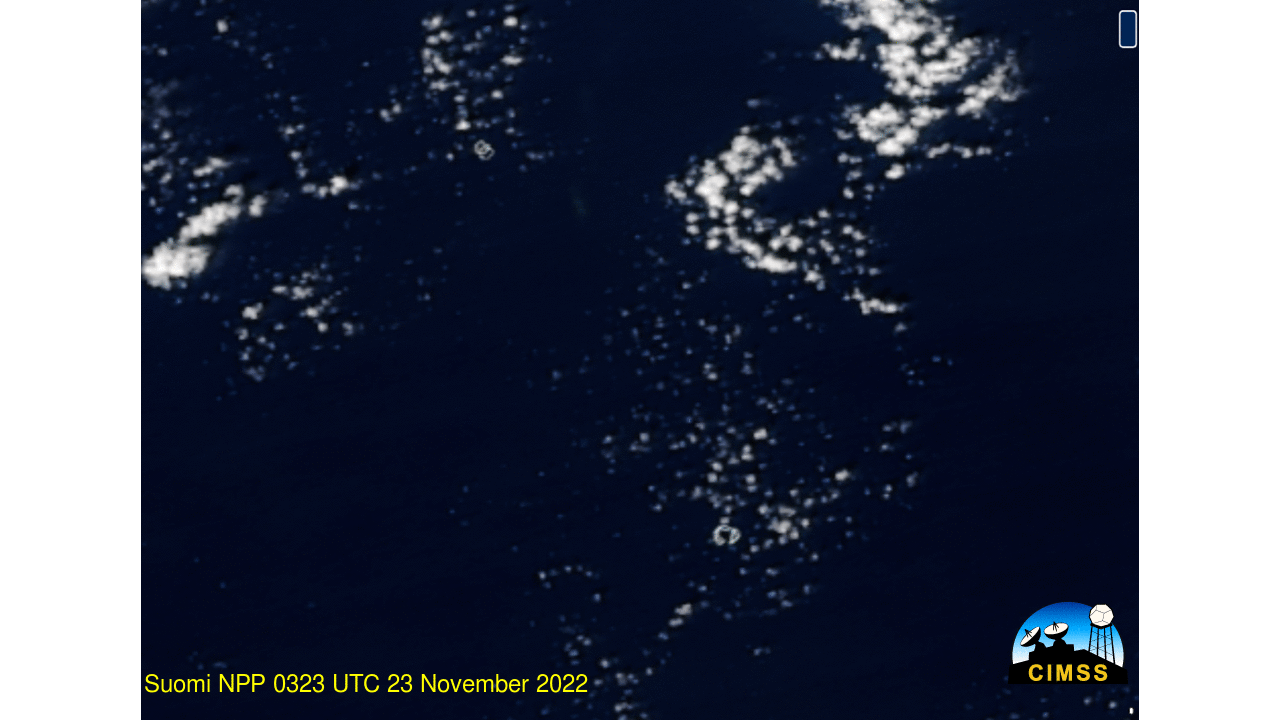
Careful inspection of Suomi NPP True-Color imagery at the JStar Mapper reveals faint discoloration over the seamount on 23 November as well, as shown below.
Suomi NPP VIIRS True-Color imagery, 0323 UTC on 23 November 2022 (Click to enlarge)
Many Thanks to Nick Slaughter, WFO GUM, for both the imagery and the information on this event!
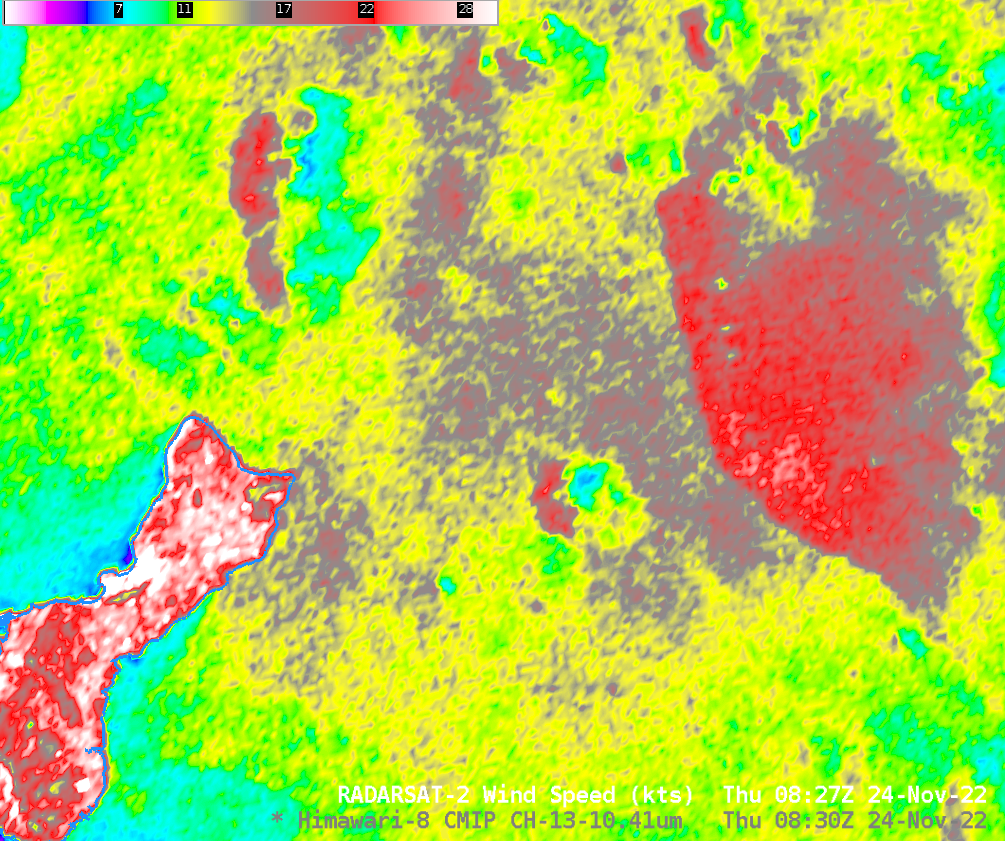
The 10th and final special RADARSAT-2 data collection of SAR winds over the Guam Area of Responsibility (AOR) occurred on 24 November, and is shown above in a toggle with the Himawari-8 Clean Window imagery at the same time (Here is the same toggle as above but with SAR data... Read More
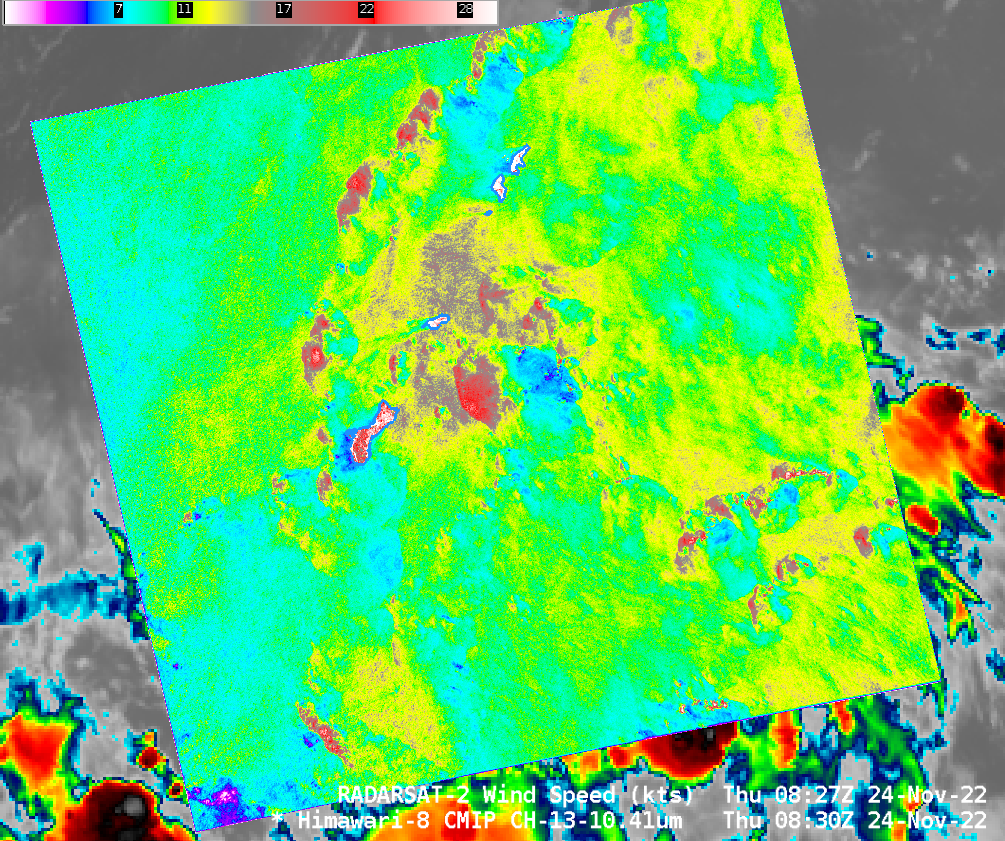
Himawari-8 Band 13 Clean Window Infrared (10.4) imagery and SAR winds (color-enhanced from 0-30 knots) from RADARSAT-2, 0830 UTC on 24 November 2022 (Click to enlarge)
The 10th and final special RADARSAT-2 data collection of SAR winds over the Guam Area of Responsibility (AOR) occurred on 24 November, and is shown above in a toggle with the Himawari-8 Clean Window imagery at the same time (Here is the same toggle as above but with SAR data enhanced with a Beaufort Scaling, from 0-125 knots). Of note in this image is the feature with strong winds — up to 30 knots — to the west of Guam (Here’s a zoomed-in view). The curved westward edge suggests some type of outflow boundary perhaps, and the Himawari-8 imagery does show convection just to the east. Many people would be hard pressed to predict the distribution of winds in the SAR field below from the Himawari-8 imagery! The strongest winds are in a region centered on Rota — the island just northeast of Guam. It’s hard to see why that is based on the Himawari-8 Clean Window image. The arc of stronger winds from north-northwest of Guam is (at least) associated with clouds, albeit clouds with warm brightness temperatures.
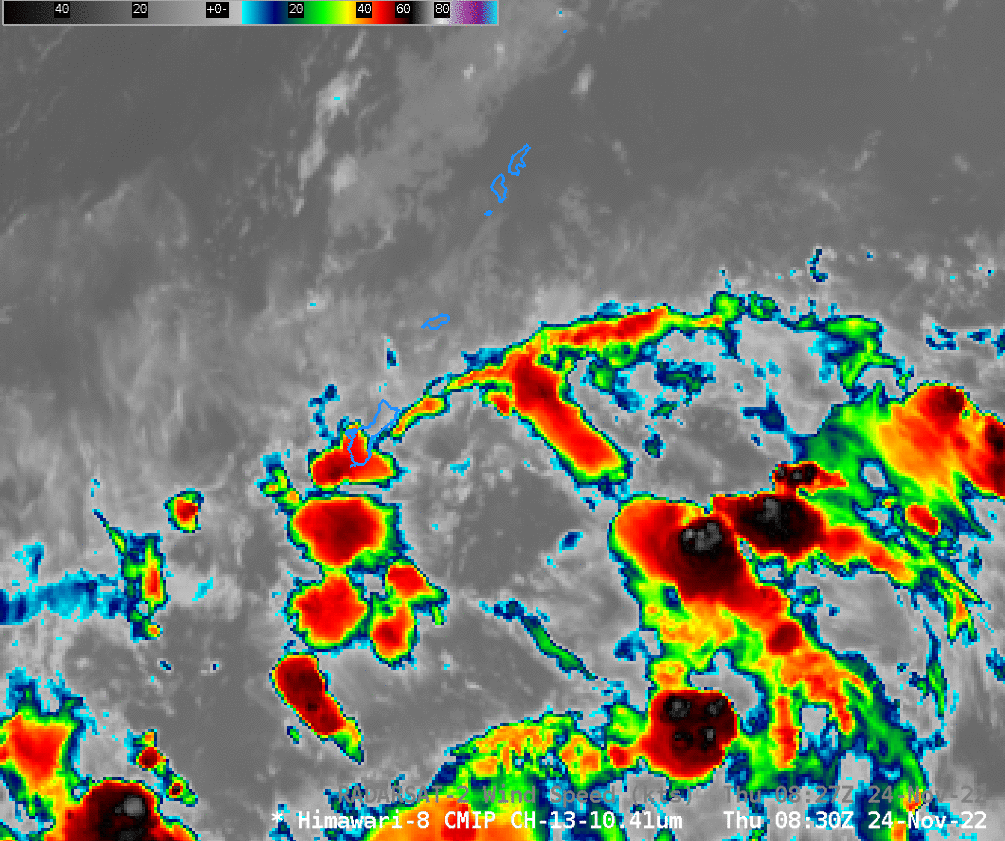
Himawari-8 Band 13 Clean Window Infrared (10.4) imagery overlain with SAR winds (color-enhanced from 0-30 knots) from RADARSAT-2, 0830 UTC on 24 November 2022 (Click to enlarge)
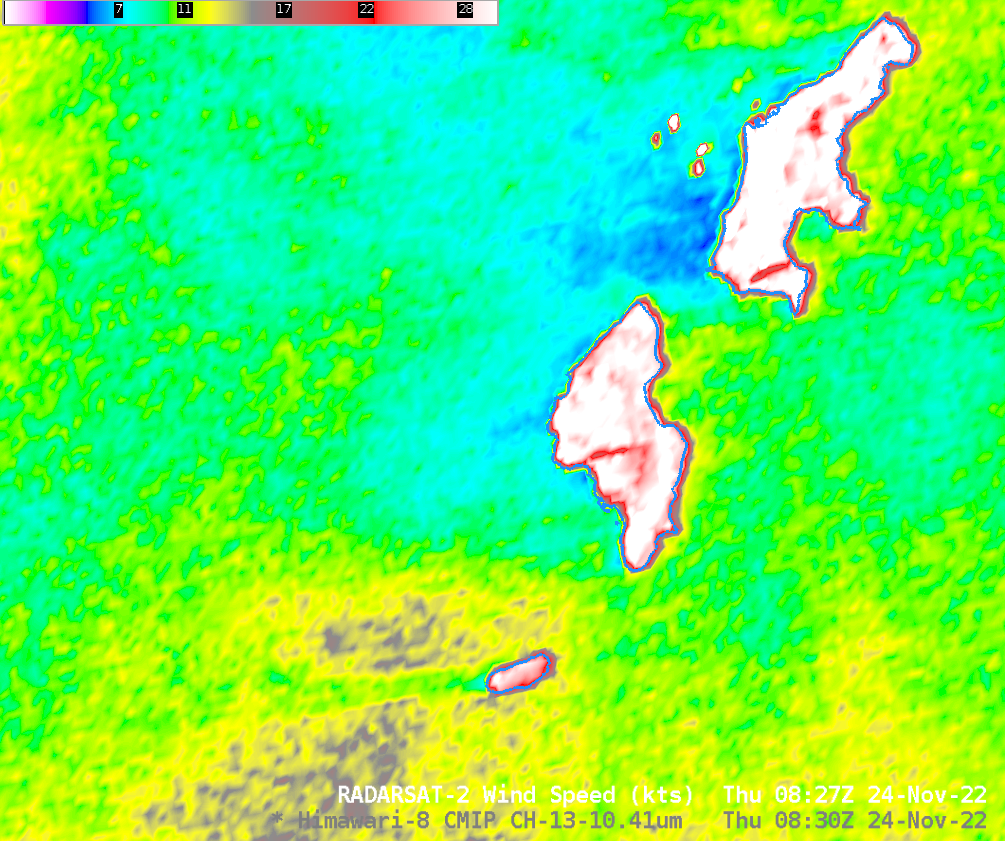
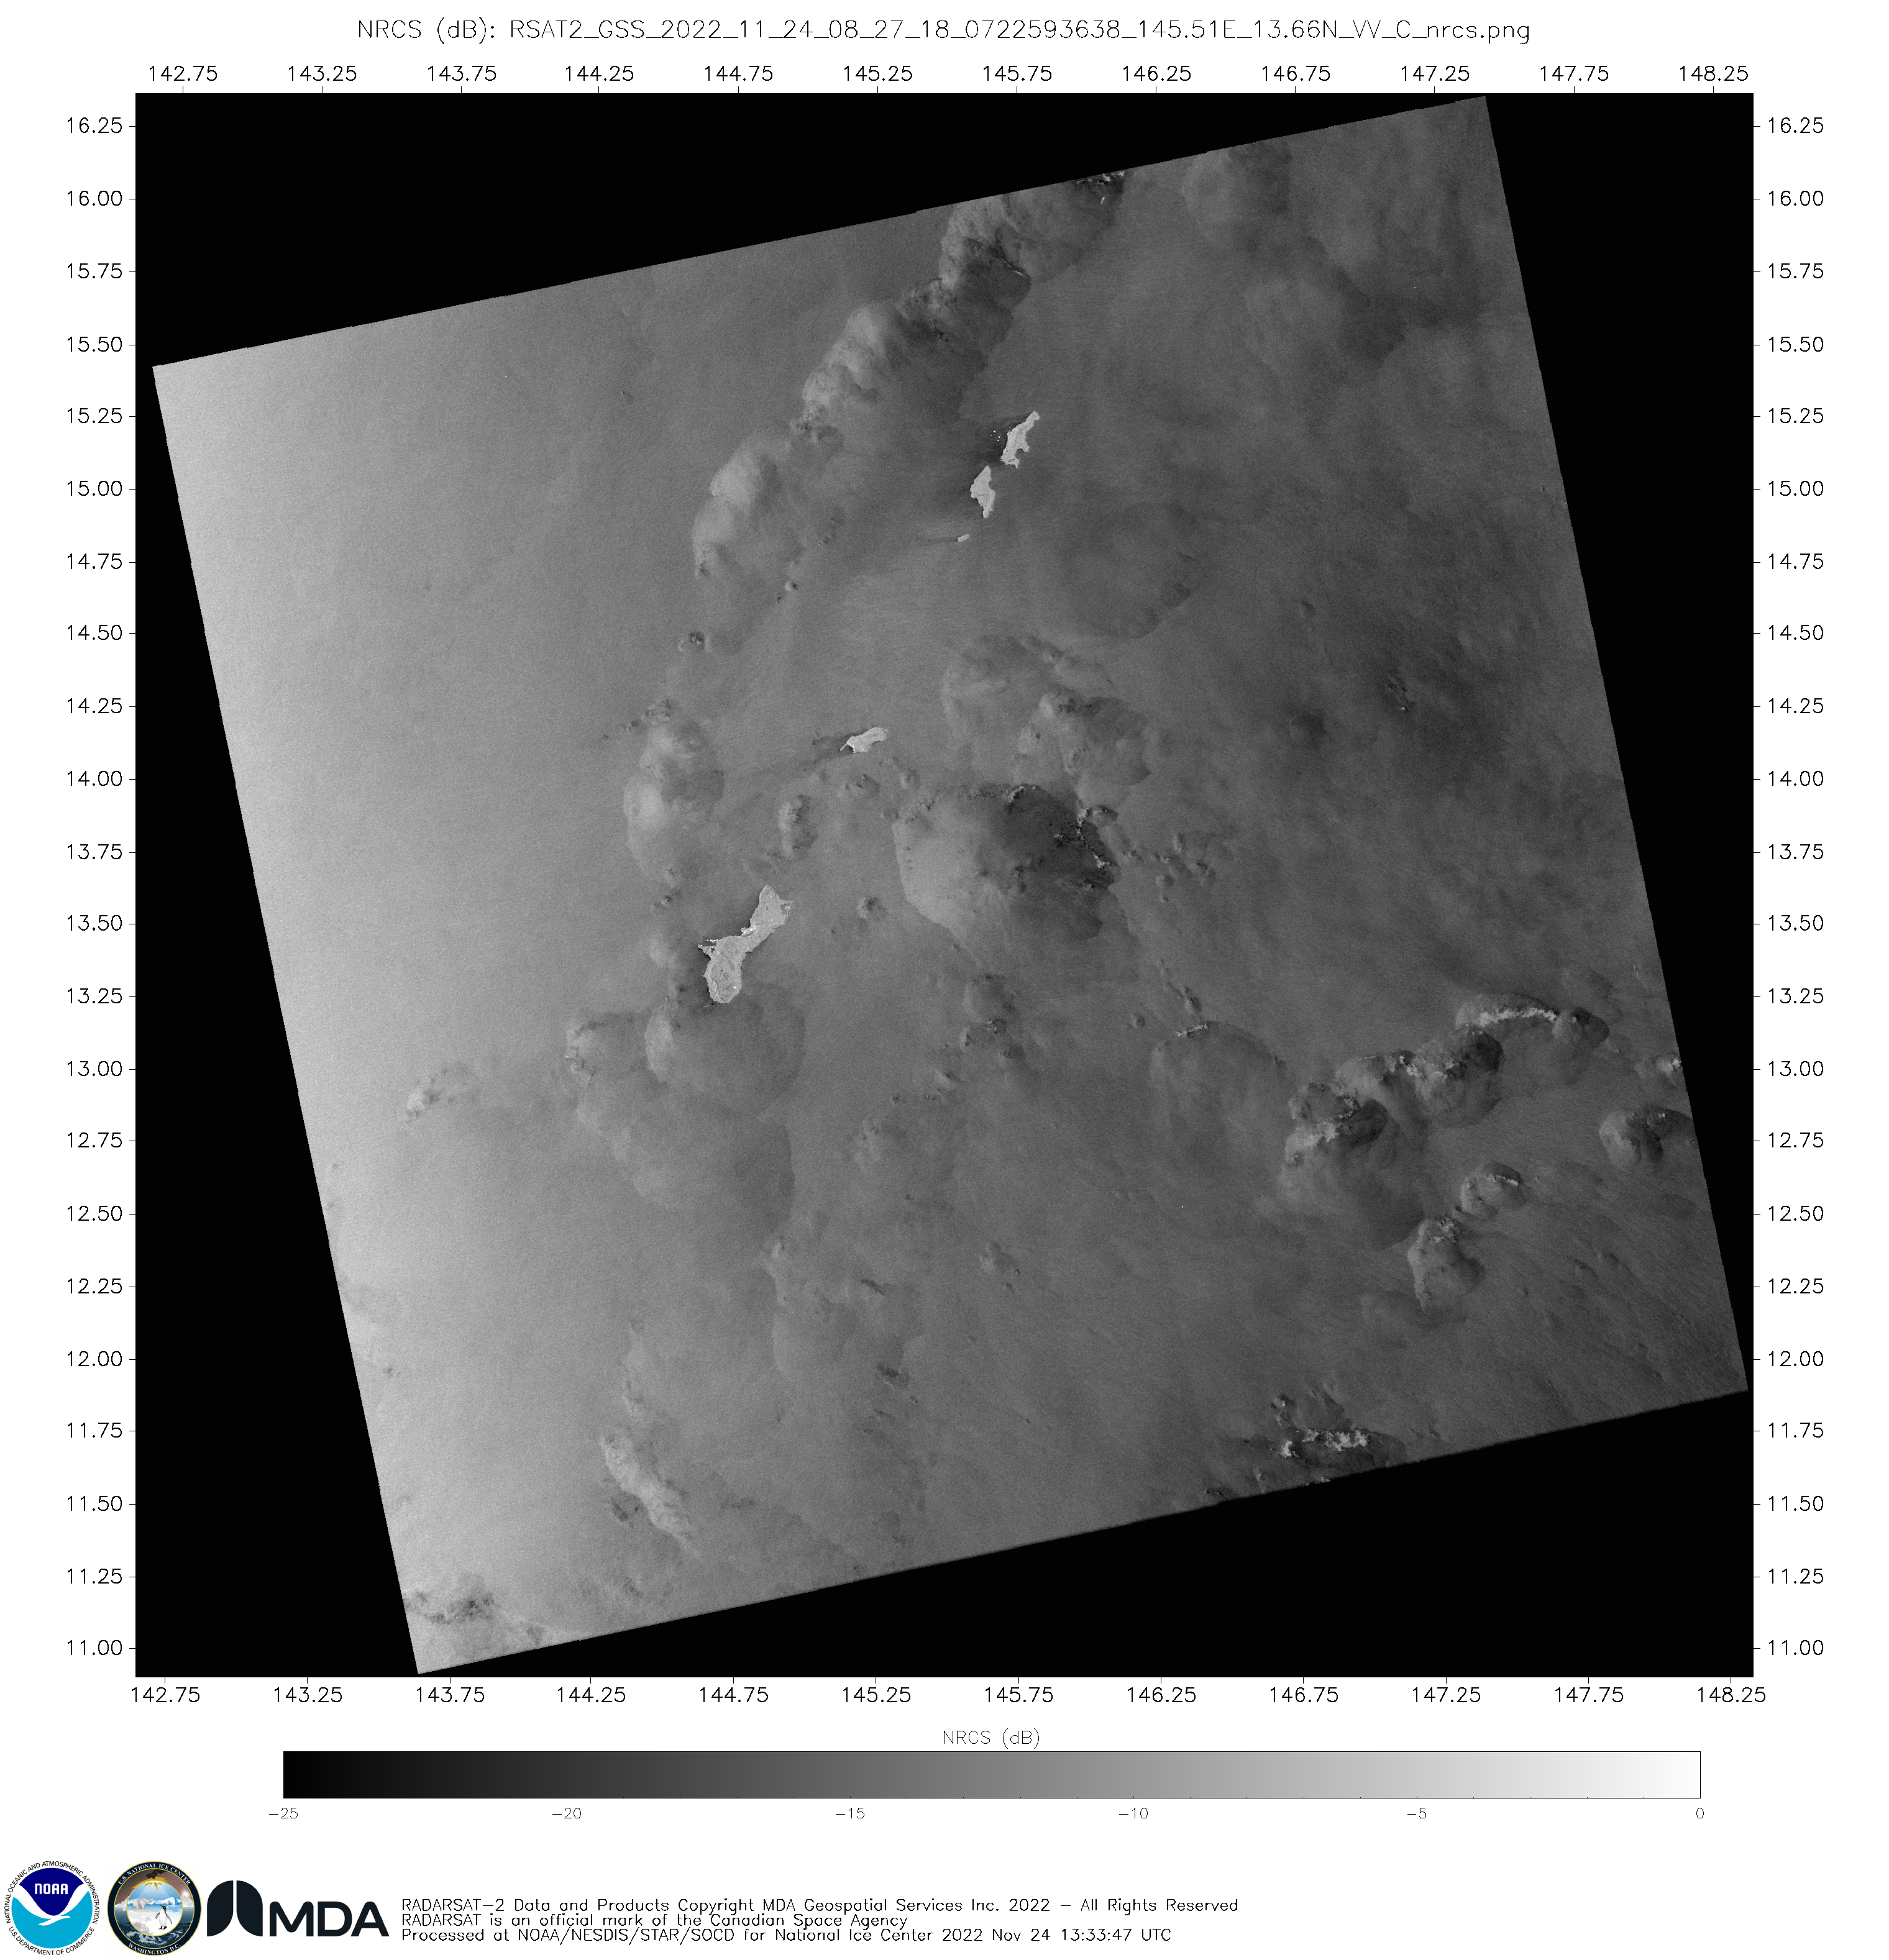
Careful inspection of the imagery above (or the Normalized Radar Cross Section imagery available at this site), shows that the ships are back offshore of Saipan! They are apparent in the zoomed-in image below.
SAR winds (color-enhanced from 0-30 knots) from RADARSAT-2, 0830 UTC on 24 November 2022 (Click to enlarge)
Thanks to the SAR people at NOAA/STAR for supporting these special SAR data collections near Guam!
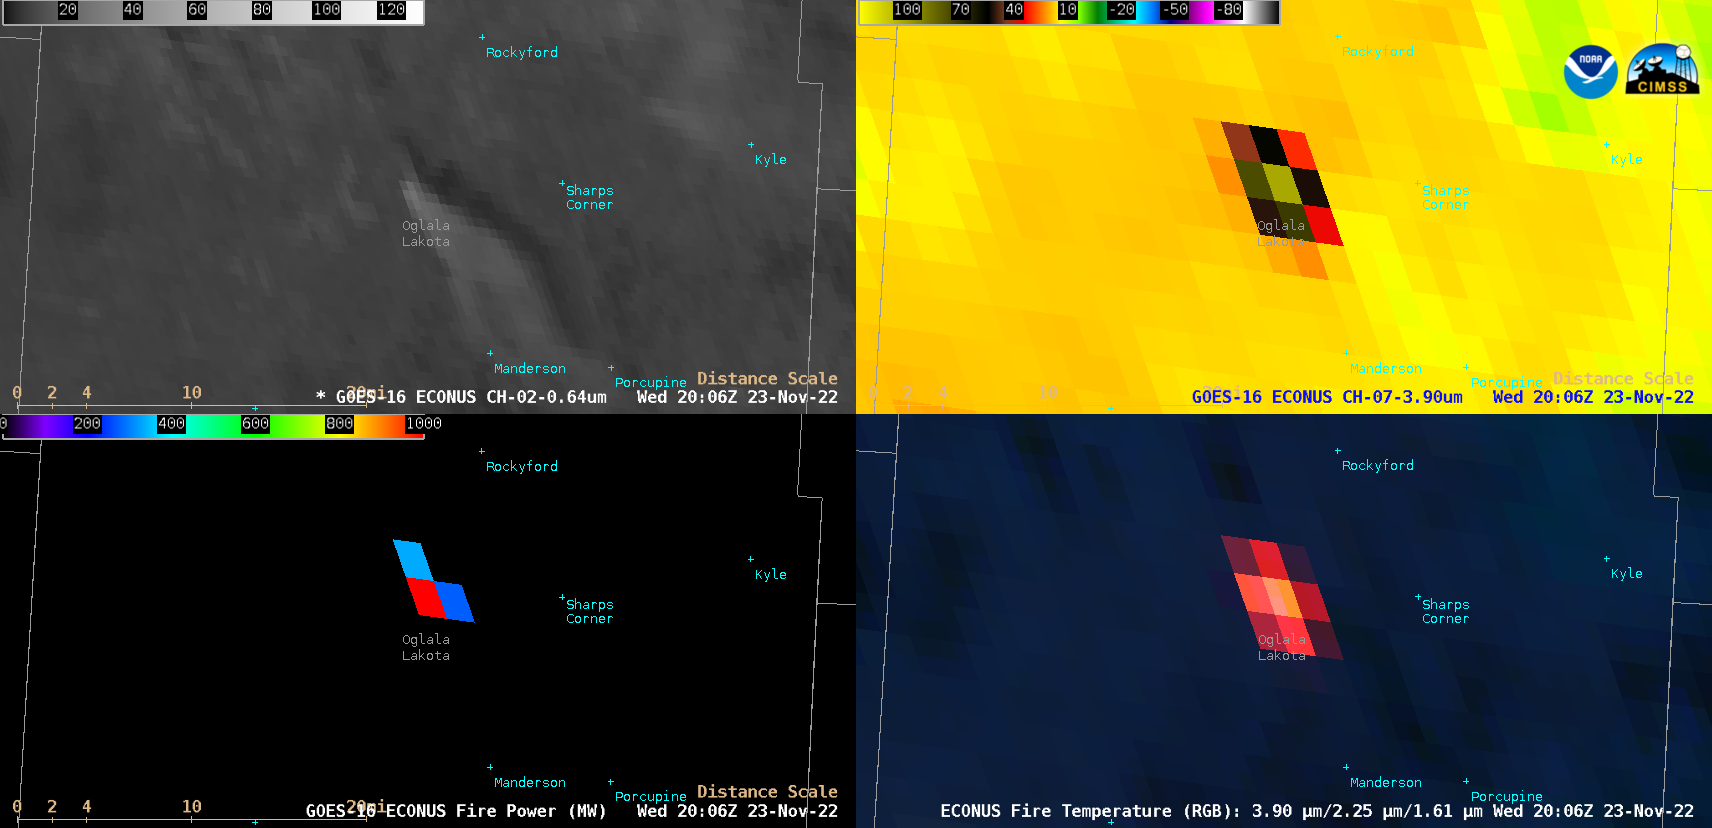
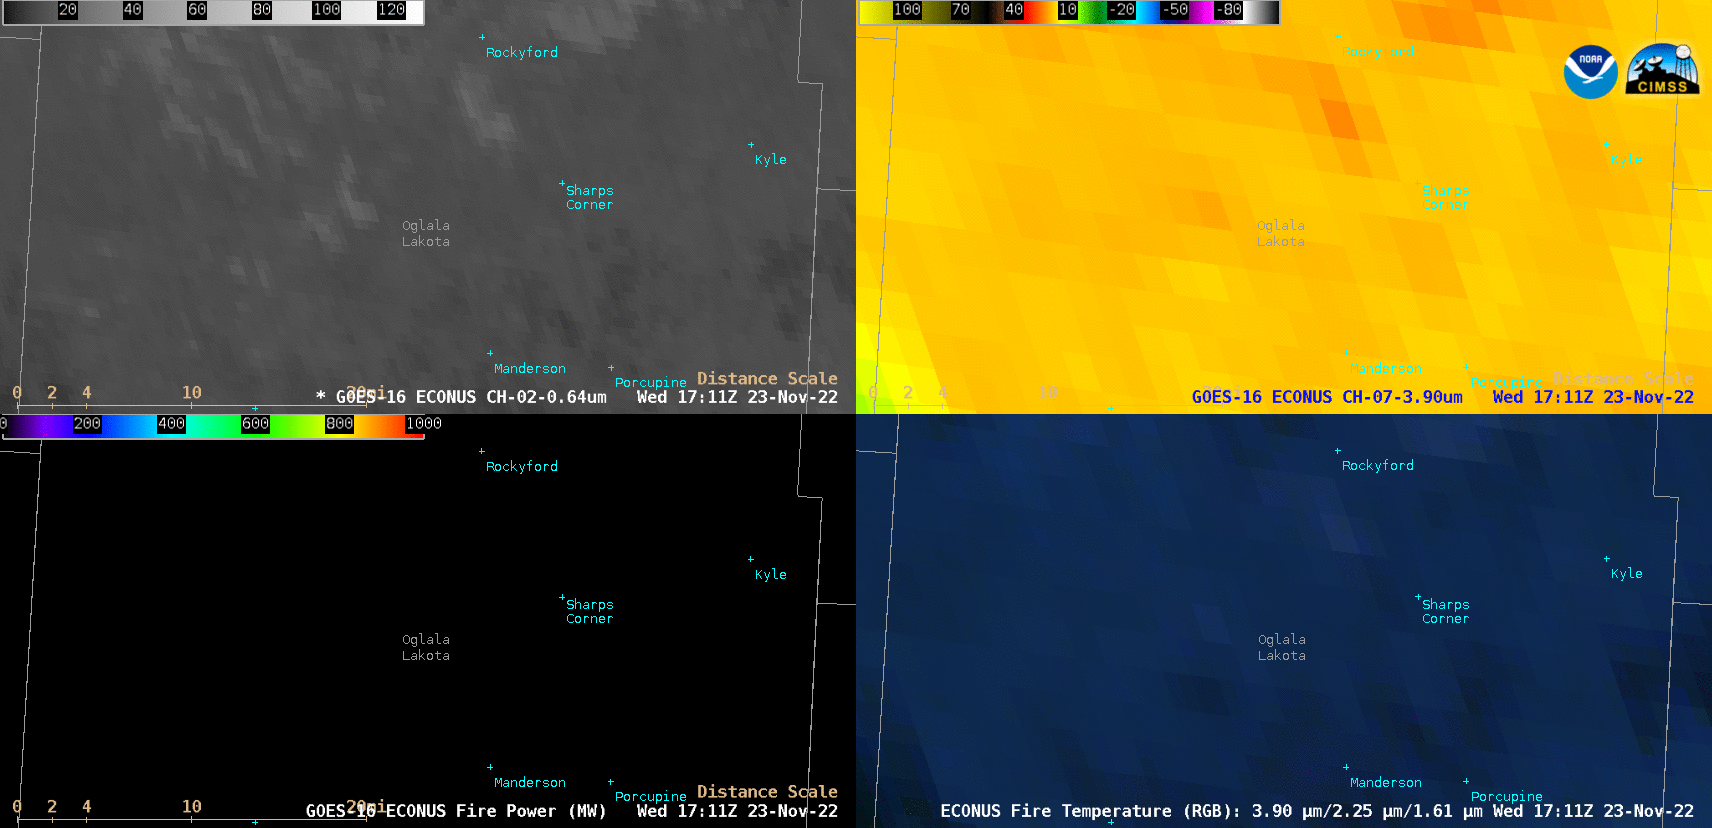
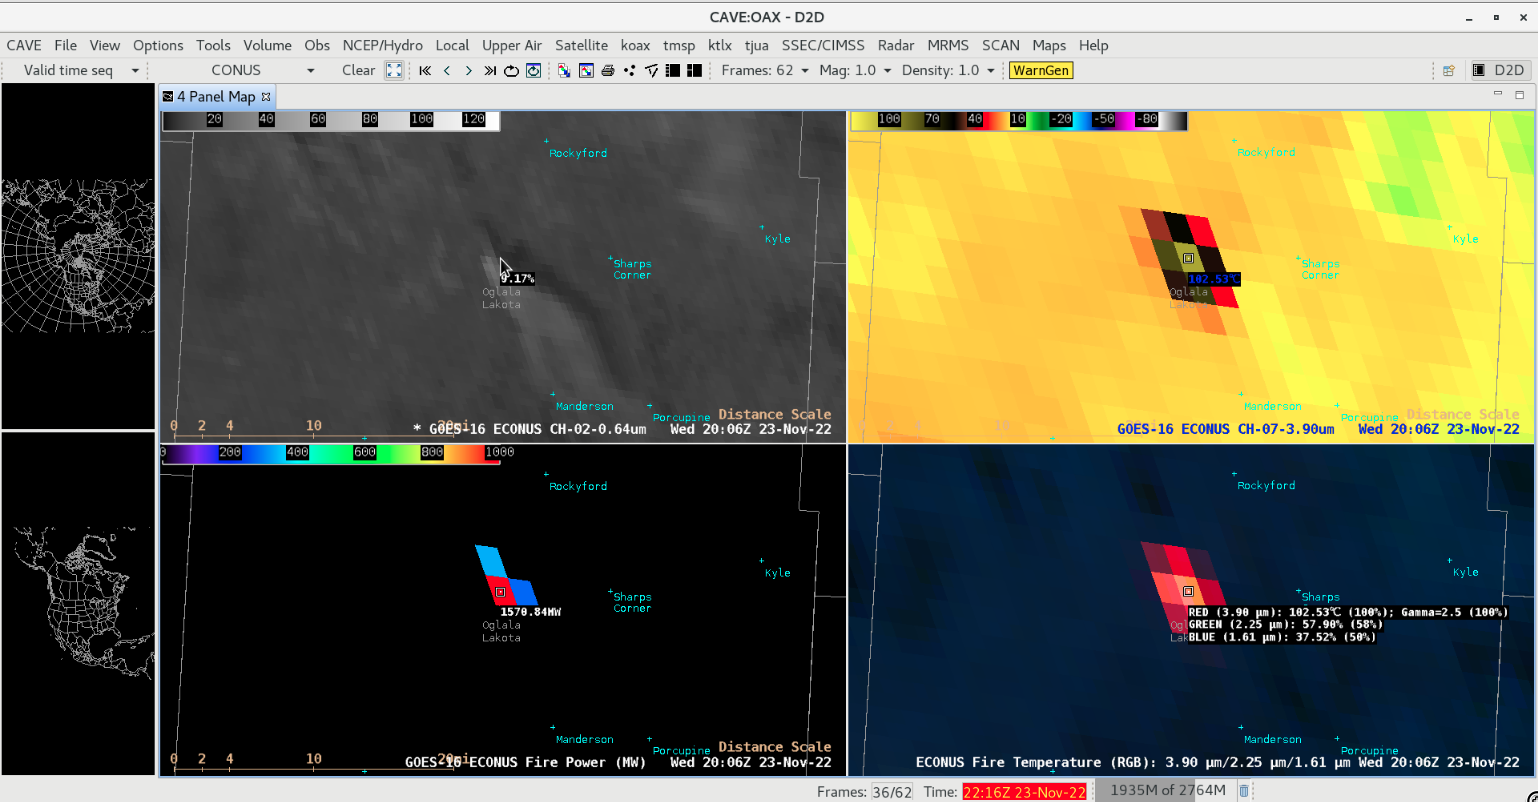
5-minute GOES-16 (GOES-East) “Red” Visible (0.64 µm), Shortwave Infrared (3.9 µm), Fire Power derived product and Fire Temperature RGB images (above) displayed signatures of the wind-driven “Turkey Day” grassland fire in Oglala Lakota County in southwestern South Dakota on 23 November 2022. Peak 3.9 µm infrared brightness temperature (102.53ºC) and Fire Power (1570.84 MW) values were... Read More
GOES-16 “Red” Visible (0.64 µm, top left), Shortwave Infrared (3.9 µm, top right), Fire Power (bottom left) and Fire Temperature RGB (bottom right) images [click to play animated GIF | MP4]
5-minute GOES-16 (GOES-East) “Red” Visible (0.64 µm), Shortwave Infrared (3.9 µm), Fire Power derived product and Fire Temperature RGB images (above) displayed signatures of the wind-driven “Turkey Day” grassland fire in Oglala Lakota County in southwestern South Dakota on 23 November 2022. Peak 3.9 µm infrared brightness temperature (102.53ºC) and Fire Power (1570.84 MW) values were seen at 2006 UTC (the Fire Power derived product is a component of the GOES Fire Detection and Characterization Algorithm FDCA). Clouds began to move over the fire late in the day, thereby masking its thermal signature.
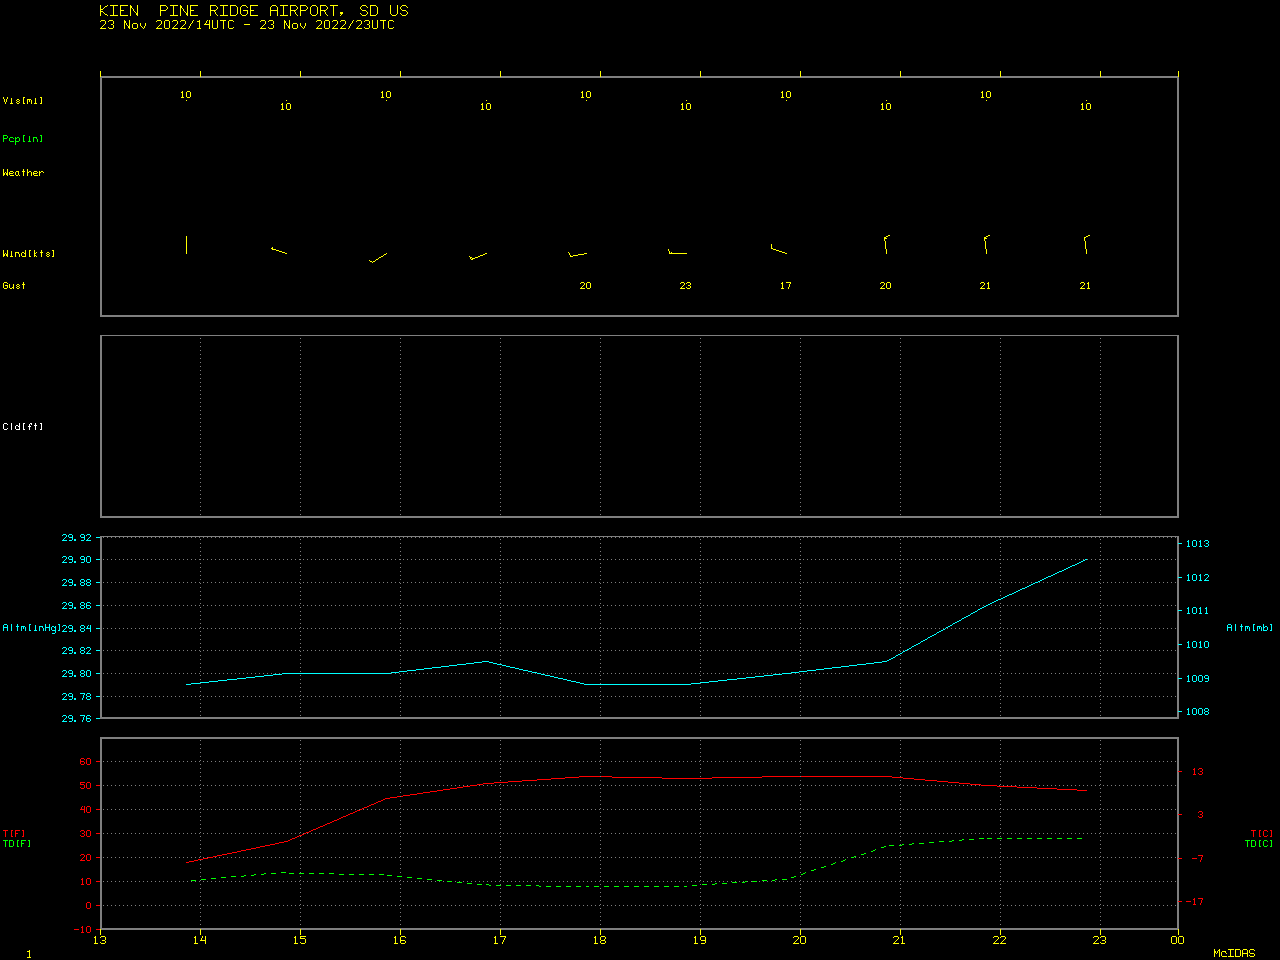
A toggle between Suomi-NPP VIIRS True Color RGB and False Color RGB images valid at 2016 UTC(below) provided a higher-resolution view of the narrow, dark burn scar as well as the smoke plume; in the False Color image, the hottest signature at the leading (southern) edge of the fire showed up as brighter shades of pink. Note how the fire’s burn scar initially moved eastward about 1 mile, but then jogged toward the southeast as surface winds with gusts in the 20-26 knot range (Pine Ridge SD observations) abruptly shifted from westerly to northwesterly (in the wake of a cold frontal passage). The data to produce these VIIRS images were downloaded and processed using the SSEC/CIMSS Direct Broadcast ground station.
Suomi-NPP VIIRS True Color RGB and False Color RGB images, valid at 2016 UTC [click to enlarge]
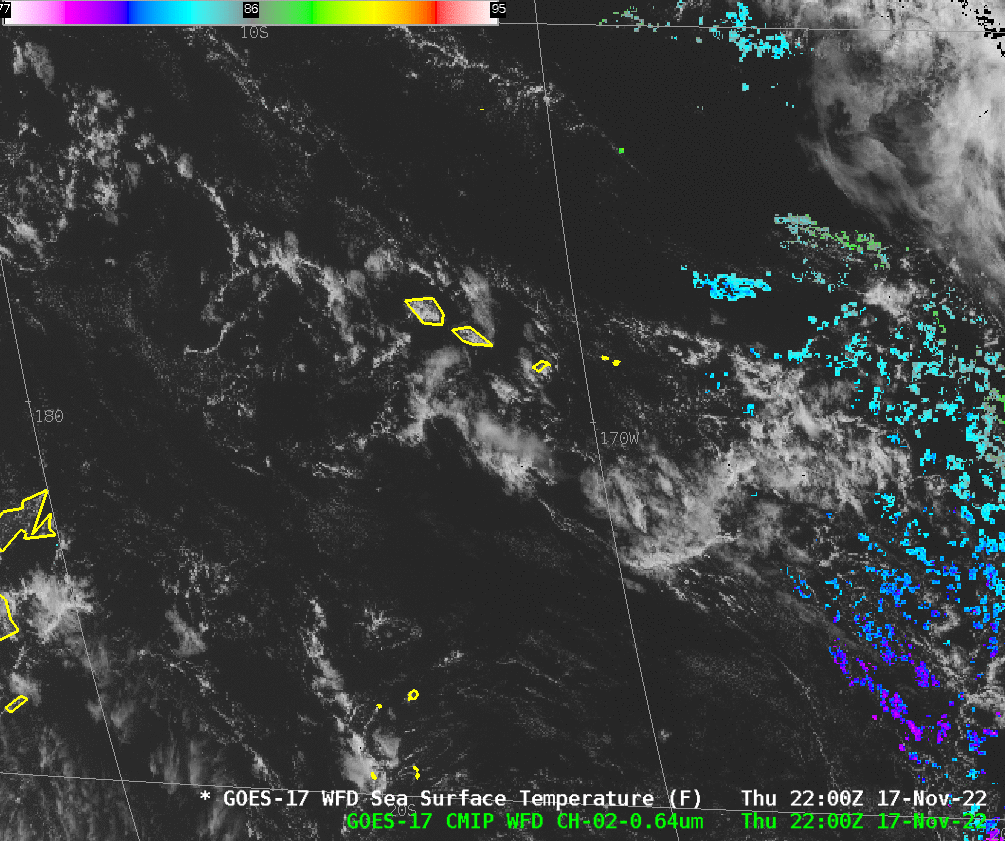
The animation of GOES-17 visible imagery (Band 2, 0.64 µm), above, (created at the CSPP Geosphere site) shows the characteristic signal of Sun Glint — the moving bright region. Sun glint (also discussed on this blog here, here, here, here and — for moonglint: here!) occurs when radiation from the Sun reflects... Read More
GOES-17 Band 2 Visible (0.64 µm), 2350 UTC on 17 November 2022 to 0300 UTC on 18 November
The animation of GOES-17 visible imagery (Band 2, 0.64 µm), above, (created at the CSPP Geosphere site) shows the characteristic signal of Sun Glint — the moving bright region. Sun glint (also discussed on this blog here, here, here, here and — for moonglint: here!) occurs when radiation from the Sun reflects off the ocean surface and is detected by the satellite sensor, in this case the GOES-17 ABI. On the day displayed (17 November), this reflection was pronounced because of light winds and flat seas. The flatter the sea, the more pronounced and intense the reflection; a useful analogy is flat and wrinkled aluminum foil for flat and wavy seas, respectively. You would expect to see a more concentrated reflection off the flat aluminum foil.
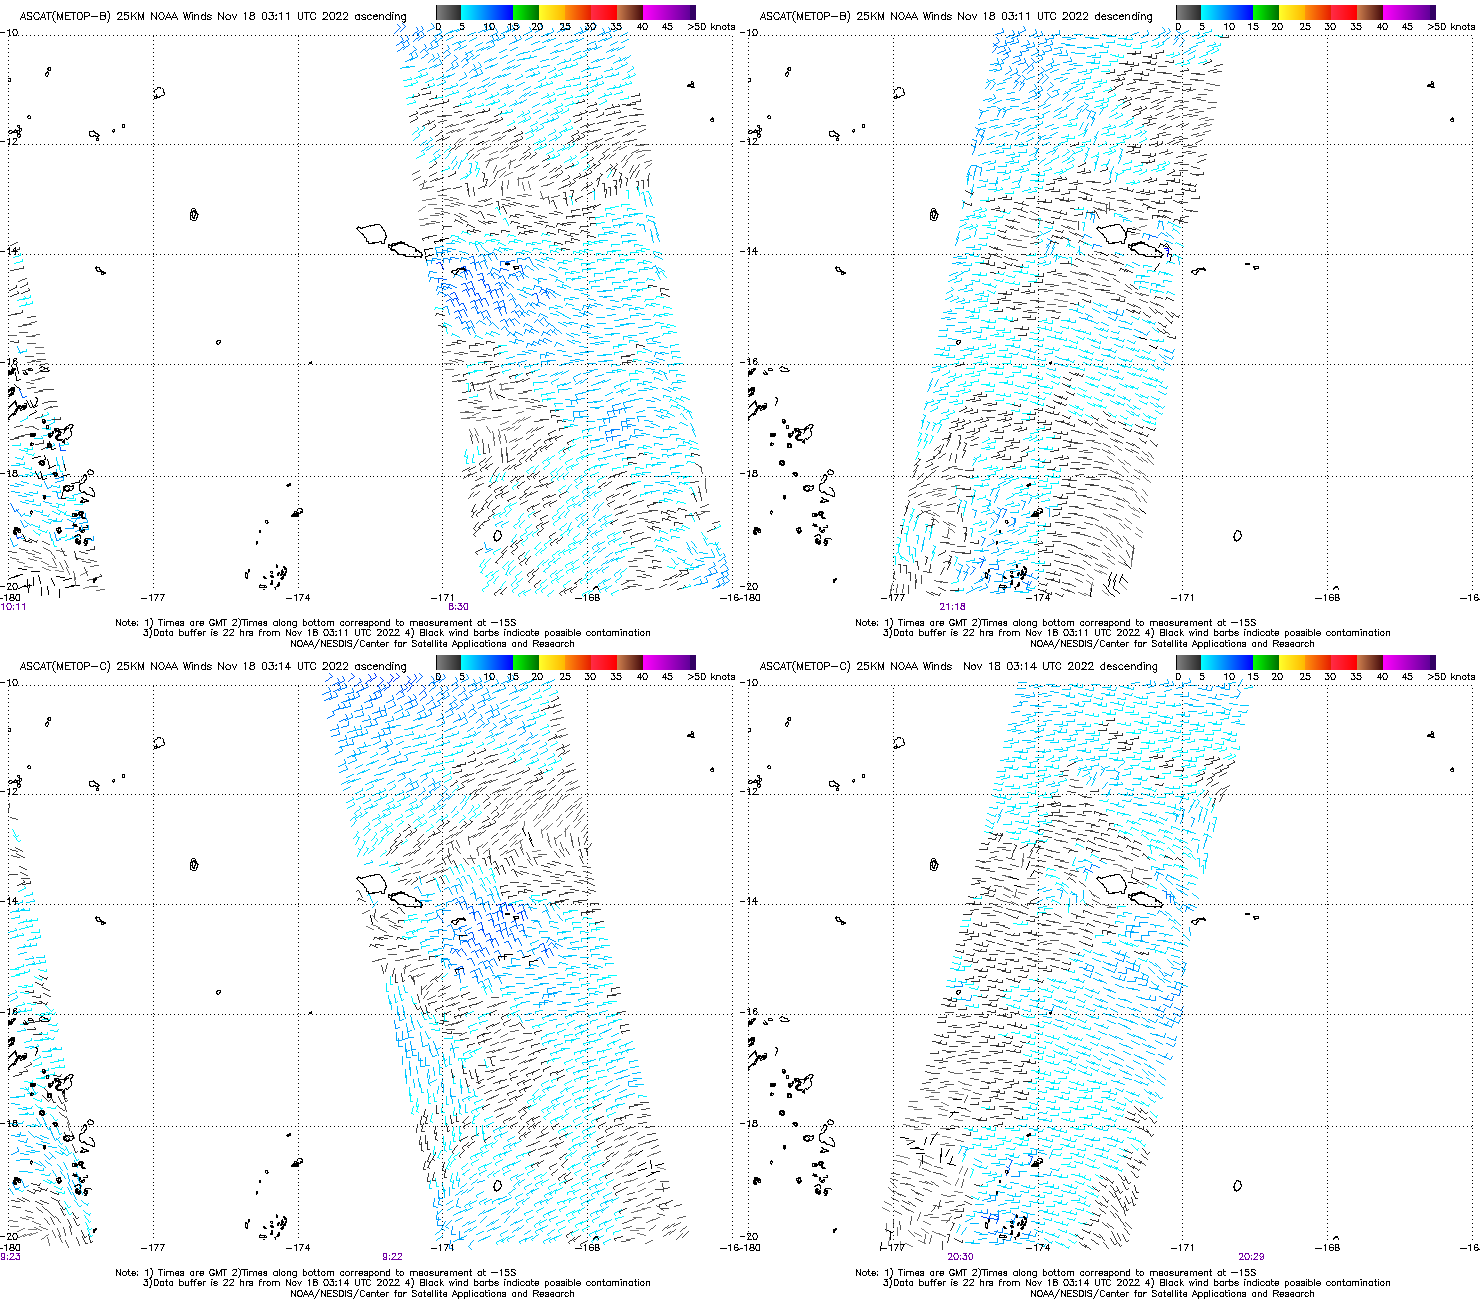
How light were the winds? MetopB and MetopC scatterometer winds, shown in tandem below, from 17 November (from this site), show very light winds to the northeast of the Samoan islands.
ASCAT winds from MetopB (top row) and MetopC (bottom row) on 17 November 2022. Ascending pass (note times near 0900 UTC in purple at the bottom of the imagery) on left, descending pass (times near 2100 UTC) on right (Click to enlarge)
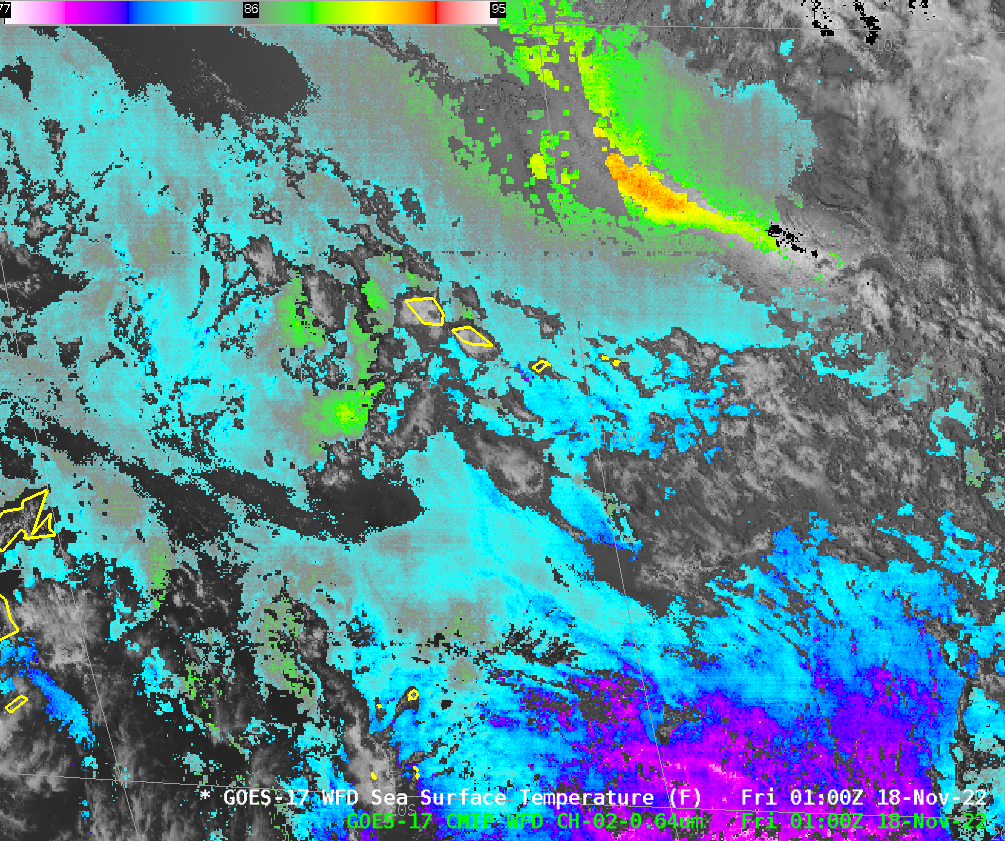
Conditions that support concentrated sun glint will also affect the computed sea-surface temperatures (SSTs). That is shown below. Note how warm the SSTs become (>93oF at 0100 UTC)!
GOES-17 Derived Sea Surface Temperatures (SSTs) under GOES-17 Band 2 Visible (0.64 µm) imagery, hourly from 2200 UTC 17 November to 0300 UTC 18 November 2022 (Click to enlarge)
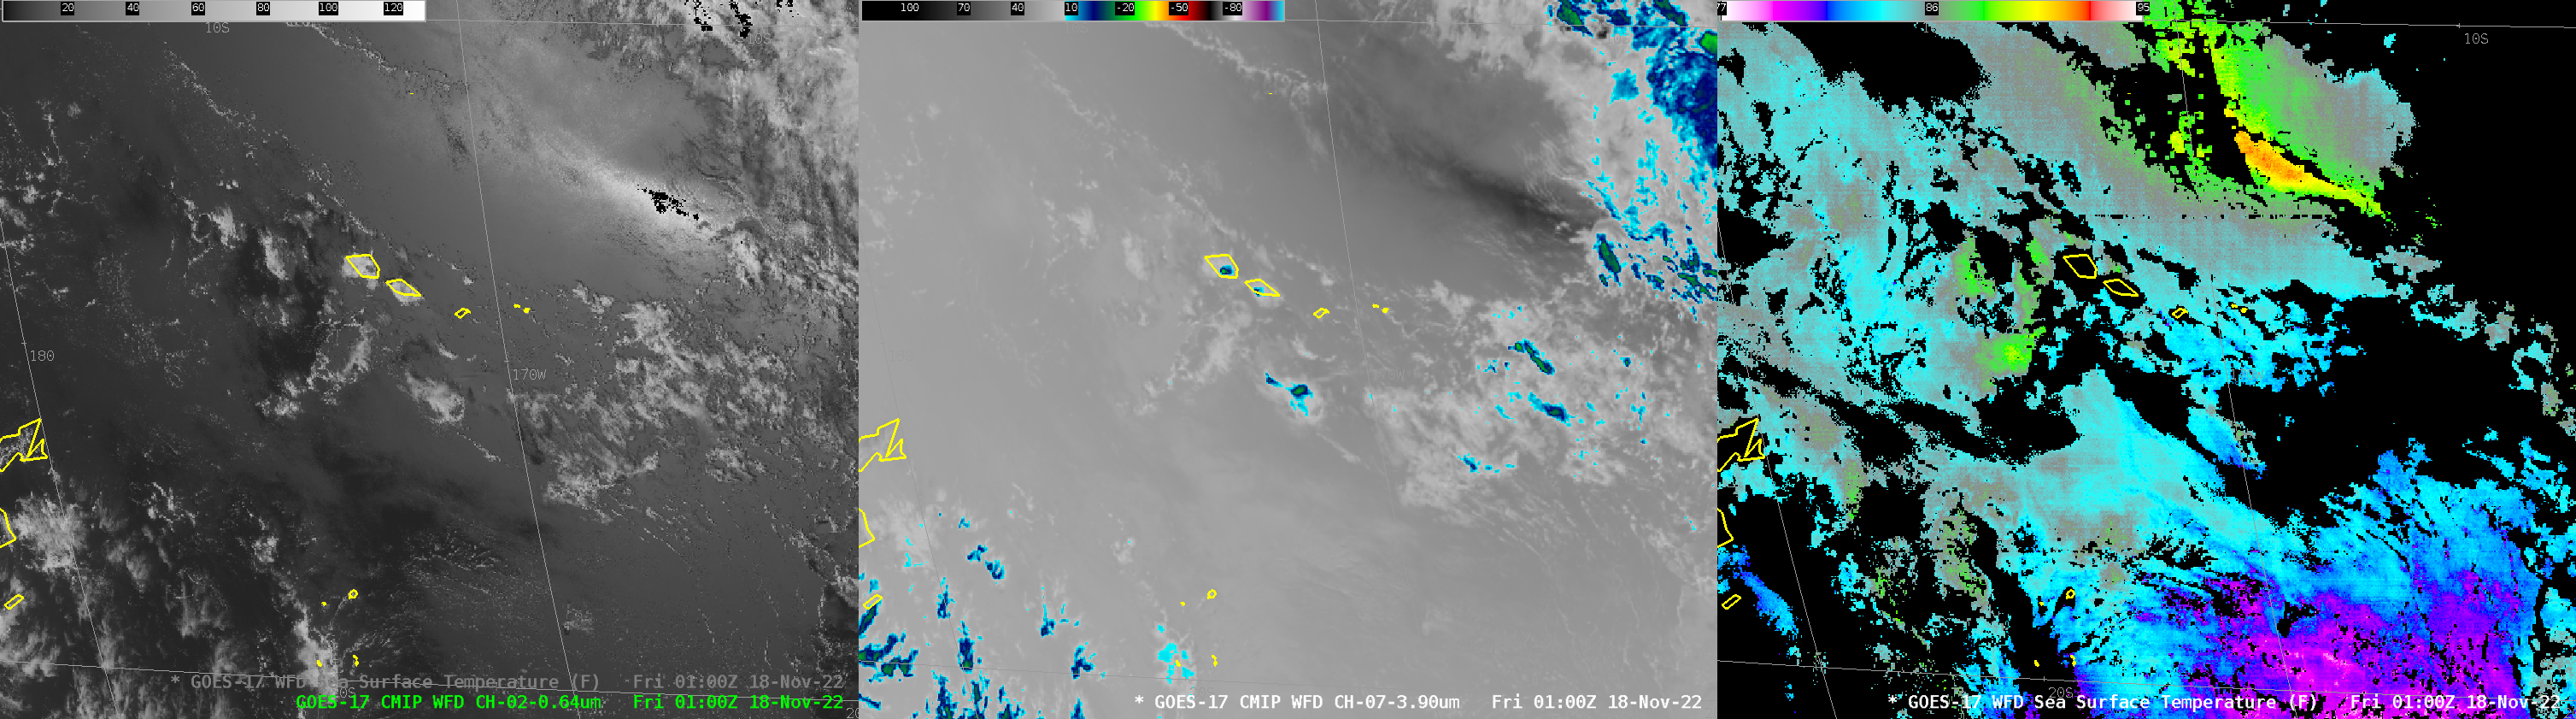
Should you believe the very warm SST values? If the seas are flat and winds are near calm, the surface skin of the ocean can become very warm, because mixing in the upper inches of the ocean is minimal absent forcing by winds and waves. The SST algorithm incorporates information from the shortwave IR band (Band 7 on ABI at 3.9 µm) and does account for sun glint (see pp 27-28 in the Algorithm Theoretical Basis Document). The image below shows 0100 UTC Visible (0.64 µm) on the left, Shortwave IR (3.9 µm) in the middle and computed SSTs on the right.
GOES-17 VIsible imagery (0.64 µm), left, shortwave infrared (3.9 µm), center and computed SSTs (right), all at 0100 UTC on 18 November 2022 (click to enlarge)
In winds are very light, expect to see warmer SSTs than in surrounding waters where winds are stronger (and vertical mixing in the ocean is therefore greater). However, pay attention if an increase in SSTs accompanies sun glint. The difference of 5oF shown above is likely contamination from reflected solar insolation.

