This website works best with a newer web browser such as Chrome, Firefox, Safari or Microsoft
Edge. Internet Explorer is not supported by this website.
1-minute Mesoscale Domain Sector GOES-16 (GOES-East) “Red” Visible (0.64 µm) images (above) showed abroad arc of fog/stratus that persisted for much of the day across parts of eastern Virginia, Chesapeake Bay and the Delmarva Peninsula on 03 May 2022. Since this fog/stratus deck — which was on the cold side... Read More
GOES-16 “Red” Visible (0.64 µm) images [click to play animated GIF | MP4]
1-minute Mesoscale Domain Sector GOES-16 (GOES-East) “Red” Visible (0.64 µm) images (above) showed abroad arc of fog/stratus that persisted for much of the day across parts of eastern Virginia, Chesapeake Bay and the Delmarva Peninsula on 03 May 2022. Since this fog/stratus deck — which was on the cold side of a quasi-stationary frontal boundary — was slow to dissipate, it held daytime temperatures in the 50s and 60s F (in contrast to the 70s F in cloud-free areas east of the front, and 80s F west of the front). By the end of the day, some of the colder air and stratus had sagged southward across extreme northeastern North Carolina (including the northern end of the Outer Banks).
Afternoon thunderstorms reached strong to severe levels as they approached the frontal boundary, producing 1-inch diameter hail and damaging winds (SPC Storm Reports).
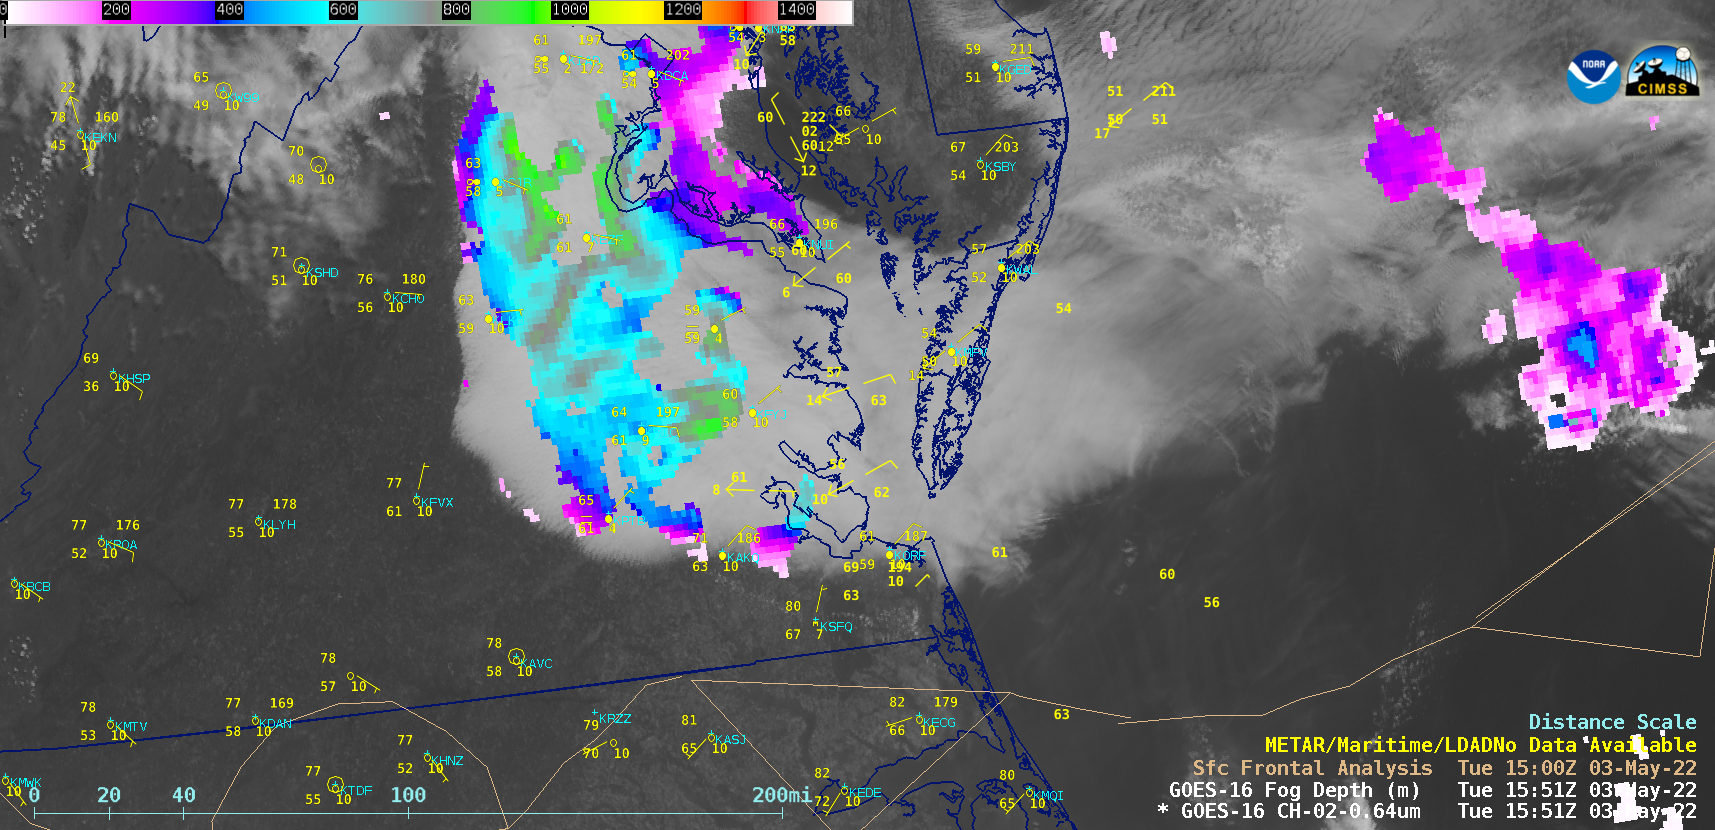
1-minute GOES-16 Visible images with overlays of the 5-minute GOES-16 Fog Depth product (below) provided an estimate of the fog/stratus deck thickness, helping to highlight which portions might be slower to dissipate.
GOES-16 “Red” Visible (0.64 µm) images, with an overlay of the GOES-16 Fog/Stratus Depth product [click to play animated GIF | MP4]
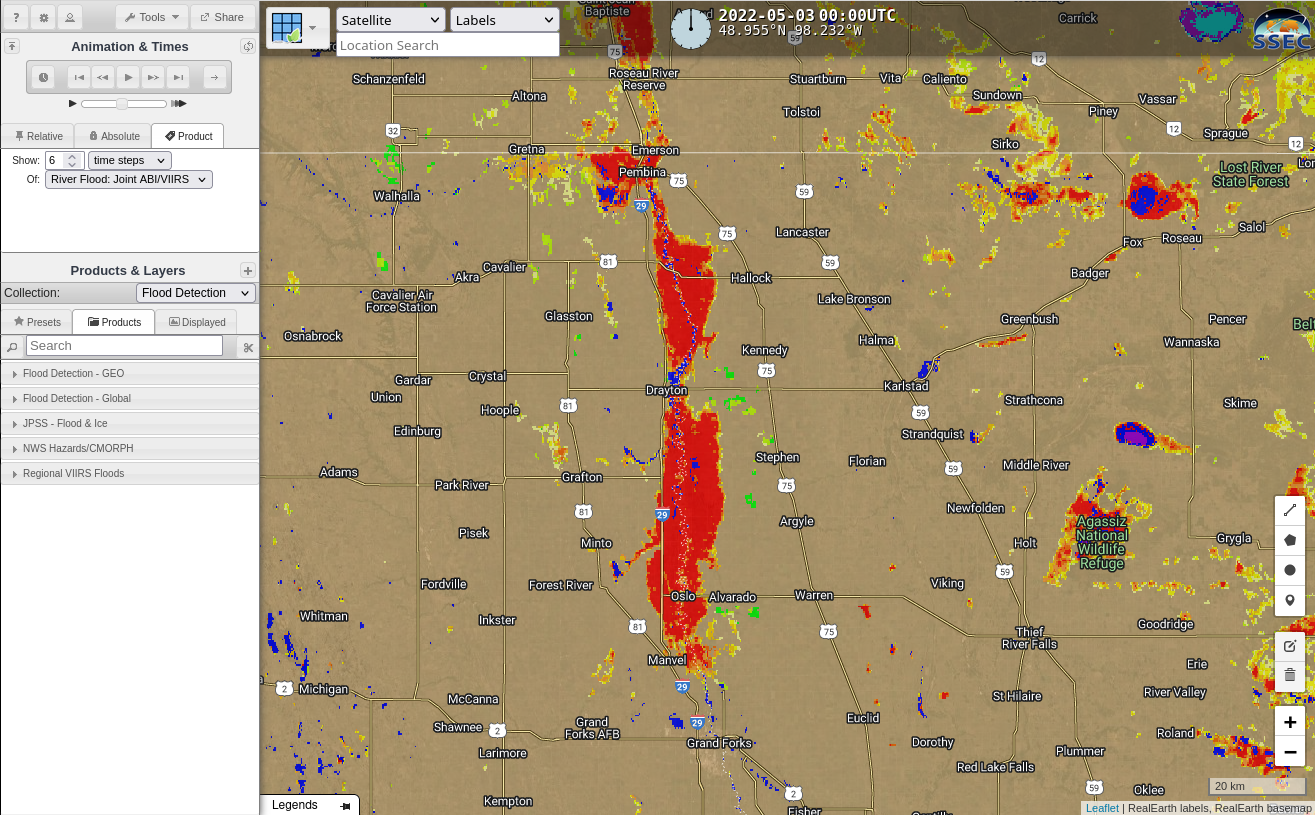
Flooding has been detected by satellite along the Red River of the North for more than a week (see this blog post from late April). The image above shows the Flood Estimates (from this website). The image below (courtesy William Straka, CIMSS) shows a high-resolution downscaled Flood-water depth map derived from VIIRS imagery only.An interesting aspect of... Read More
Inundation detected by ABI and VIIRS imagery, 0000 UTC on 3 May 2022 (Click to enlarge)
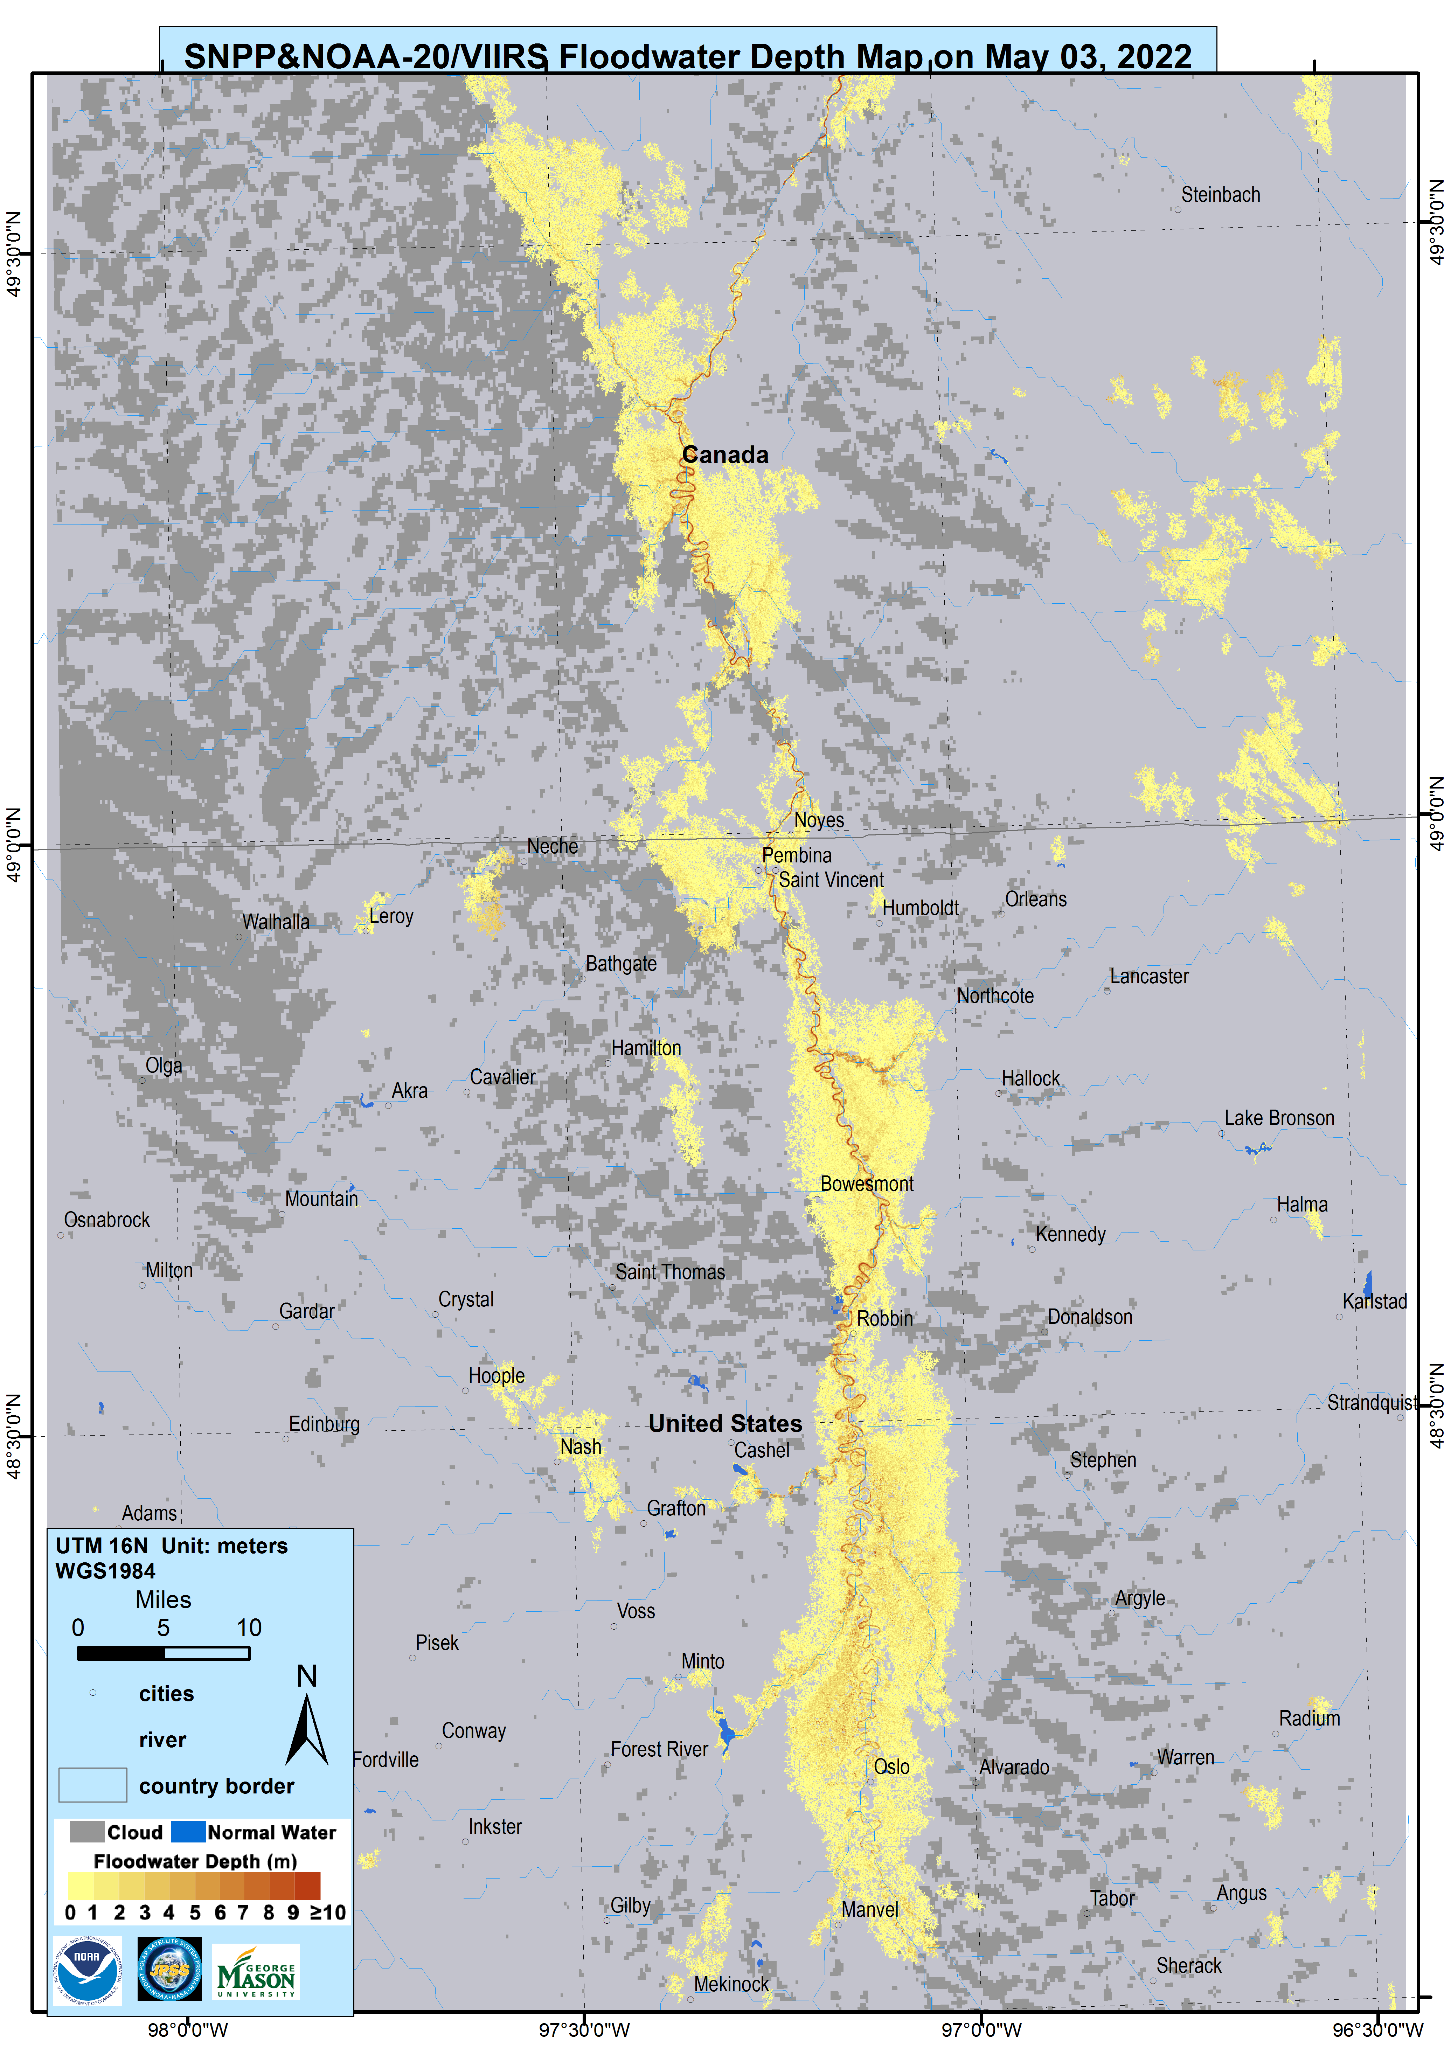
Flooding has been detected by satellite along the Red River of the North for more than a week (see this blog post from late April). The image above shows the Flood Estimates (from this website). The image below (courtesy William Straka, CIMSS) shows a high-resolution downscaled Flood-water depth map derived from VIIRS imagery only.
Derived Flood Depth, 3 May 2022, from Suomi-NPP and NOAA-20 VIIRS imagery (Click to enlarge)
An interesting aspect of this flooded land is that it affecting the boundary layer of the atmosphere, as shown below. Band 2 imagery (0.64 µm) shows lake breeze clouds developing around the lake; the Band 3 imagery (0.87 µm), farther below, better articulates the location of the land/water boundary. Dryer air moving in later in the day leads to dissipation of the clouds.
GOES-16 Band 2 Visible (0.64 µm) imagery, 1501 – 2201 UTC on 3 May 2022 (Click to enlarge)GOES-16 Band 3 Near-Infrared (0.87 µm) imagery, 1501 – 2201 UTC on 3 May 2022 (Click to enlarge)
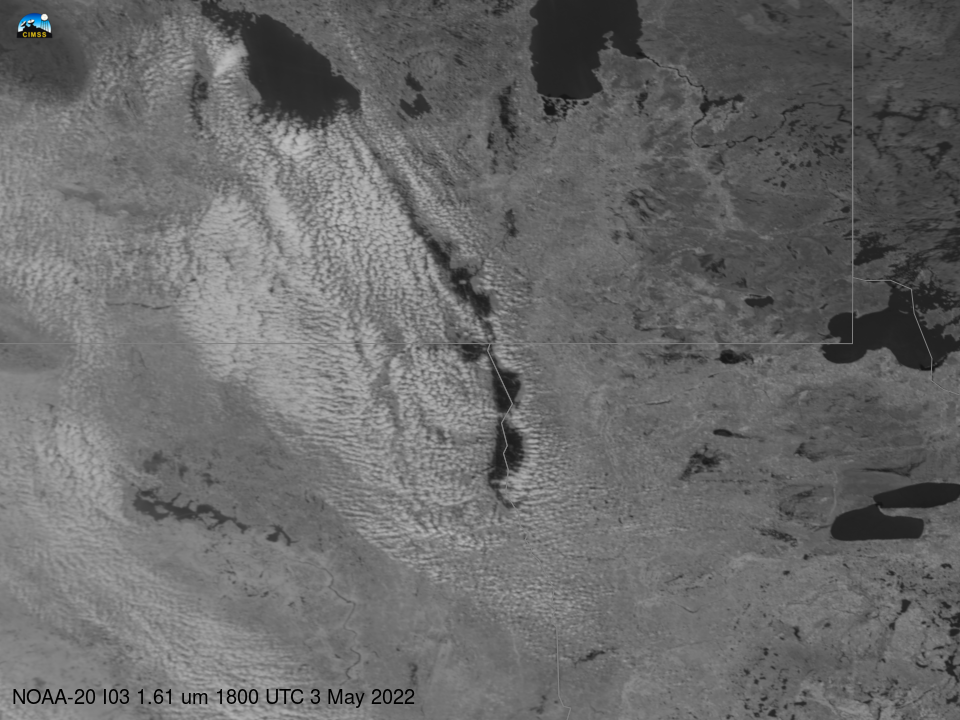
NOAA-20 overflew this region at around 1800 UTC on 3 May 2022. The toggle below (using imagery taken from the CIMSS Direct Broadcast site for NOAA-20 located here), shows VIIRS Bands I01 through I04 (0.64 µm, 0.86 µm, 1.61 µm and 3.74 µm) at that time. The lake-breeze clouds are very apparent, and the cold waters of the lake are also obvious in the I04 imagery.
NOAA-20 VIIRS imagery, I01 (0.64 µm), I02 (0.86 µm), I03 (1.61 µm) and I04 (3.74 µm), at 1800 UTC on 3 May 2022 (Click to enlarge)
Thanks to Carl Jones, WFO FGF, for drawing attention to the lake breezes!
RealEarth recently added Full Disk versions of IFR Probability and Low IFR Probability products for both GOES East (GOES-16) and GOES West (GOES-17). The animation above shows the simple way to display them: go to the RealEarth site (link), and enter ‘IFR Probability’ into the Search Tool, then drag the... Read More
RealEarth front page, Search box highlighted, then filled with ‘IFR Probability’, and GOES-West IFR Probability at 1250 UTC on 3 May 2022 (Click to enlarge)
RealEarth recently added Full Disk versions of IFR Probability and Low IFR Probability products for both GOES East (GOES-16) and GOES West (GOES-17). The animation above shows the simple way to display them: go to the RealEarth site (link), and enter ‘IFR Probability’ into the Search Tool, then drag the GOES-16 or GOES-17 thumbnail onto the globe. GOES-16 and GOES-17 Full Disk imagery typically has a 10-minute cadence. Did you notice in the GOES-17 Full Disk image the signal over the big island of Hawai’i? That’s also shown below, toggling with the GOES-17 ‘Clean Window’ Infrared (10.3 µm) Band 13 image. IFR Probability is highest along the slopes of Hawai’i’s volcanoes; IFR Probability computation does have knowledge of terrain height.
GOES-17 IFR Probability and GOES-17 Band 13 (10.3 µm) imagery, 1250 UTC on 3 May 2022 (Click to enlarge)
CSPP Geosphere is a GOES-16 visualization website that uses Cloud Computing (and CSPPGeo software) to create imagery. The animation above shows the Night Microphysics RGB over the central United States starting at 0856 UTC and extending 12 frames (as noted in the saved mp4 filename). The animation above uses a more accurate... Read More
Twelve frames of GOES-16 Night Microphysics starting at 0851 UTC on 2 May 2022
CSPP Geosphere is a GOES-16 visualization website that uses Cloud Computing (and CSPPGeo software) to create imagery. The animation above shows the Night Microphysics RGB over the central United States starting at 0856 UTC and extending 12 frames (as noted in the saved mp4 filename). The animation above uses a more accurate definition of the Night Microphysics RGB; you can tell the difference in temperature in the low clouds between the cold stratus (yellow enhancement) over the Midwest and the warmer clouds (closer to blue/cyan) over the southern Plains and over North Carolina. Note that there are also low clouds over Alabama under the high clouds; perhaps IFR Probability fields (available in RealEarth) over that state are a more logical choice to define low clouds there.
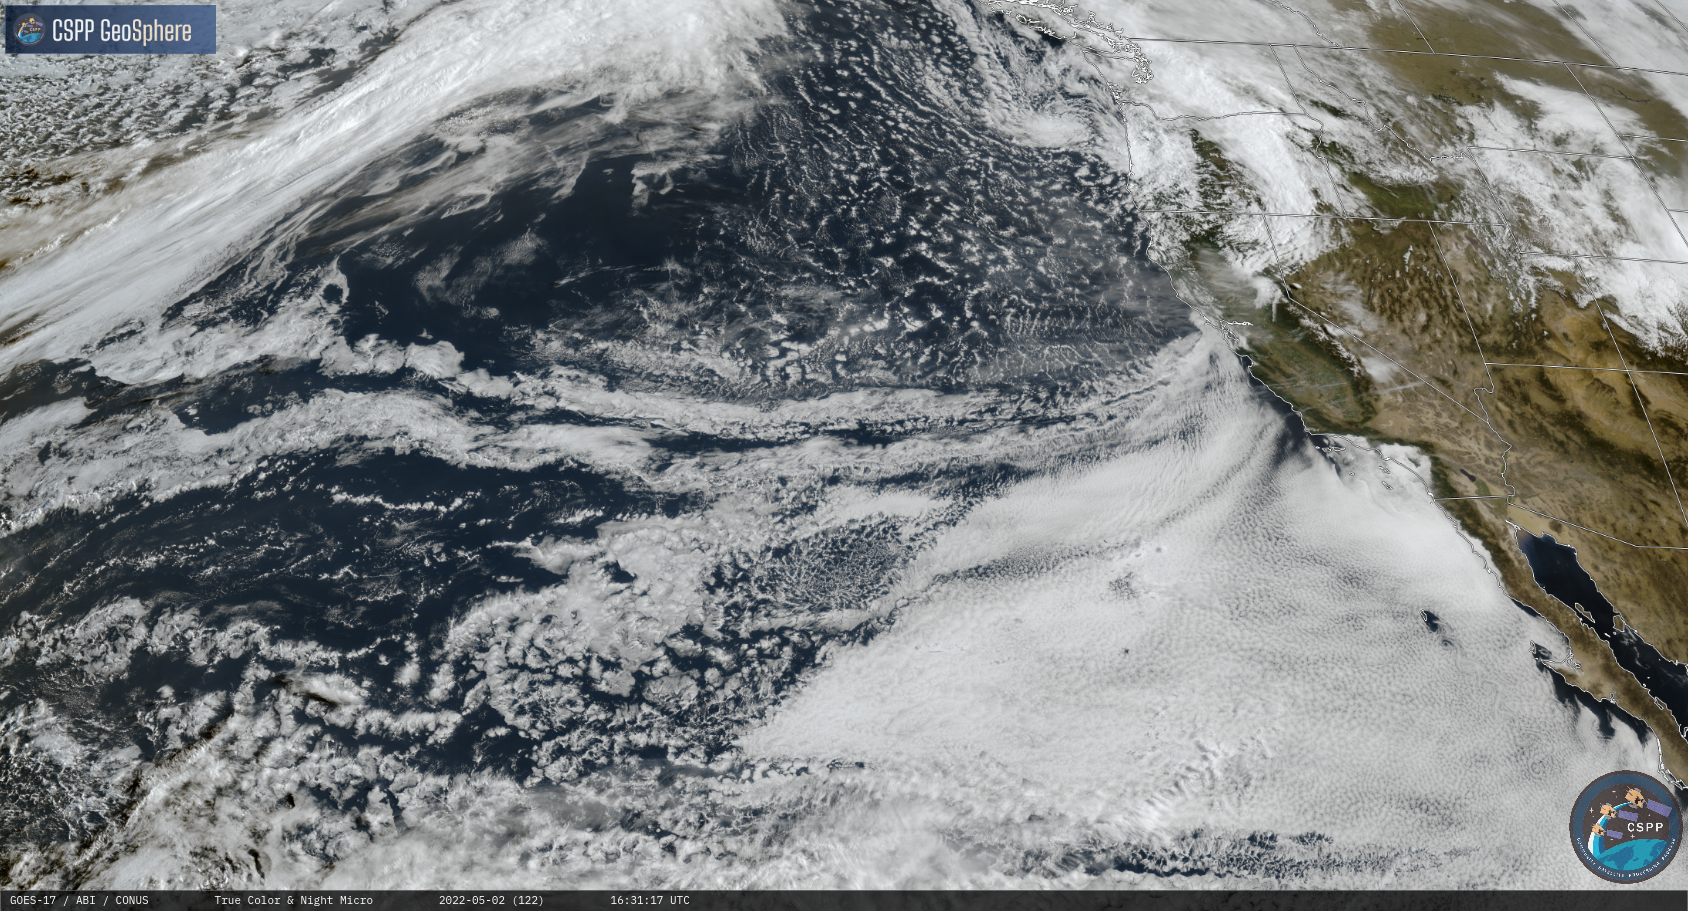
The new CSPP Geosphere site — being tested now at CIMSS — includes GOES-17 data (and will include GOES-18 data when available, as GOES-18 support is currently being added to CSPP Geo software). Thus, one can create imagery over the Pacific Ocean including Hawaii.
Twelve frames of GOES-17 True Color and Night Microphysics in the PACUS domain, starting at 0351 UTC on 2 May 2022
The new Geosphere site should be available in Summer 2022.