Ongoing flooding along the Red River of the North
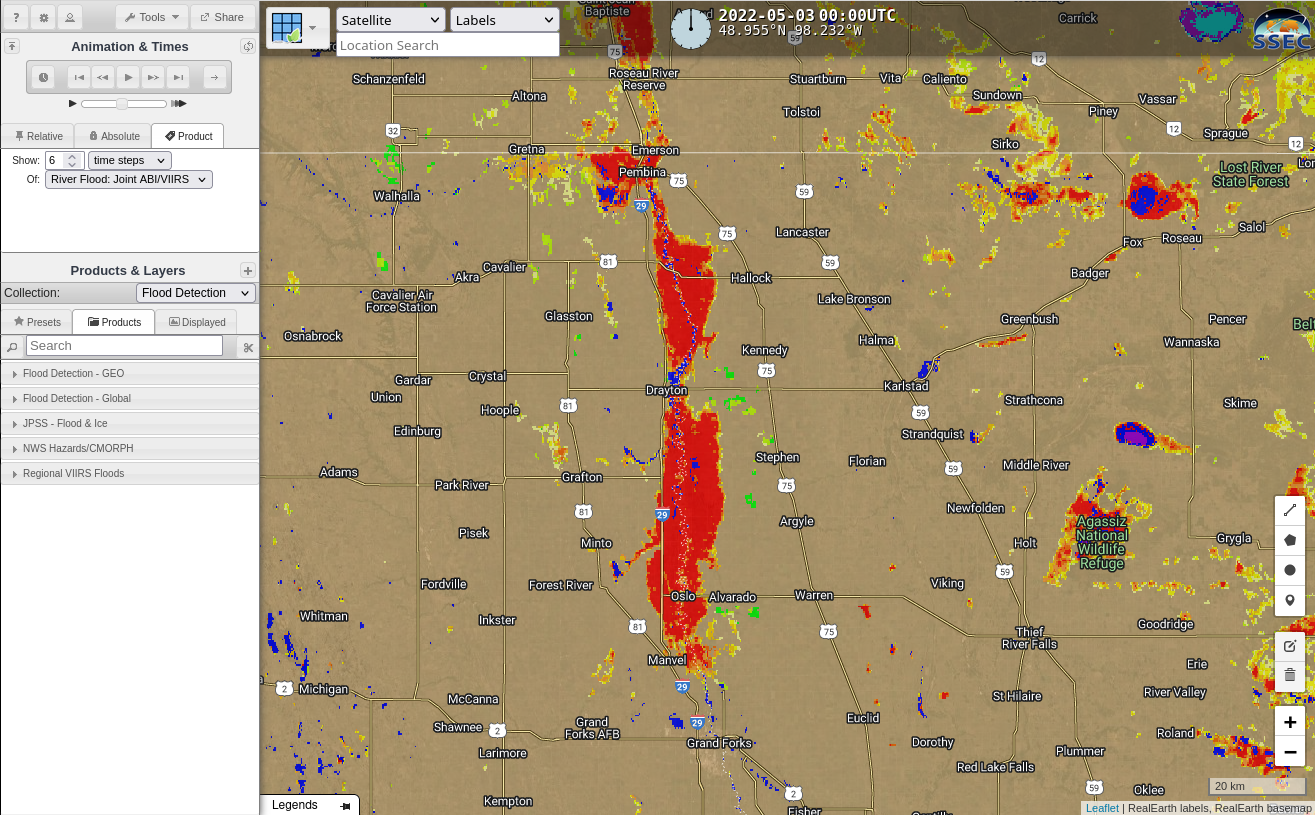
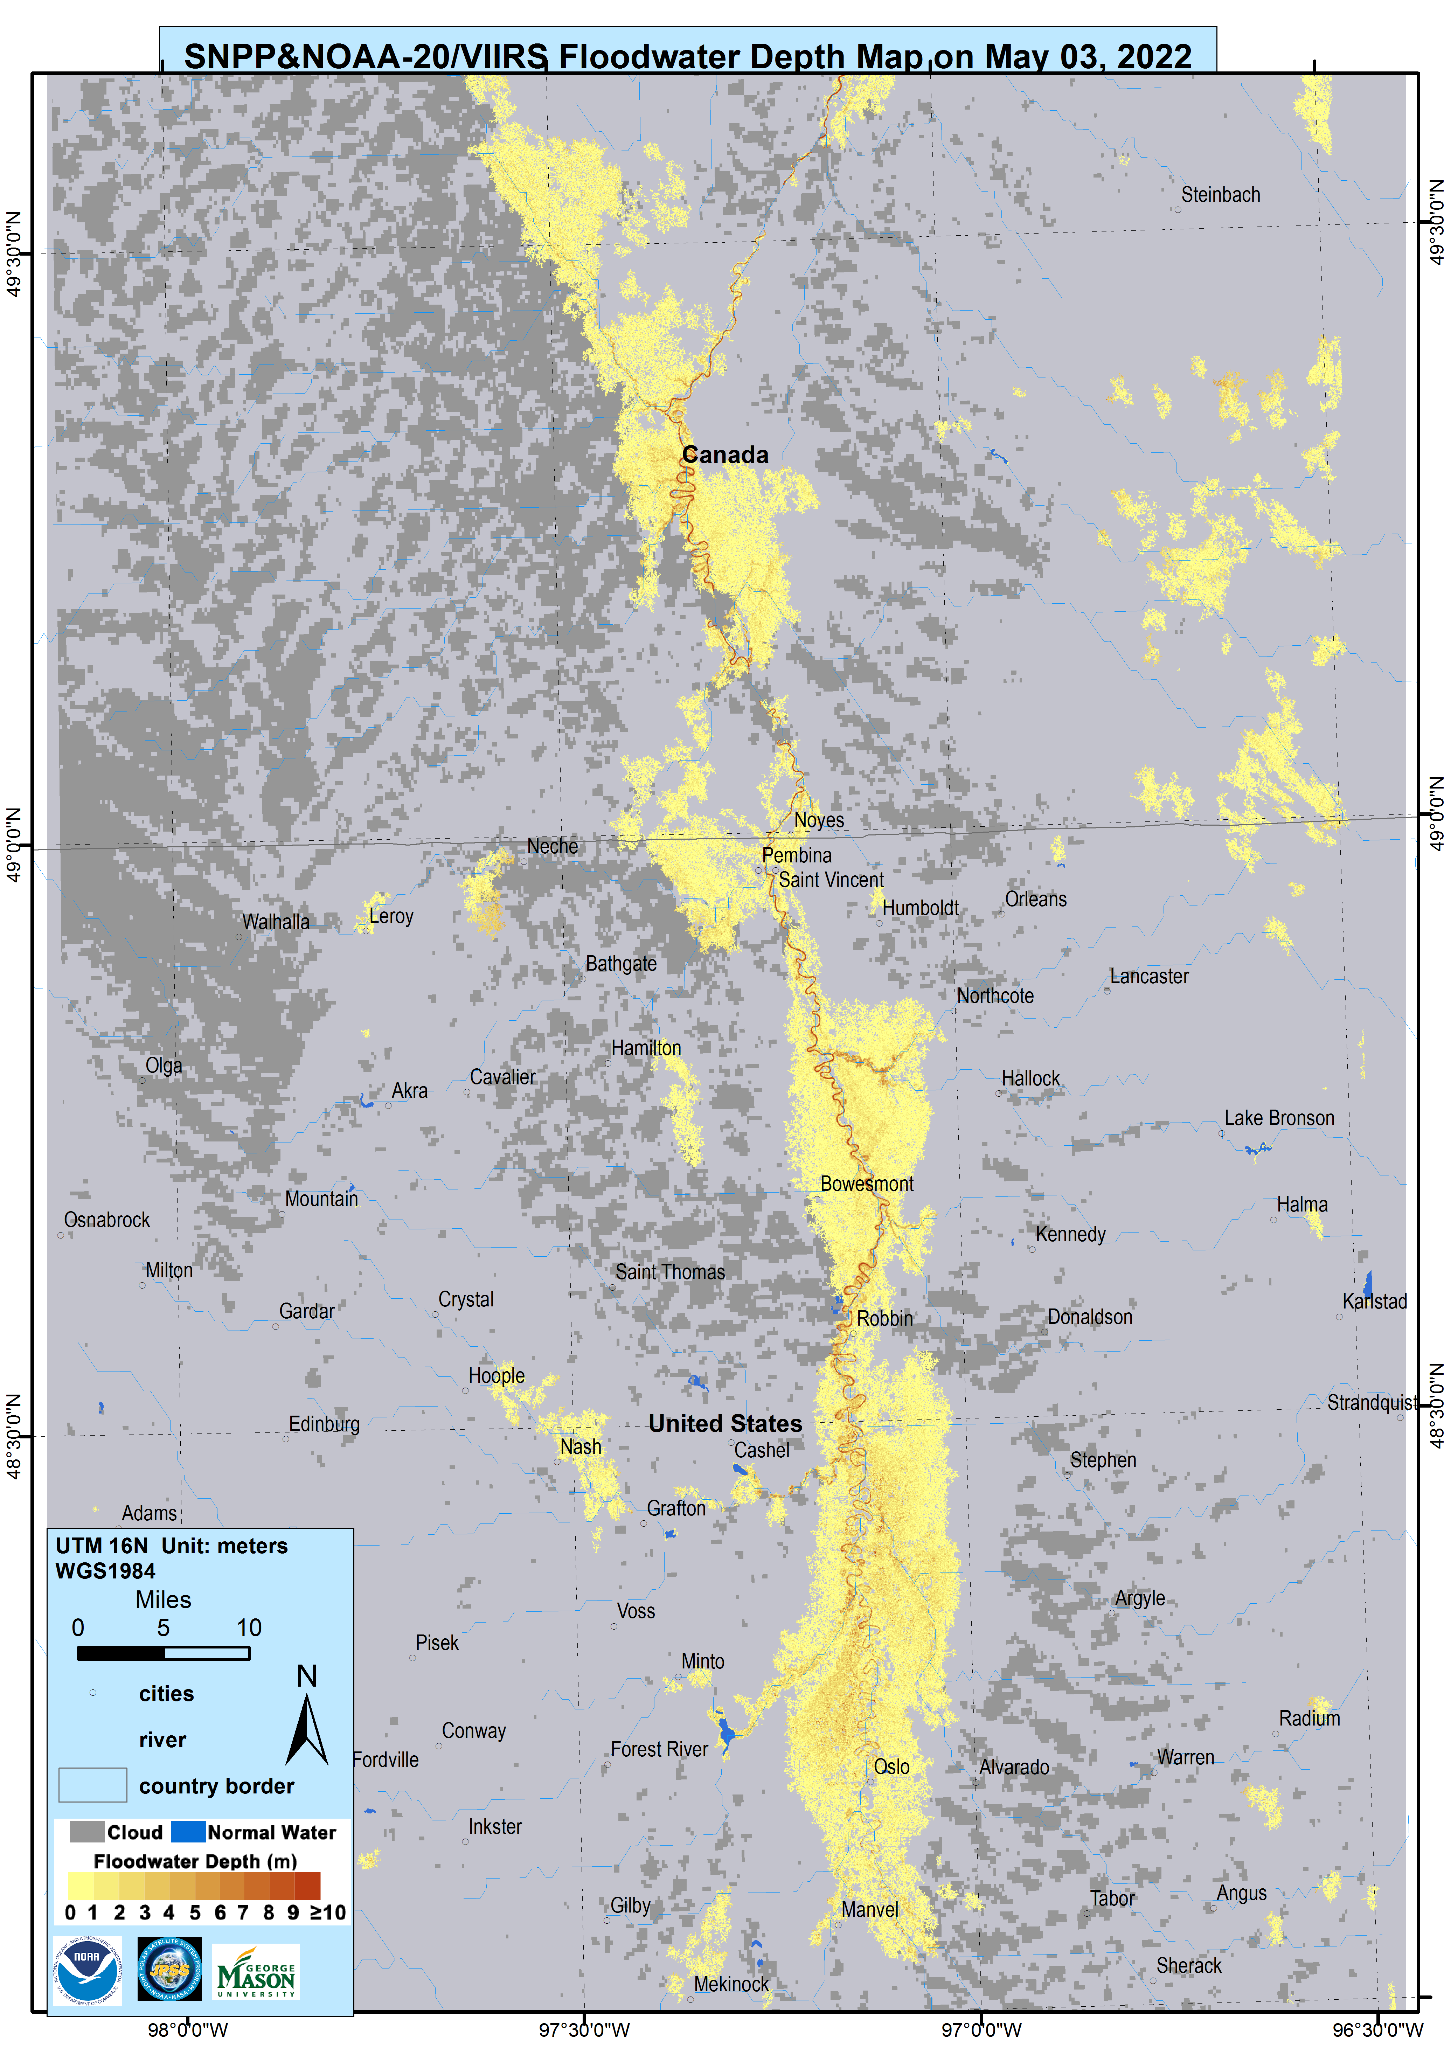
Flooding has been detected by satellite along the Red River of the North for more than a week (see this blog post from late April). The image above shows the Flood Estimates (from this website). The image below (courtesy William Straka, CIMSS) shows a high-resolution downscaled Flood-water depth map derived from VIIRS imagery only.
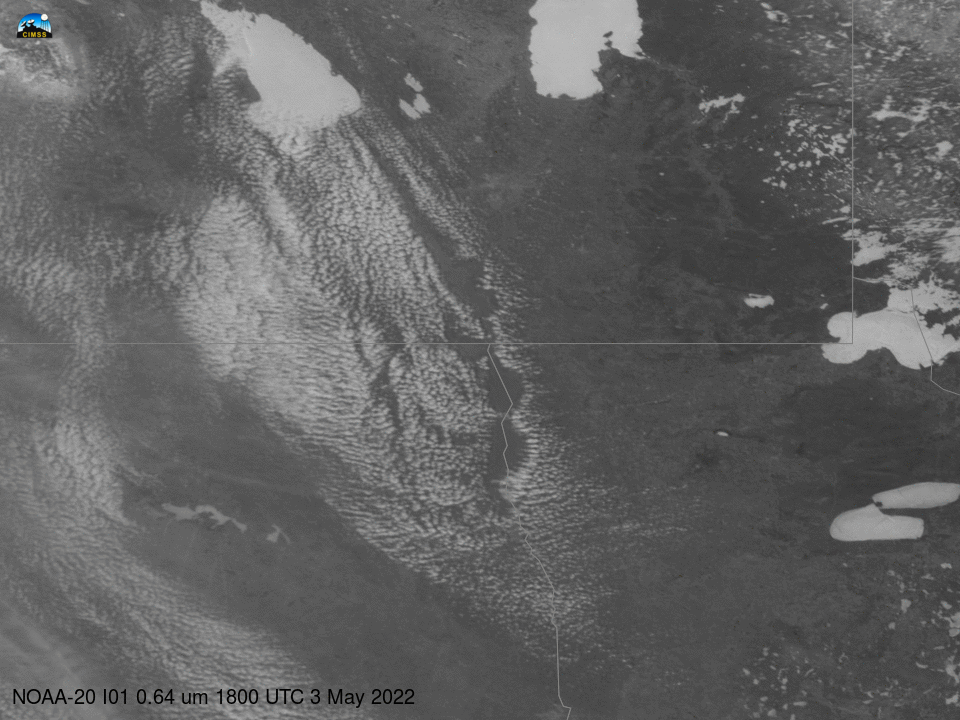
An interesting aspect of this flooded land is that it affecting the boundary layer of the atmosphere, as shown below. Band 2 imagery (0.64 µm) shows lake breeze clouds developing around the lake; the Band 3 imagery (0.87 µm), farther below, better articulates the location of the land/water boundary. Dryer air moving in later in the day leads to dissipation of the clouds.
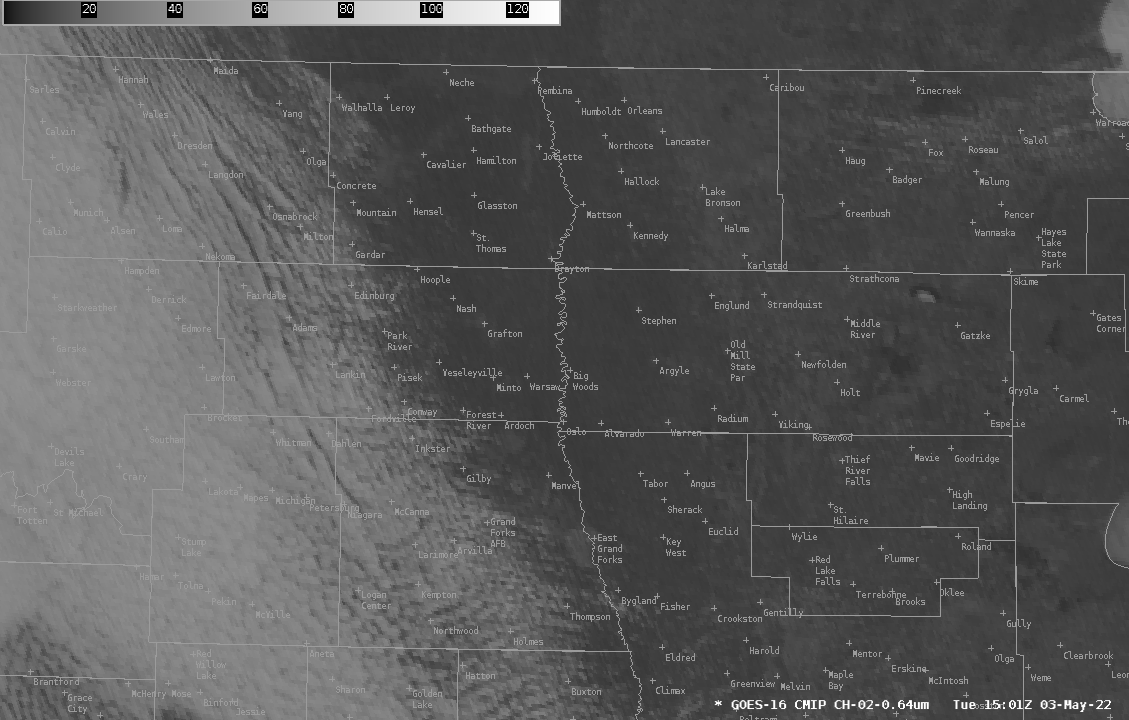
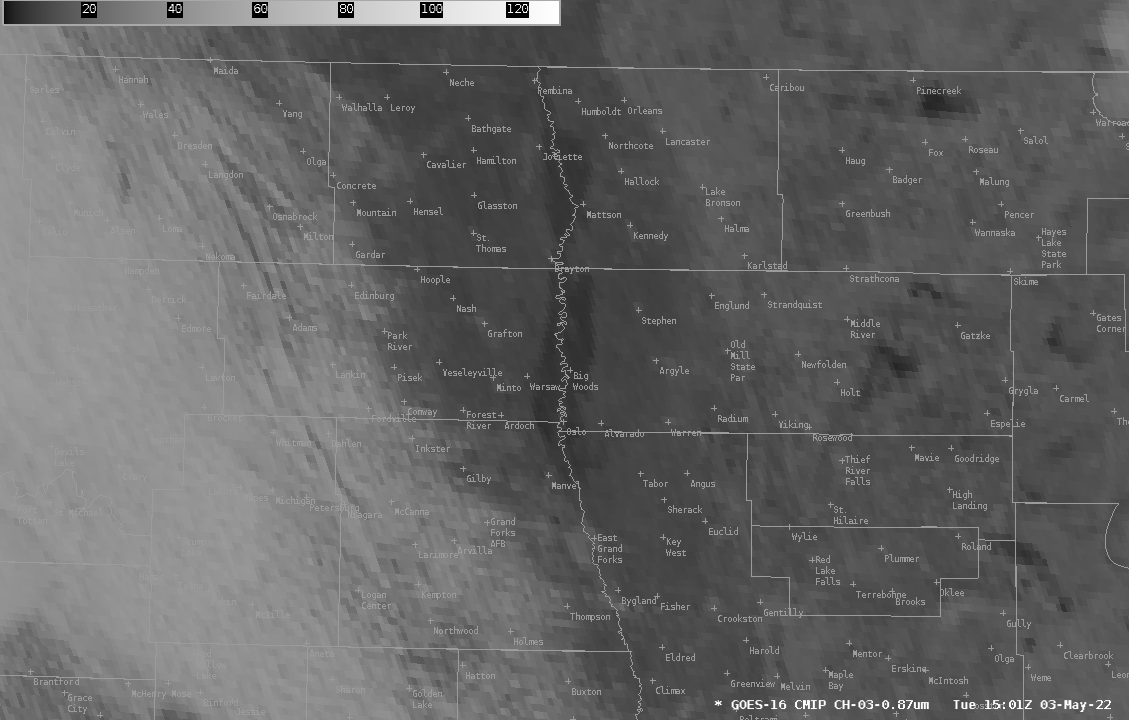
NOAA-20 overflew this region at around 1800 UTC on 3 May 2022. The toggle below (using imagery taken from the CIMSS Direct Broadcast site for NOAA-20 located here), shows VIIRS Bands I01 through I04 (0.64 µm, 0.86 µm, 1.61 µm and 3.74 µm) at that time. The lake-breeze clouds are very apparent, and the cold waters of the lake are also obvious in the I04 imagery.
Thanks to Carl Jones, WFO FGF, for drawing attention to the lake breezes!