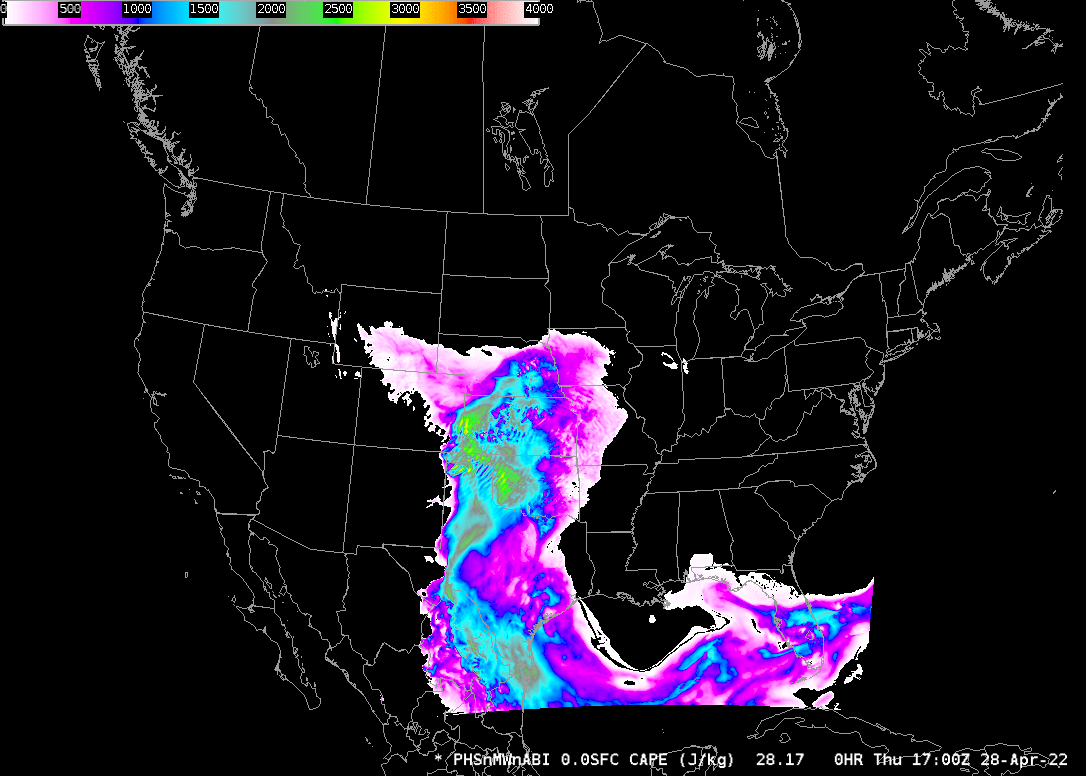
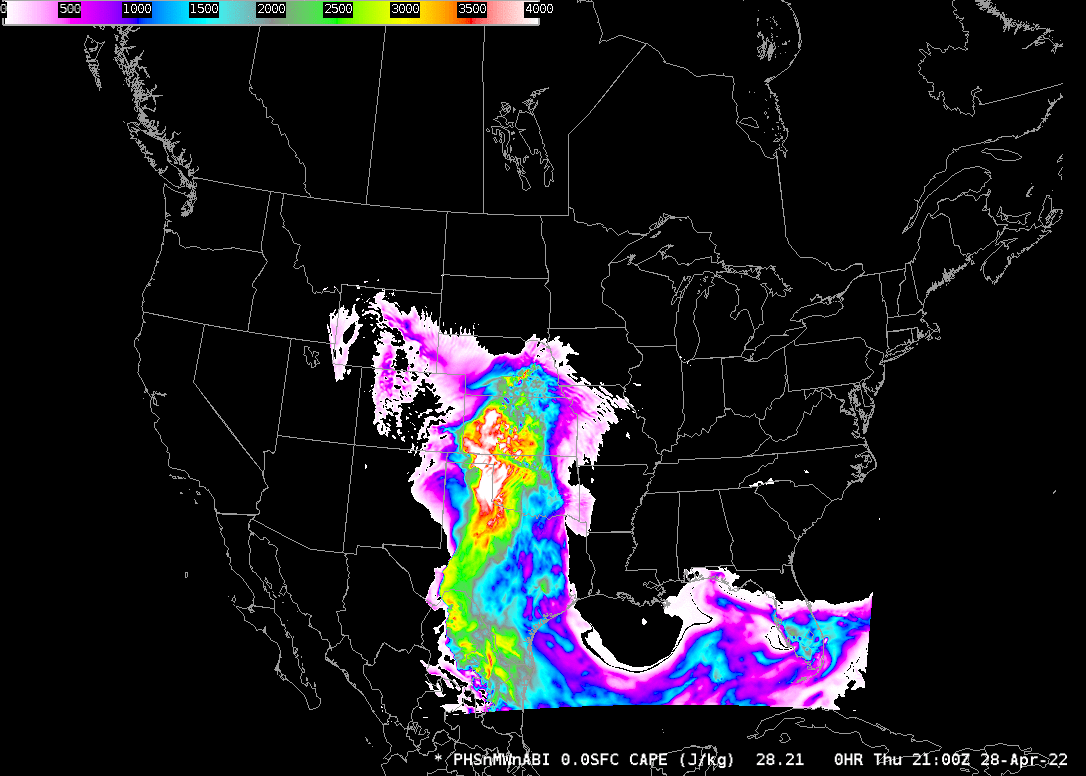
On 28 April, SPC’s convective outlook showed a small region of SLGT RSK over western Nebraska, with Marginal probabilities over most of Nebraska and Kansas (link to 2000 UTC outlook). The animation above shows hourly CAPE predictions from a 3-km version of the Rapid Refresh that is run hourly and initialized with Polar Hyperspectral Data (infrared and microwave, from Metop and from Suomi-NPP and NOAA-20) fused with GOES-16 ABI data, thereby using the strengths of ABI (fine spatial and temporal resolution) and Polar Hyperspectral Soundings (excellent spectral resolution). The animation above (a mix of initial fields — 1700 – 1900 UTC ; 1 – 4h forecasts from 1900 UTC; and 6-9h forecasts from 1800 UTC) shows CAPE developing over the High Plains and then rotating north into Kansas by 0300 UTC on 29 April 2022. A later forecast of CAPE, below, runs from 2100 UTC 28 April through 0600 UTC 29 April (showing initial fields at 2100/2200 UTC, then forecasts from 2200 UTC at 2300 UTC through 0400 UTC [i.e., 1-6h forecasts], followed by 8h and 9h forecasts from 2100 UTC on 0500 and 0600 UTC). By 0600 UTC, an axis of instability stretches from western Nebraska southeastward into central Kansas. The two forecasts show similar patterns.
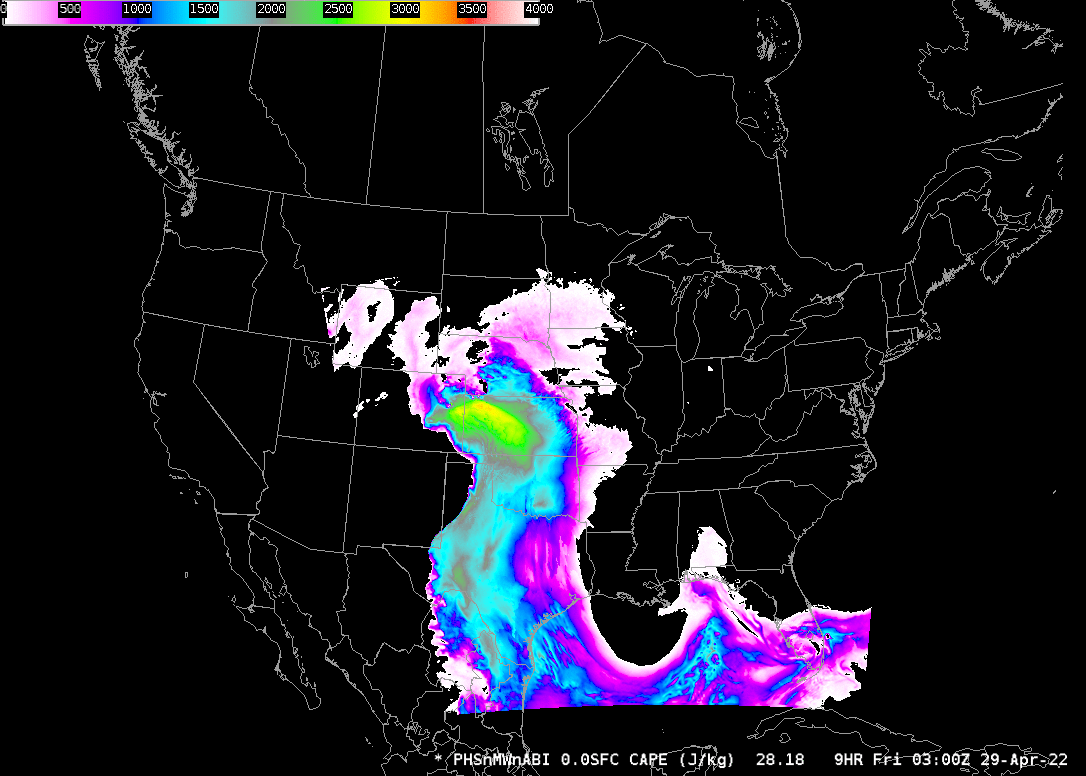
The toggle below compares two forecasts for 0300 UTC, a 9-h forecast from 1800 UTC on 28 April, and a 5-h forecast from 2200 UTC on 28 April. The 5-h forecast is a bit less quick in moving the high CAPE values northward.
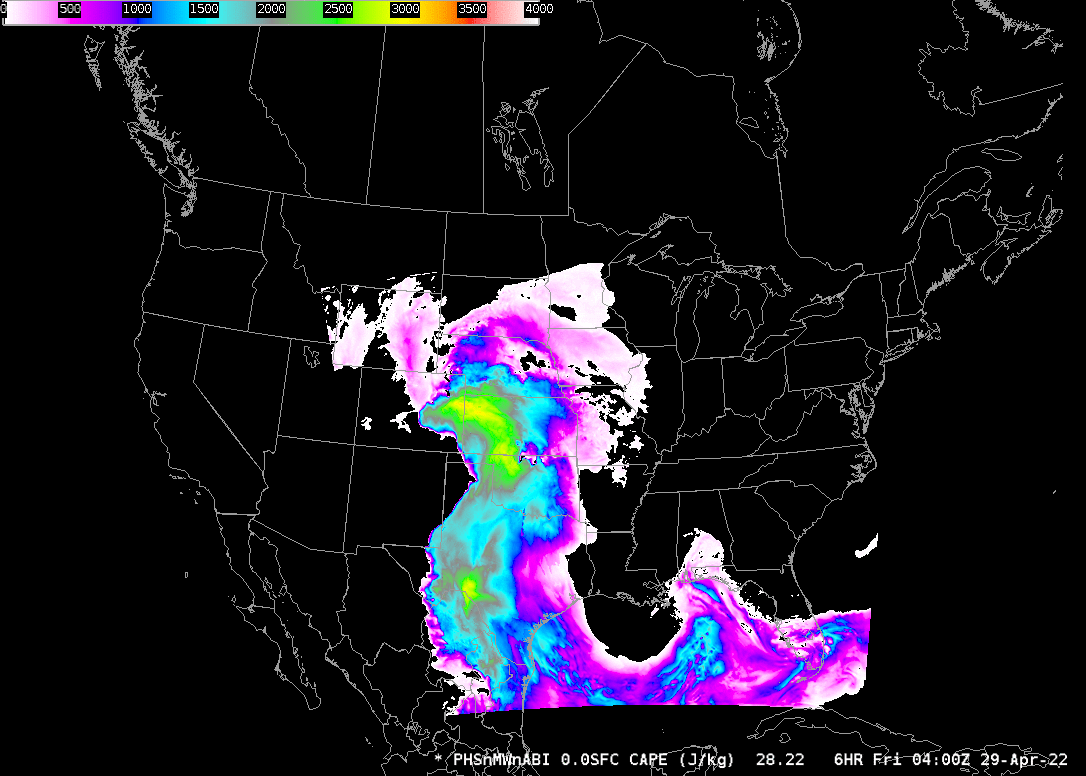
So, what happened? The toggle below compares the 6-h forecast from 2200 UTC, valid at 0400 UTC on 29 April, with the initial field for the 0400 UTC model run. As above, it appears that the forecast model from 2200 UTC was a bit too fast in moving the CAPE northward and eastward into Kansas/Nebraska. But overall there is very good agreement between the two fields.
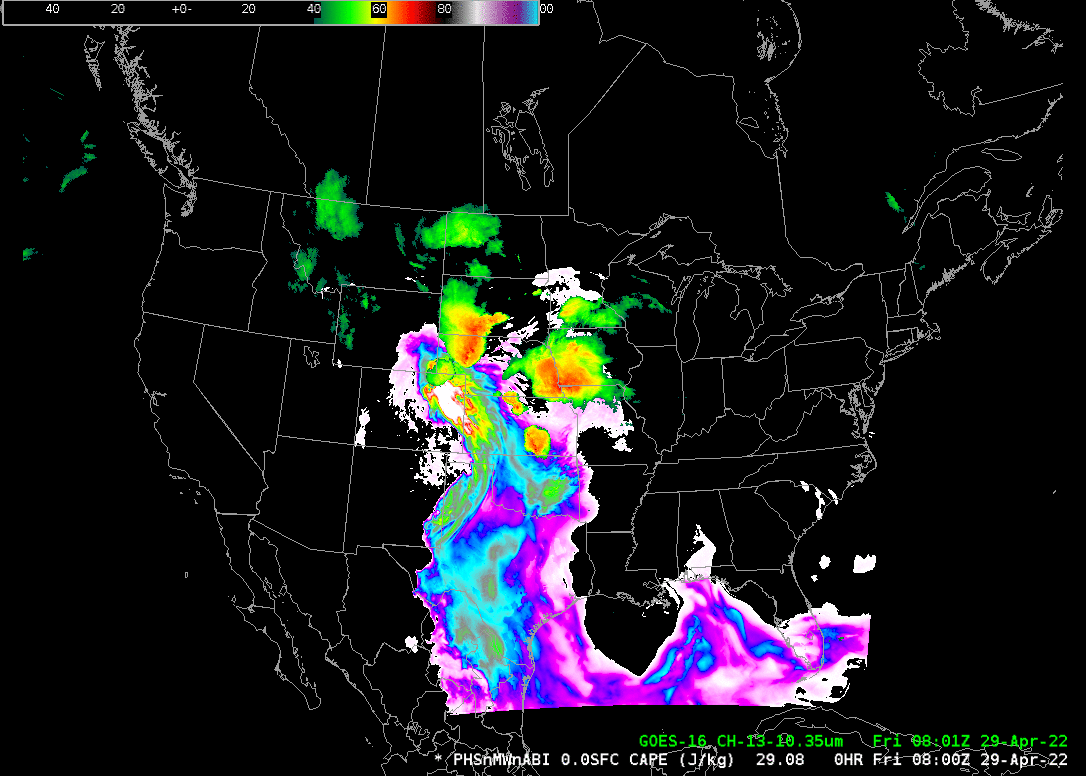
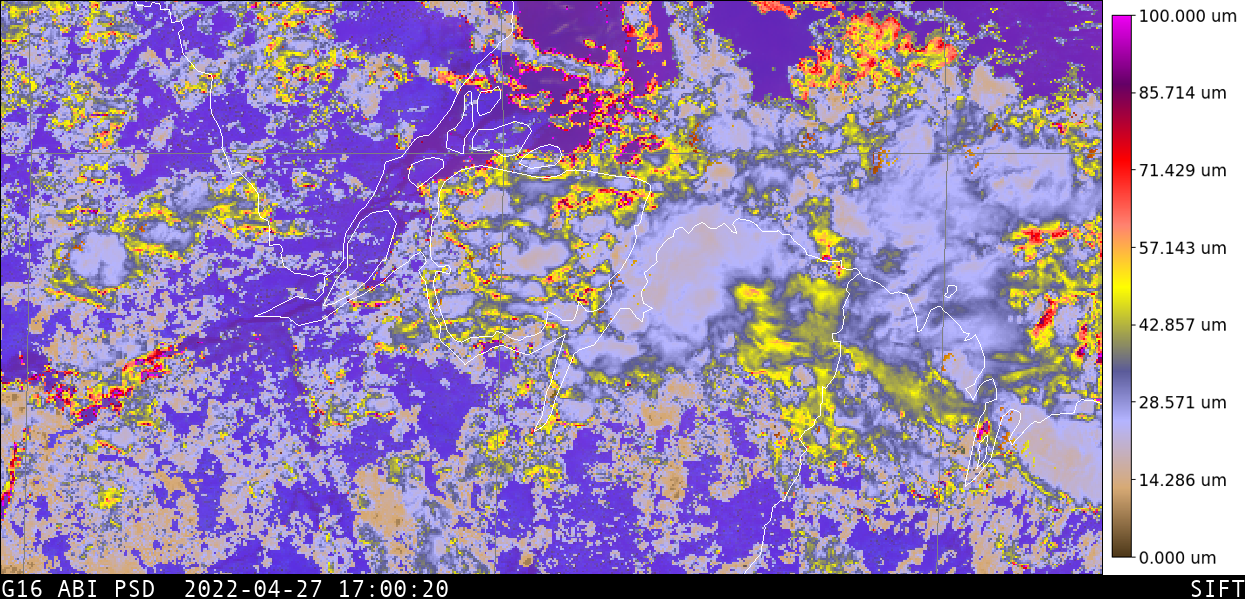
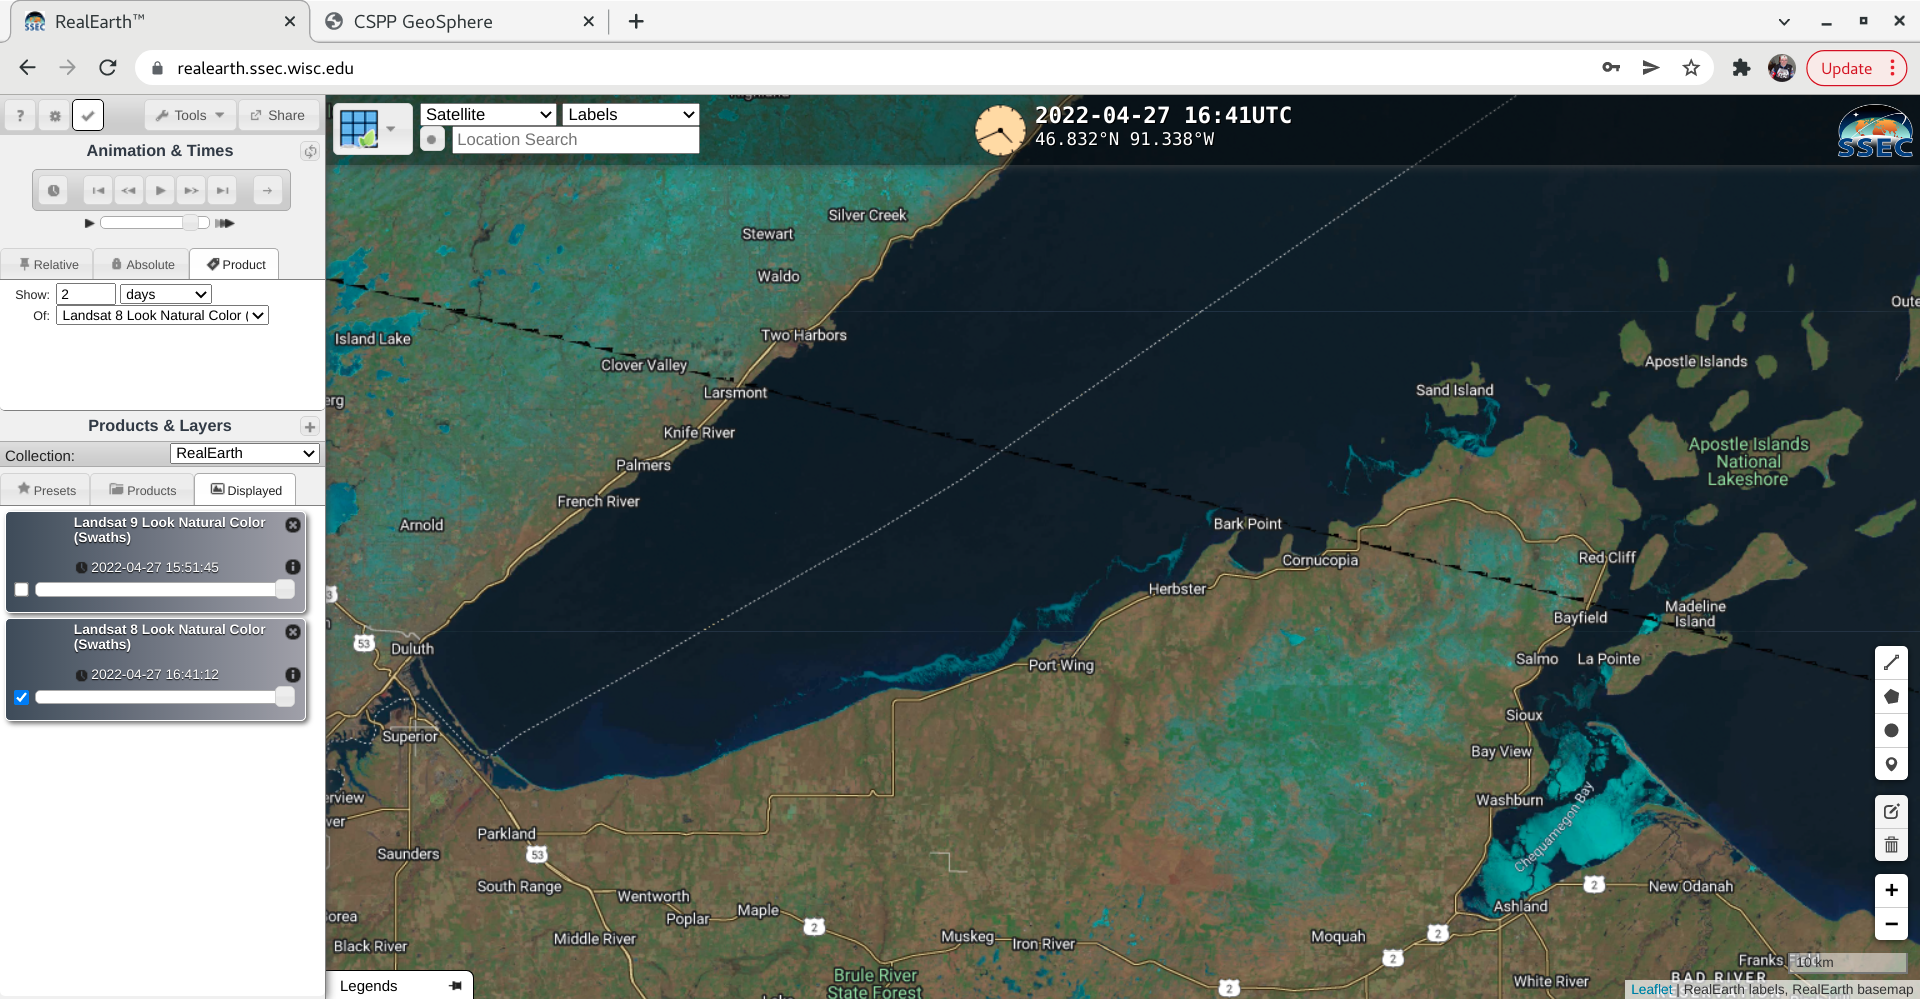
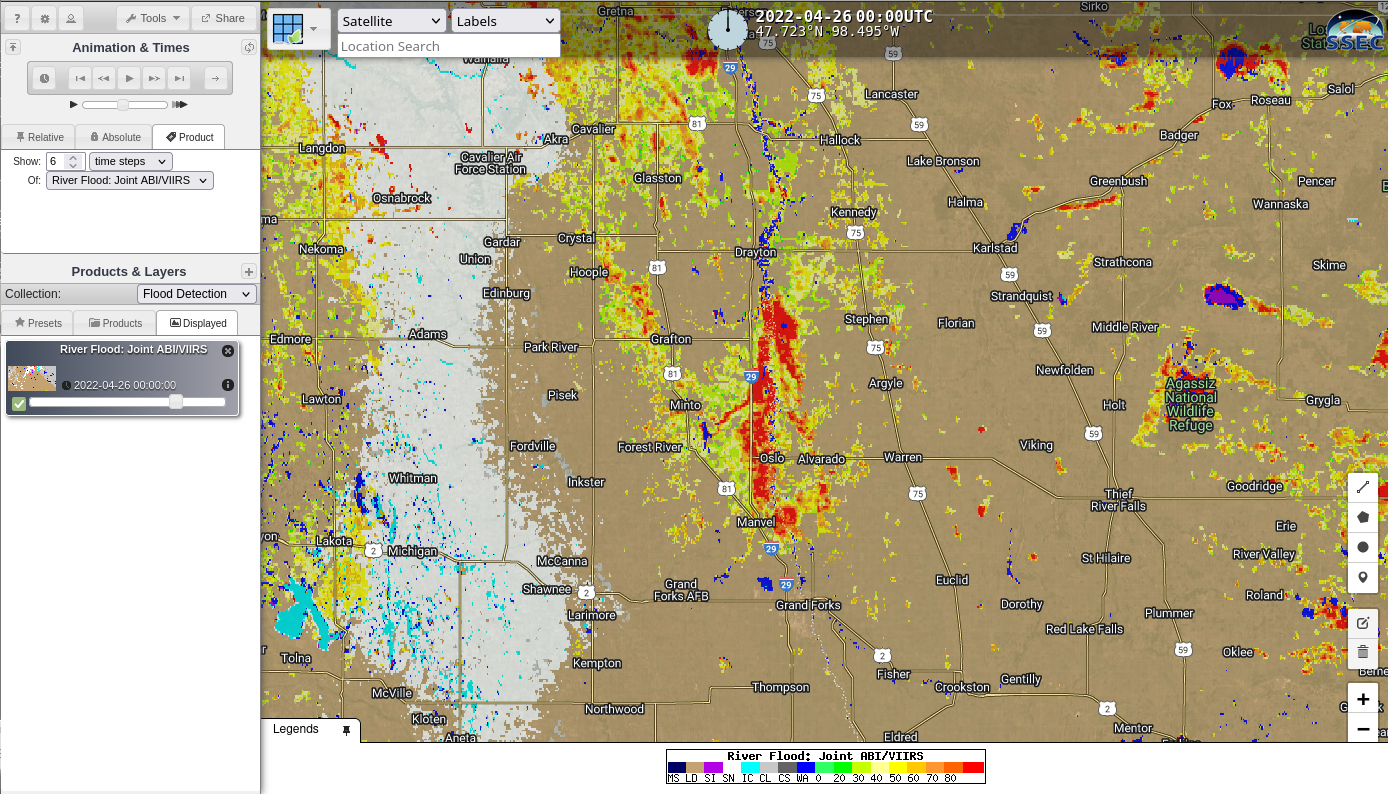
The animation below shows PHSnABI CAPE fields hourly from 0400 – 0700 UTC (initial fields from 0400-0600; 1-h forecast at 0700), side by side with observed GOES-16 ABI Band 13 color-enhanced brightness temperatures. The convection that develops is along the edges of the CAPE; that is, it forms along the CAPE gradient in the model. Click here to view SPC Storm Reports from 28-29 April.
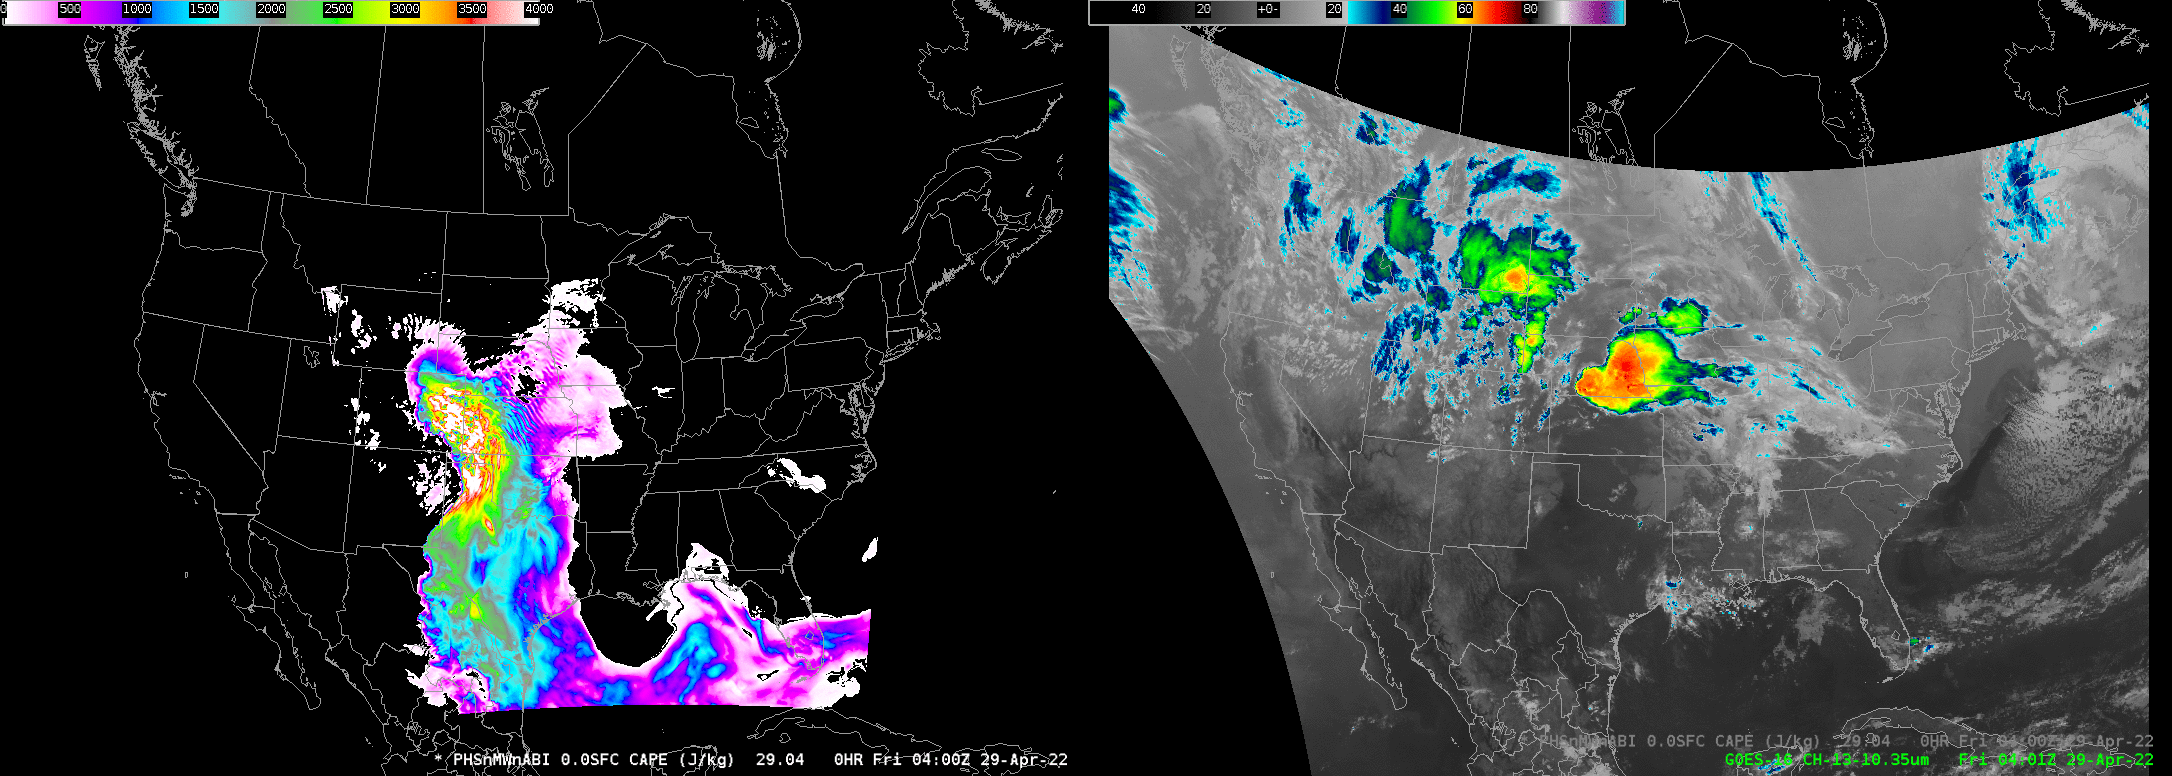
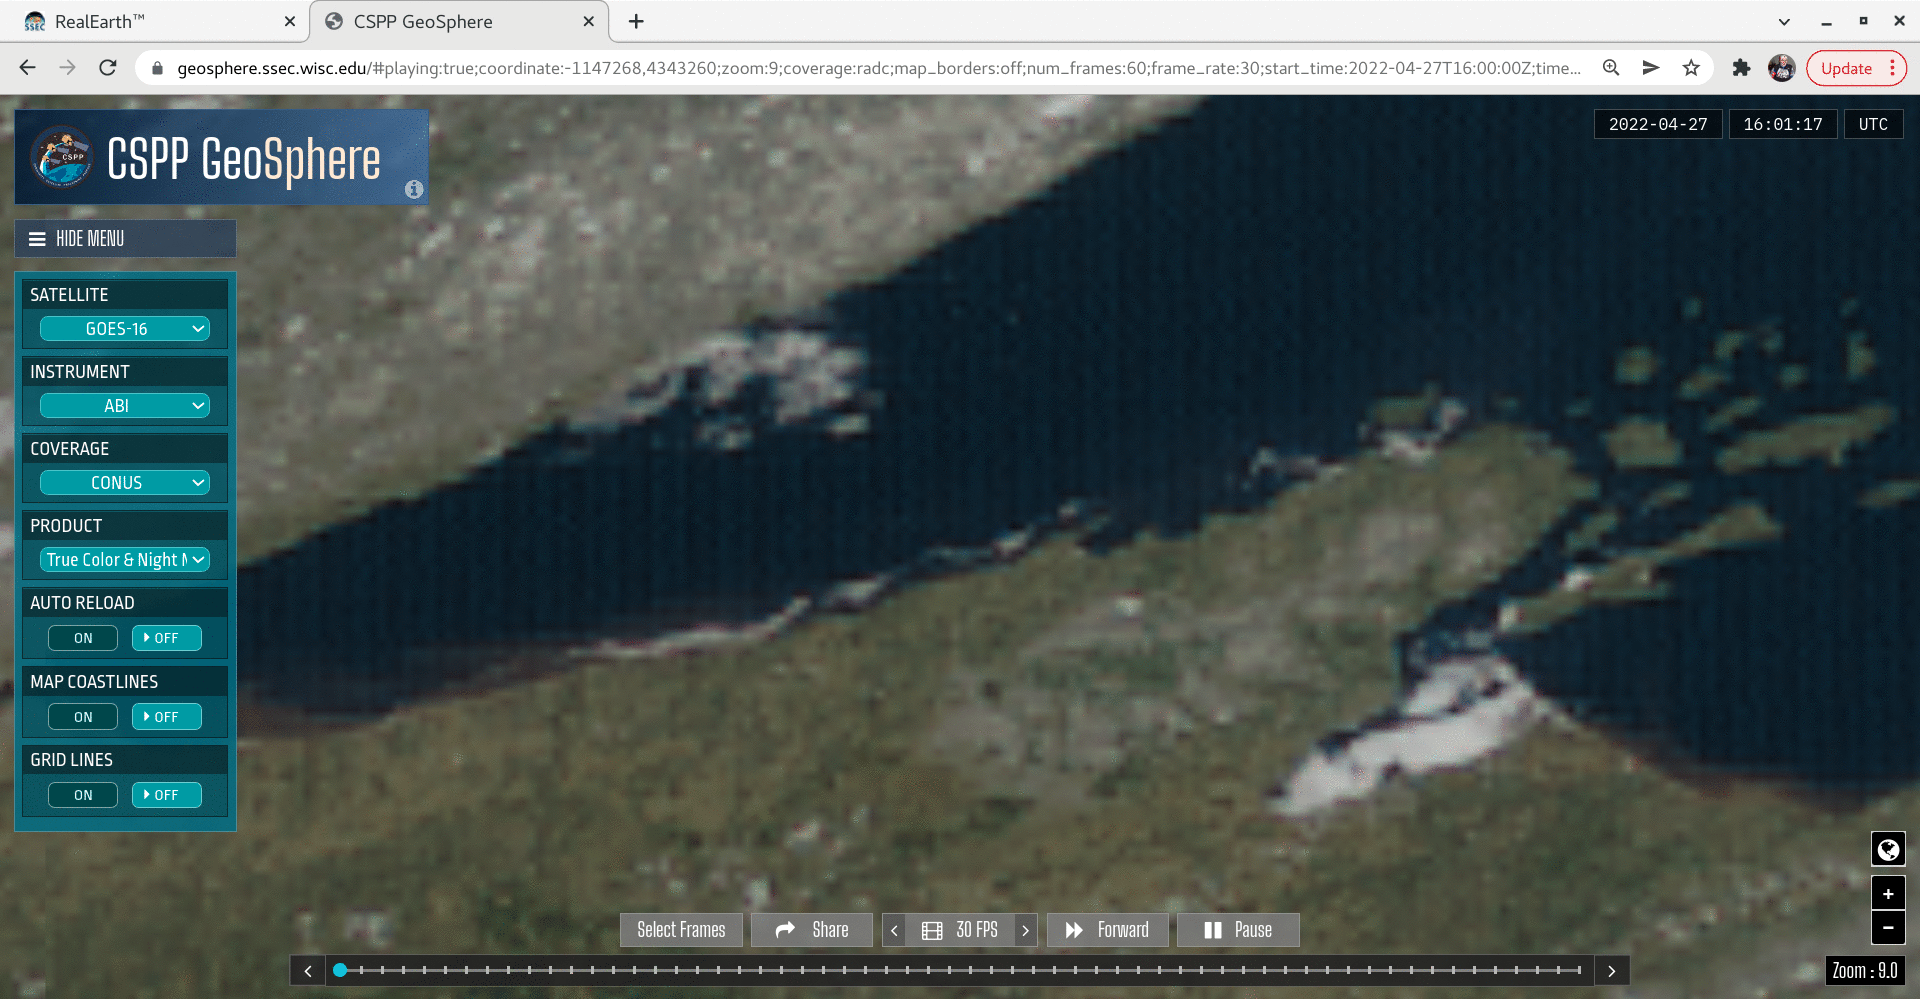
The animation below shows ABI Infrared Imagery overlain on top of the forecast CAPE field. This drives home to point that convection on this day occurred where the gradient of CAPE was outlined/predicted by this forecast model.
PHSnABI data will be demonstrated at the Hazardous Weather Testbed in late May/Early June. Model output is available outside of AWIPS at this website. To view more blog posts on this project, click the ‘Hyperspectral’ tag below.
View only this post Read Less


