This website works best with a newer web browser such as Chrome, Firefox, Safari or Microsoft
Edge. Internet Explorer is not supported by this website.
A 3-panel comparison of 1-minute Mesoscale Domain Sector Shortwave Infrared (3.9 µm) images from GOES-17 (GOES-West), GOES-18 (*preliminary, non-operational*) and GOES-16 (GOES-East) (above) showed the hot thermal anomaly (darker black to red pixels) of the Calf Canyon Fire/Hermits Peak Fire in northern New Mexico on 11 May 2022. The images are displayed in the native projection... Read More
Shortwave Infrared (3.9 µm) images from GOES-17 (left), GOES-18 (center) and GOES-16 (right) [click to play animated GIF | MP4]
A 3-panel comparison of 1-minute Mesoscale Domain Sector Shortwave Infrared (3.9 µm) images from GOES-17 (GOES-West), GOES-18 (*preliminary, non-operational*) and GOES-16 (GOES-East)(above) showed the hot thermal anomaly (darker black to red pixels) of the Calf Canyon Fire/Hermits Peak Fire in northern New Mexico on 11 May 2022. The images are displayed in the native projection of each satellite.
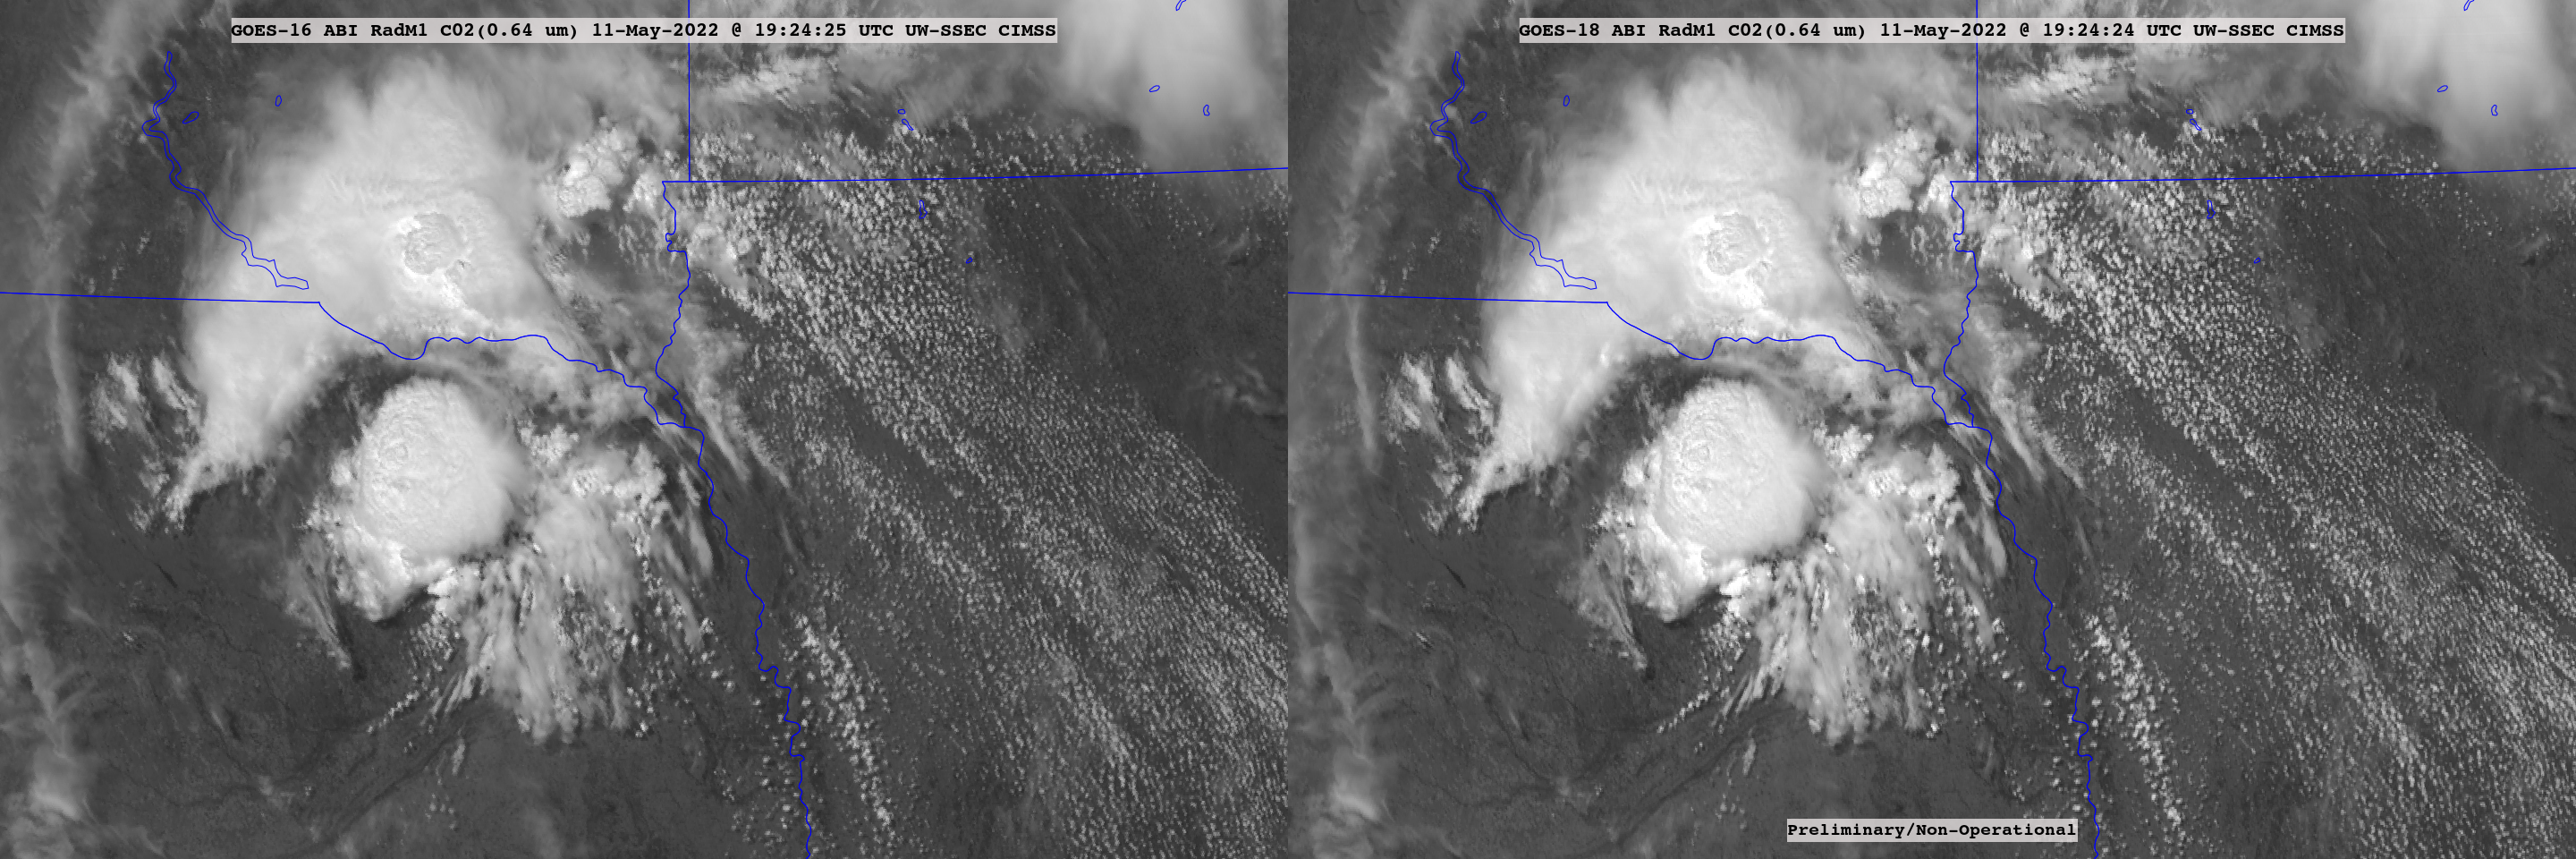
Farther to the west, a similar comparison of Shortwave Infrared images from GOES-17 / GOES-18 / GOES-16 — with a different color enhancement applied — is shown for the Coastal Fire in Southern California.
Shortwave Infrared (3.9 µm) images from GOES-17 (left), GOES-18 (center) and GOES-16 (right) [click to play animated GIF | MP4]
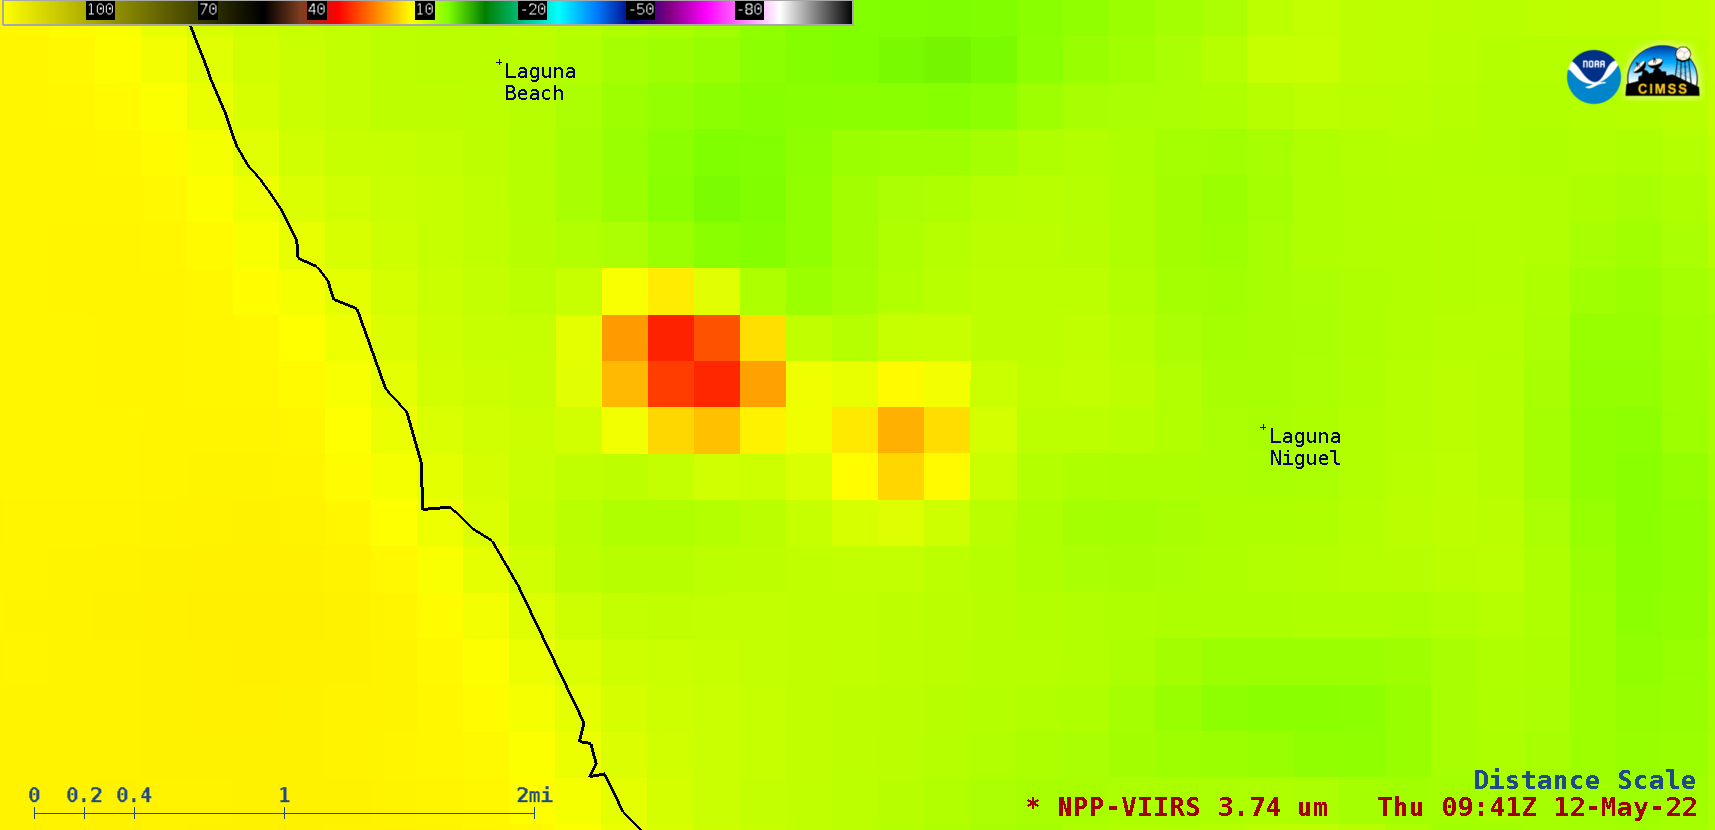
The fire’s thermal signature began to rapidly diminish in GOES imagery by 03 UTC — but a distinct signature was still evident on a 375-meter resolution Suomi-NPP VIIRS Shortwave Infrared (3.74 µm) image at 0941 UTC (below).
Suomi-NPP VIIRS Shortwave Infrared (3.74 µm) image at 0941 UTC [click to enlarge]
GOES-18 data in this post are preliminary and non-operational and beautiful. Because GOES-18 and GOES-16 nadir positions are separated by almost 15o of longitude (89.5o and 75.2o, respectively), they can be used (when remapped to the same projection, in this case using a beta version of geo2grid that supports GOES-18... Read More
GOES-16 and GOES-18 imagery, 1920 – 2350 UTC on 11 May 2022
GOES-18 data in this post are preliminary and non-operational and beautiful. Because GOES-18 and GOES-16 nadir positions are separated by almost 15o of longitude (89.5o and 75.2o, respectively), they can be used (when remapped to the same projection, in this case using a beta version of geo2grid that supports GOES-18 imagery) to create pseudo-stereoscopic imagery. That is, if you cross your eyes when looking at the imagery, and focus on the image that appears in the middle of the two other images, a three-dimensional image can be viewed (Note: Not all human brains can do this). The image above shows convection on 11 May 2022 over Nebraska between 1920 and 2350 UTC.
Thanks to Tim Schmit, NOAA/ASPB, for supplying me with these images!
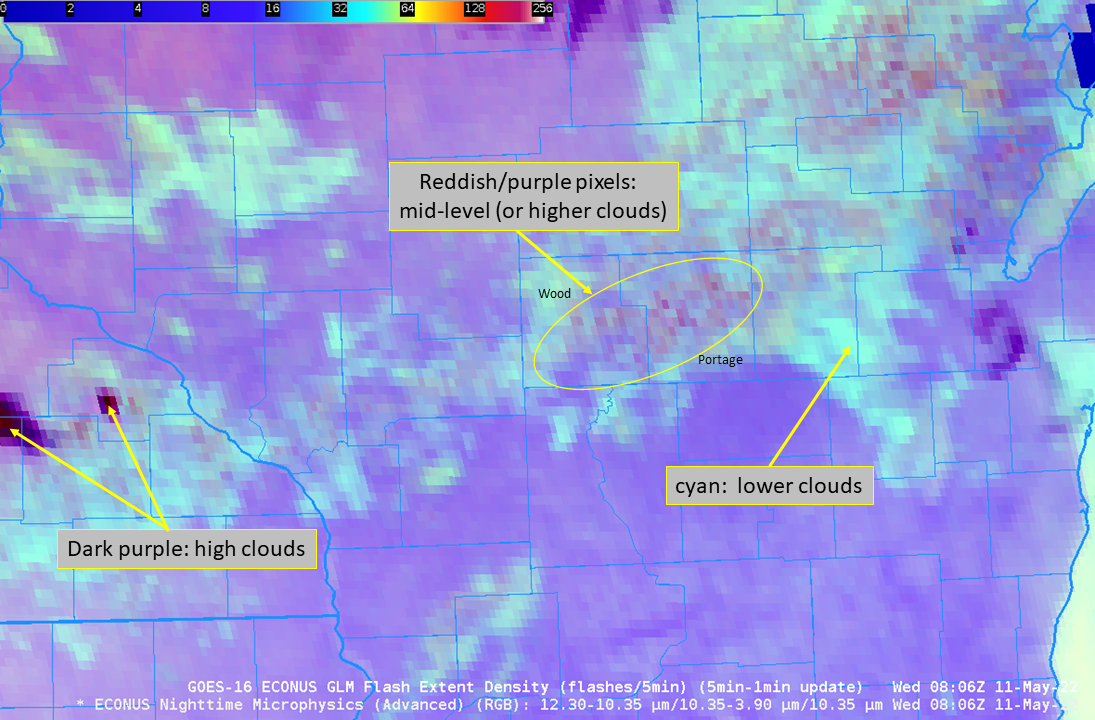
The Nighttime Microphysics RGB, above, over central Wisconsin (that’s Green Bay at the northeastern edge, and southeast Minnesota/northeast Iowa over the southwestern part, of the animation), shows a field of low clouds stretching west-southwest to east-northeast. Note however, the occasional appearance of redder pixels within the field (as shown in... Read More
Nighttime MIcrophysics RGB, 0616 – 0811 UTC on 11 May 2022 (click to enlarge)
The Nighttime Microphysics RGB, above, over central Wisconsin (that’s Green Bay at the northeastern edge, and southeast Minnesota/northeast Iowa over the southwestern part, of the animation), shows a field of low clouds stretching west-southwest to east-northeast. Note however, the occasional appearance of redder pixels within the field (as shown in this annotated image from 0806 UTC), especially in Wood and Portage counties (Click here for a map of Wisconsin counties). That kind of signal suggests that vertical cloud growth is occurring. Do you think convection will occur shortly? What about lightning?
850-mb Temperatures, 850-500 mb Lapse Rate, and Total Totals Index, 0730 UTC on 11 May 2022 (click to enlage)
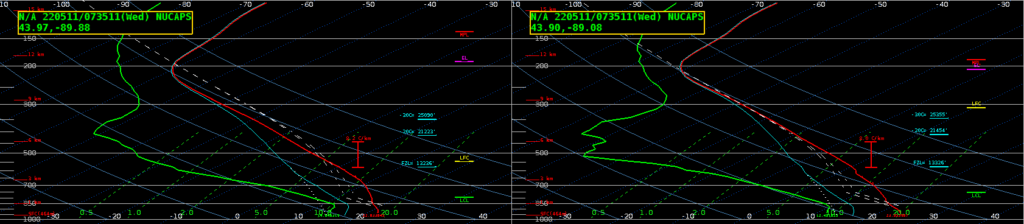
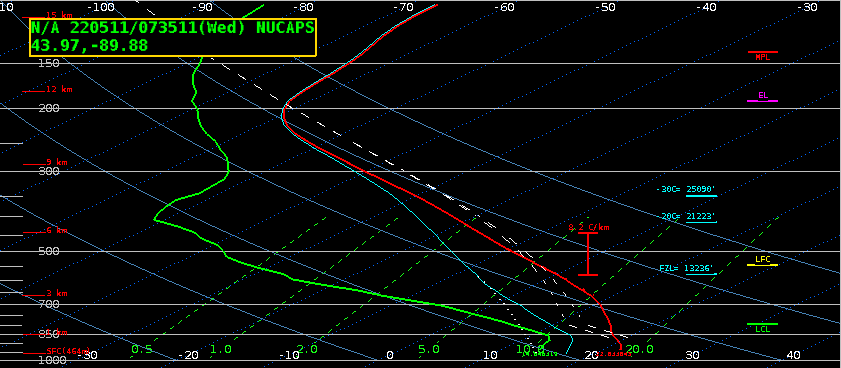
The individual NUCAPS soundings in Adams County and Green Lake County, below, show very steep mid-level lapse rates.
NUCAPS Profiles in Adams County (left) and Green Lake County (right) at 0735 UTC on 11 May 2022 (Click to enlarge)
The GOES animation of Nighttime Microphysics above ended at 0811 UTC. What happened in the next 15 minutes? Note a continued development in the amount of reddish pixels! During these 15 minutes, radar is also showing increasing returns.
Nighttime Microphsyics RGB, 0811-0826 UTC on 11 May 2022 (Click to enlarge)
If convection is expected, lightning might also occur. Lightning Cast is a product in the NOAA/CIMSS ProbSevere portfolio, and it’s available online here, and a short training video is here. LightningCast probabilities for the same 15-minute span as above are shown below. Low probabilites are present until 0826 UTC. When do you think lightning might occur with this developing line?
LightningCast probabilities, 0811-0826 UTC on 11 May 2022 (click to enlarge)
The animation below follows the developing cells through the next 15 minutes — from 0826 to 0841 UTC. Nighttime Microphysics (overlain by radar: note the parallax shift, and also note the continued reddening of pixels in the RGB where convection is occurring) is on the left, and LightningCast Probabilities are on the right. Do you think lightning is imminent?
Nighttime Microphysics RGB overlain with 0.5 Base Reflectivity (left) and LIghtningCast Probability (right), 0826 – 0841 UTC (Click to enlarge)
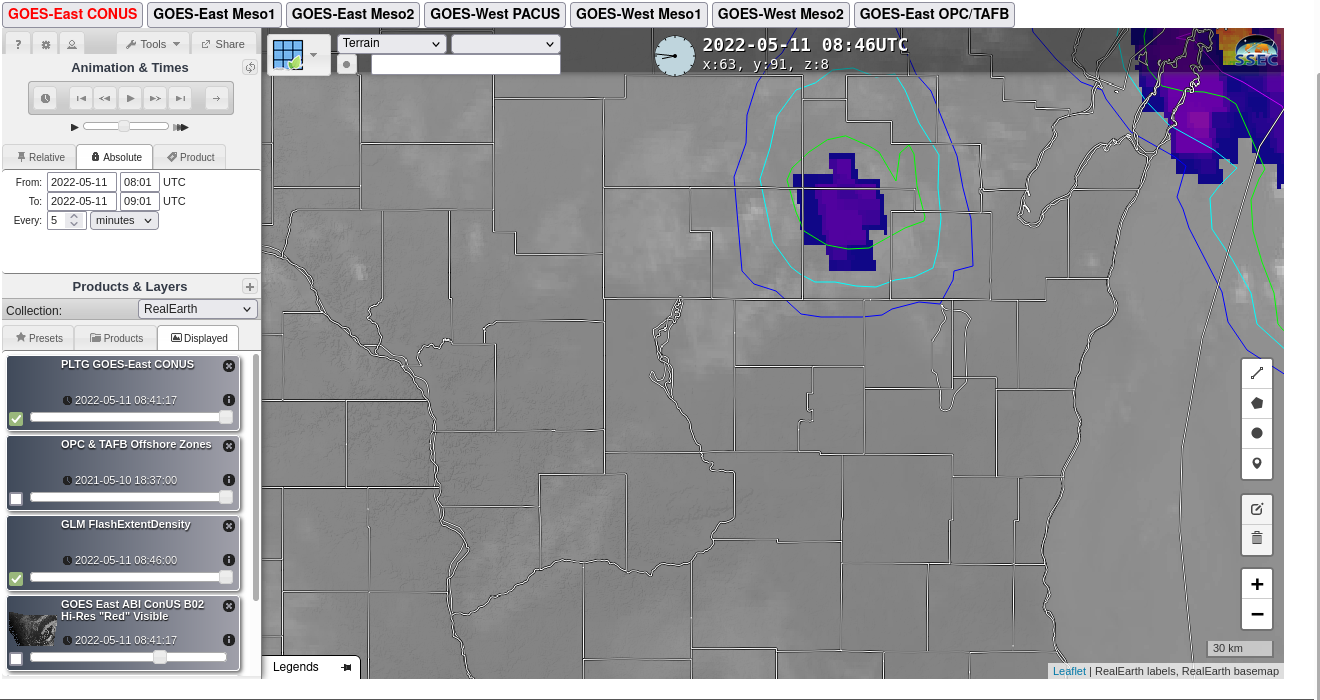
The first GLM observations (with a CONUS time cadence of every 5 minutes) of lightning occurred at 0846 UTC, as shown in the animation of the Nighttime Microphysics RGB below. (Here is LightningCast at 0846 UTC).
Nighttime Microphysics RGB and GLM Flash Extent Density (FED), 0616 – 0851 UTC on 11 May 2022 (click to enlarge)
The animation below shows the NightMicrophysics RGB overlain with LightningCast Probabilities, from 0816 to 0846 UTC.
GOES-16 Nighttime Microphysics RGB with LightningCast Probabilities and GLM FED observations, 0816 – 0846 UTC on 11 May 2022 (click to enlarge)
Gridded NUCAPS fields for this blog post were created using the NOAA/TOWR-S Cloud Instance of AWIPS. Thank you! And here is a link to a presentation detailing how the Nighttime Microphysics RGB can be used in winter!
GOES-16 “Red” Visible (0.64 µm, top left), Shortwave Infrared (3.9 µm, top right), Infrared Window (10.35 µm, bottom left) and Cloud Top Temperature derived product (bottom right) [click to play animated GIF | MP4]
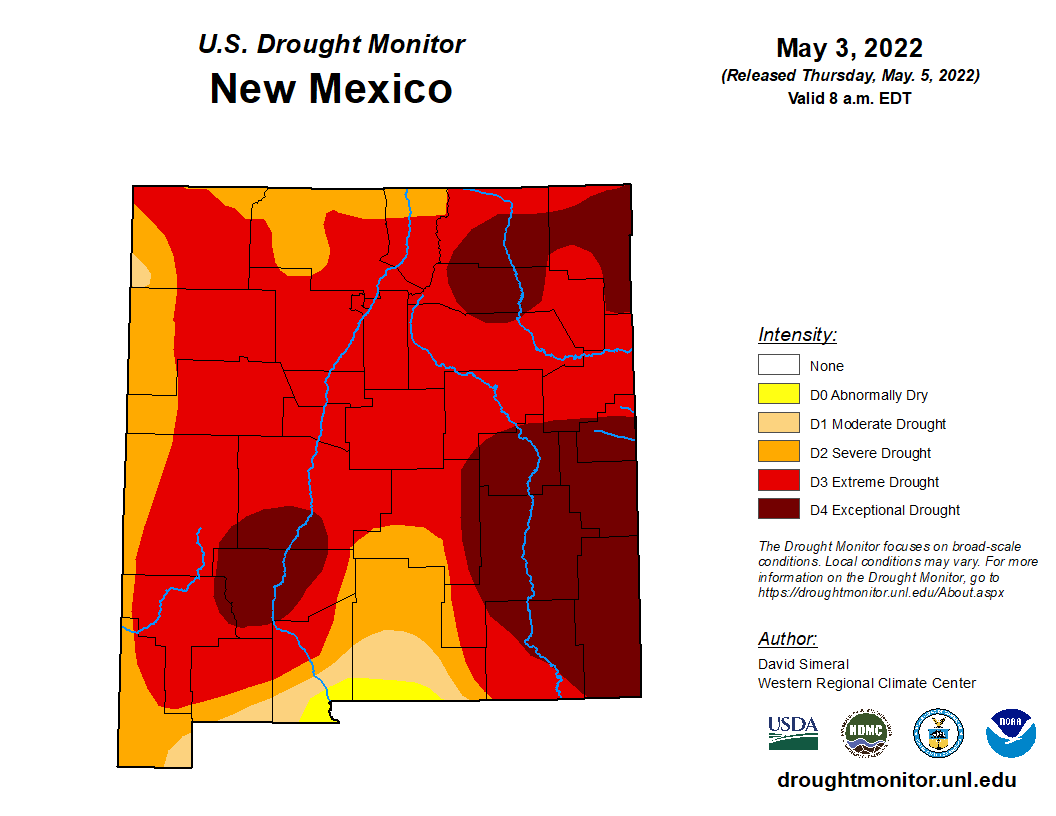
1-minute Mesoscale Domain Sector GOES-16 (GOES-East) “Red” Visible (0.64 µm), Shortwave Infrared (3.9 µm), “Clean” Infrared Window (10.35 µm) and Cloud Top Temperature derived product images (above) showed that the northern portion of the Calf Canyon Fire/Hermits Peak Fire in New Mexico produced a pyrocumulonimbus (pyroCb) cloud on 10 May 2022. Extreme fire behavior was aided by surface wind gusts in the 42-64 mph range and very dry air within the boundary layer (along with very dry fuels from the ongoing drought); these large fires also burned very hot, with 3.9 µm Shortwave Infrared brightness temperatures reaching 138.71ºC — the saturation temperature of ABI Band 7 detectors. Coldest 10.35 µm cloud-top brightness temperatures exhibited by the pyroCb cloud were around -45ºC (lighter blue enhancement), with the Cloud Top Temperature product showing values as cold as -54ºC (red pixels).
In a comparison of NOAA-20 VIIRS True Color RGB, False Color RGB and Infrared Window (11.45 µm) images valid at 2057 UTC (below), the coldest cloud-top infrared brightness temperature was -59ºC. These images were acquired and processed using the Direct Broadcast ground station at SSEC/CIMSS.
NOAA-20 VIIRS True Color RGB, False Color RGB and Infrared Window (11.45 µm) images [click to enlarge]
During the preceding nighttime hours, a toggle between Suomi-NPP VIIRS Day/Night Band and Shortwave Infrared images valid at 0847 UTC or 2:47 am MDT (below) showed the bright emitted light and hot thermal signature of active fires along the periphery of the burn area — especially along the northern fire front, which eventually produced the pyroCb cloud.
Suomi-NPP VIIRS Day/Night Band (0.7 µm) and Infrared Window (11.45 µm) images [click to enlarge]
An evolution of the recent New Mexico wildfires using a series of VIIRS Day/Night Band images is available at this blog post.


