This website works best with a newer web browser such as Chrome, Firefox, Safari or Microsoft
Edge. Internet Explorer is not supported by this website.
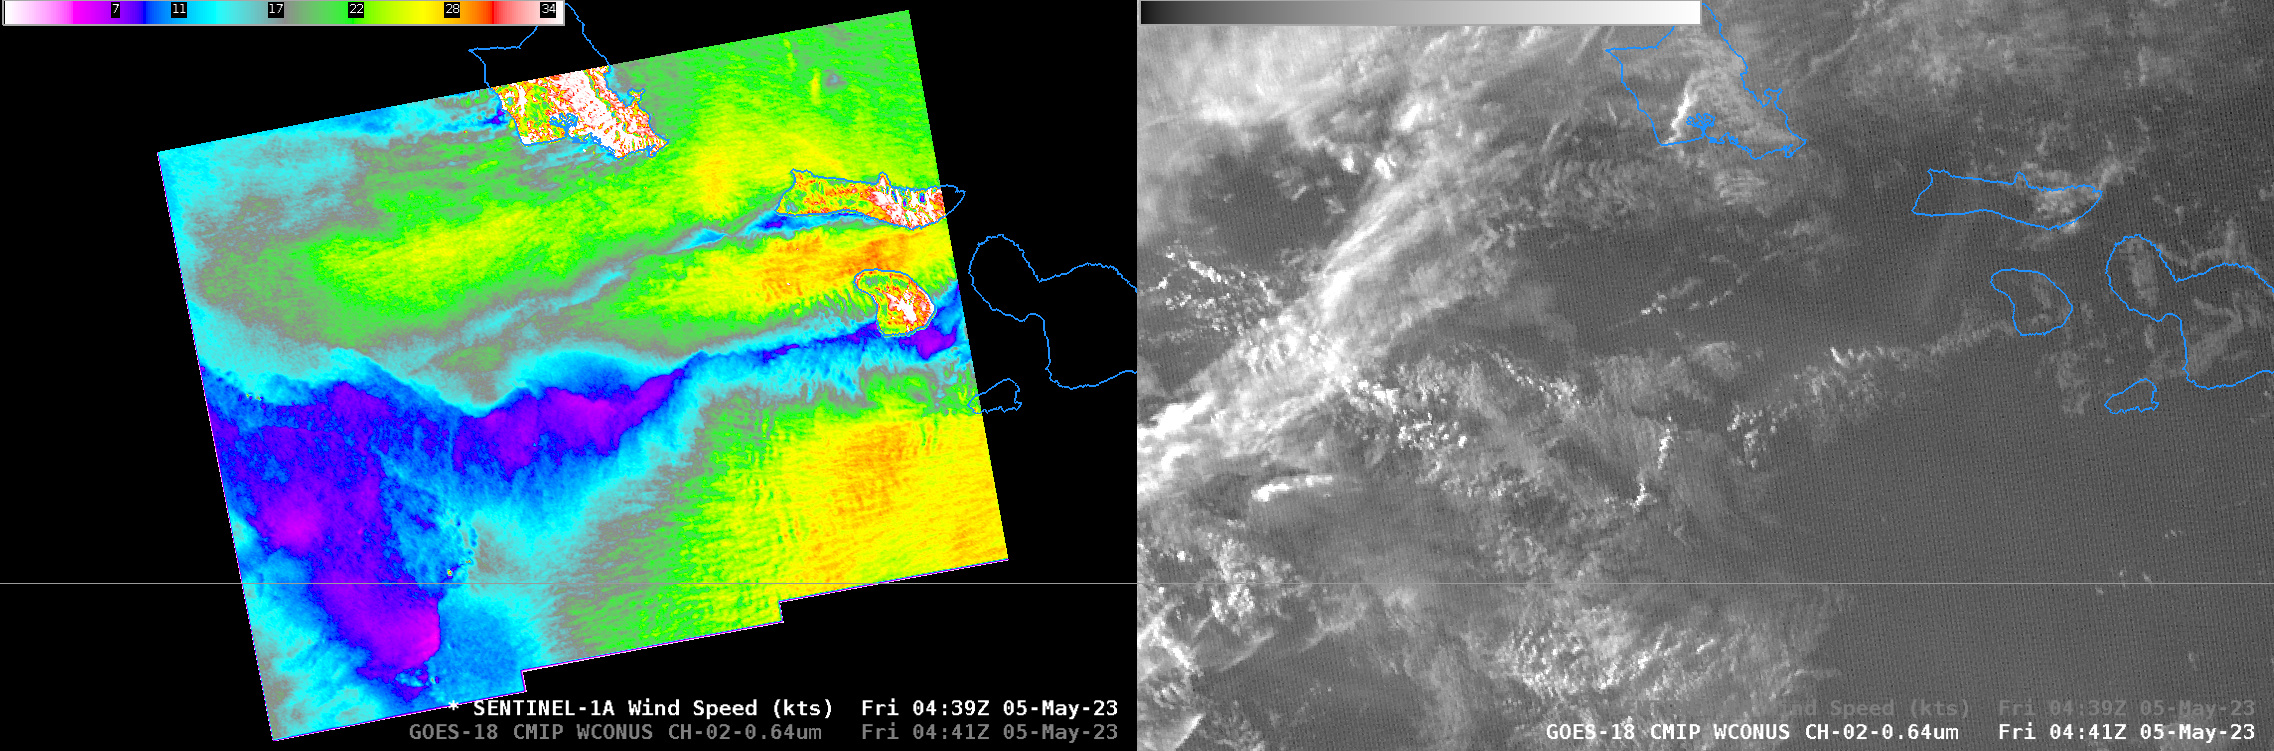
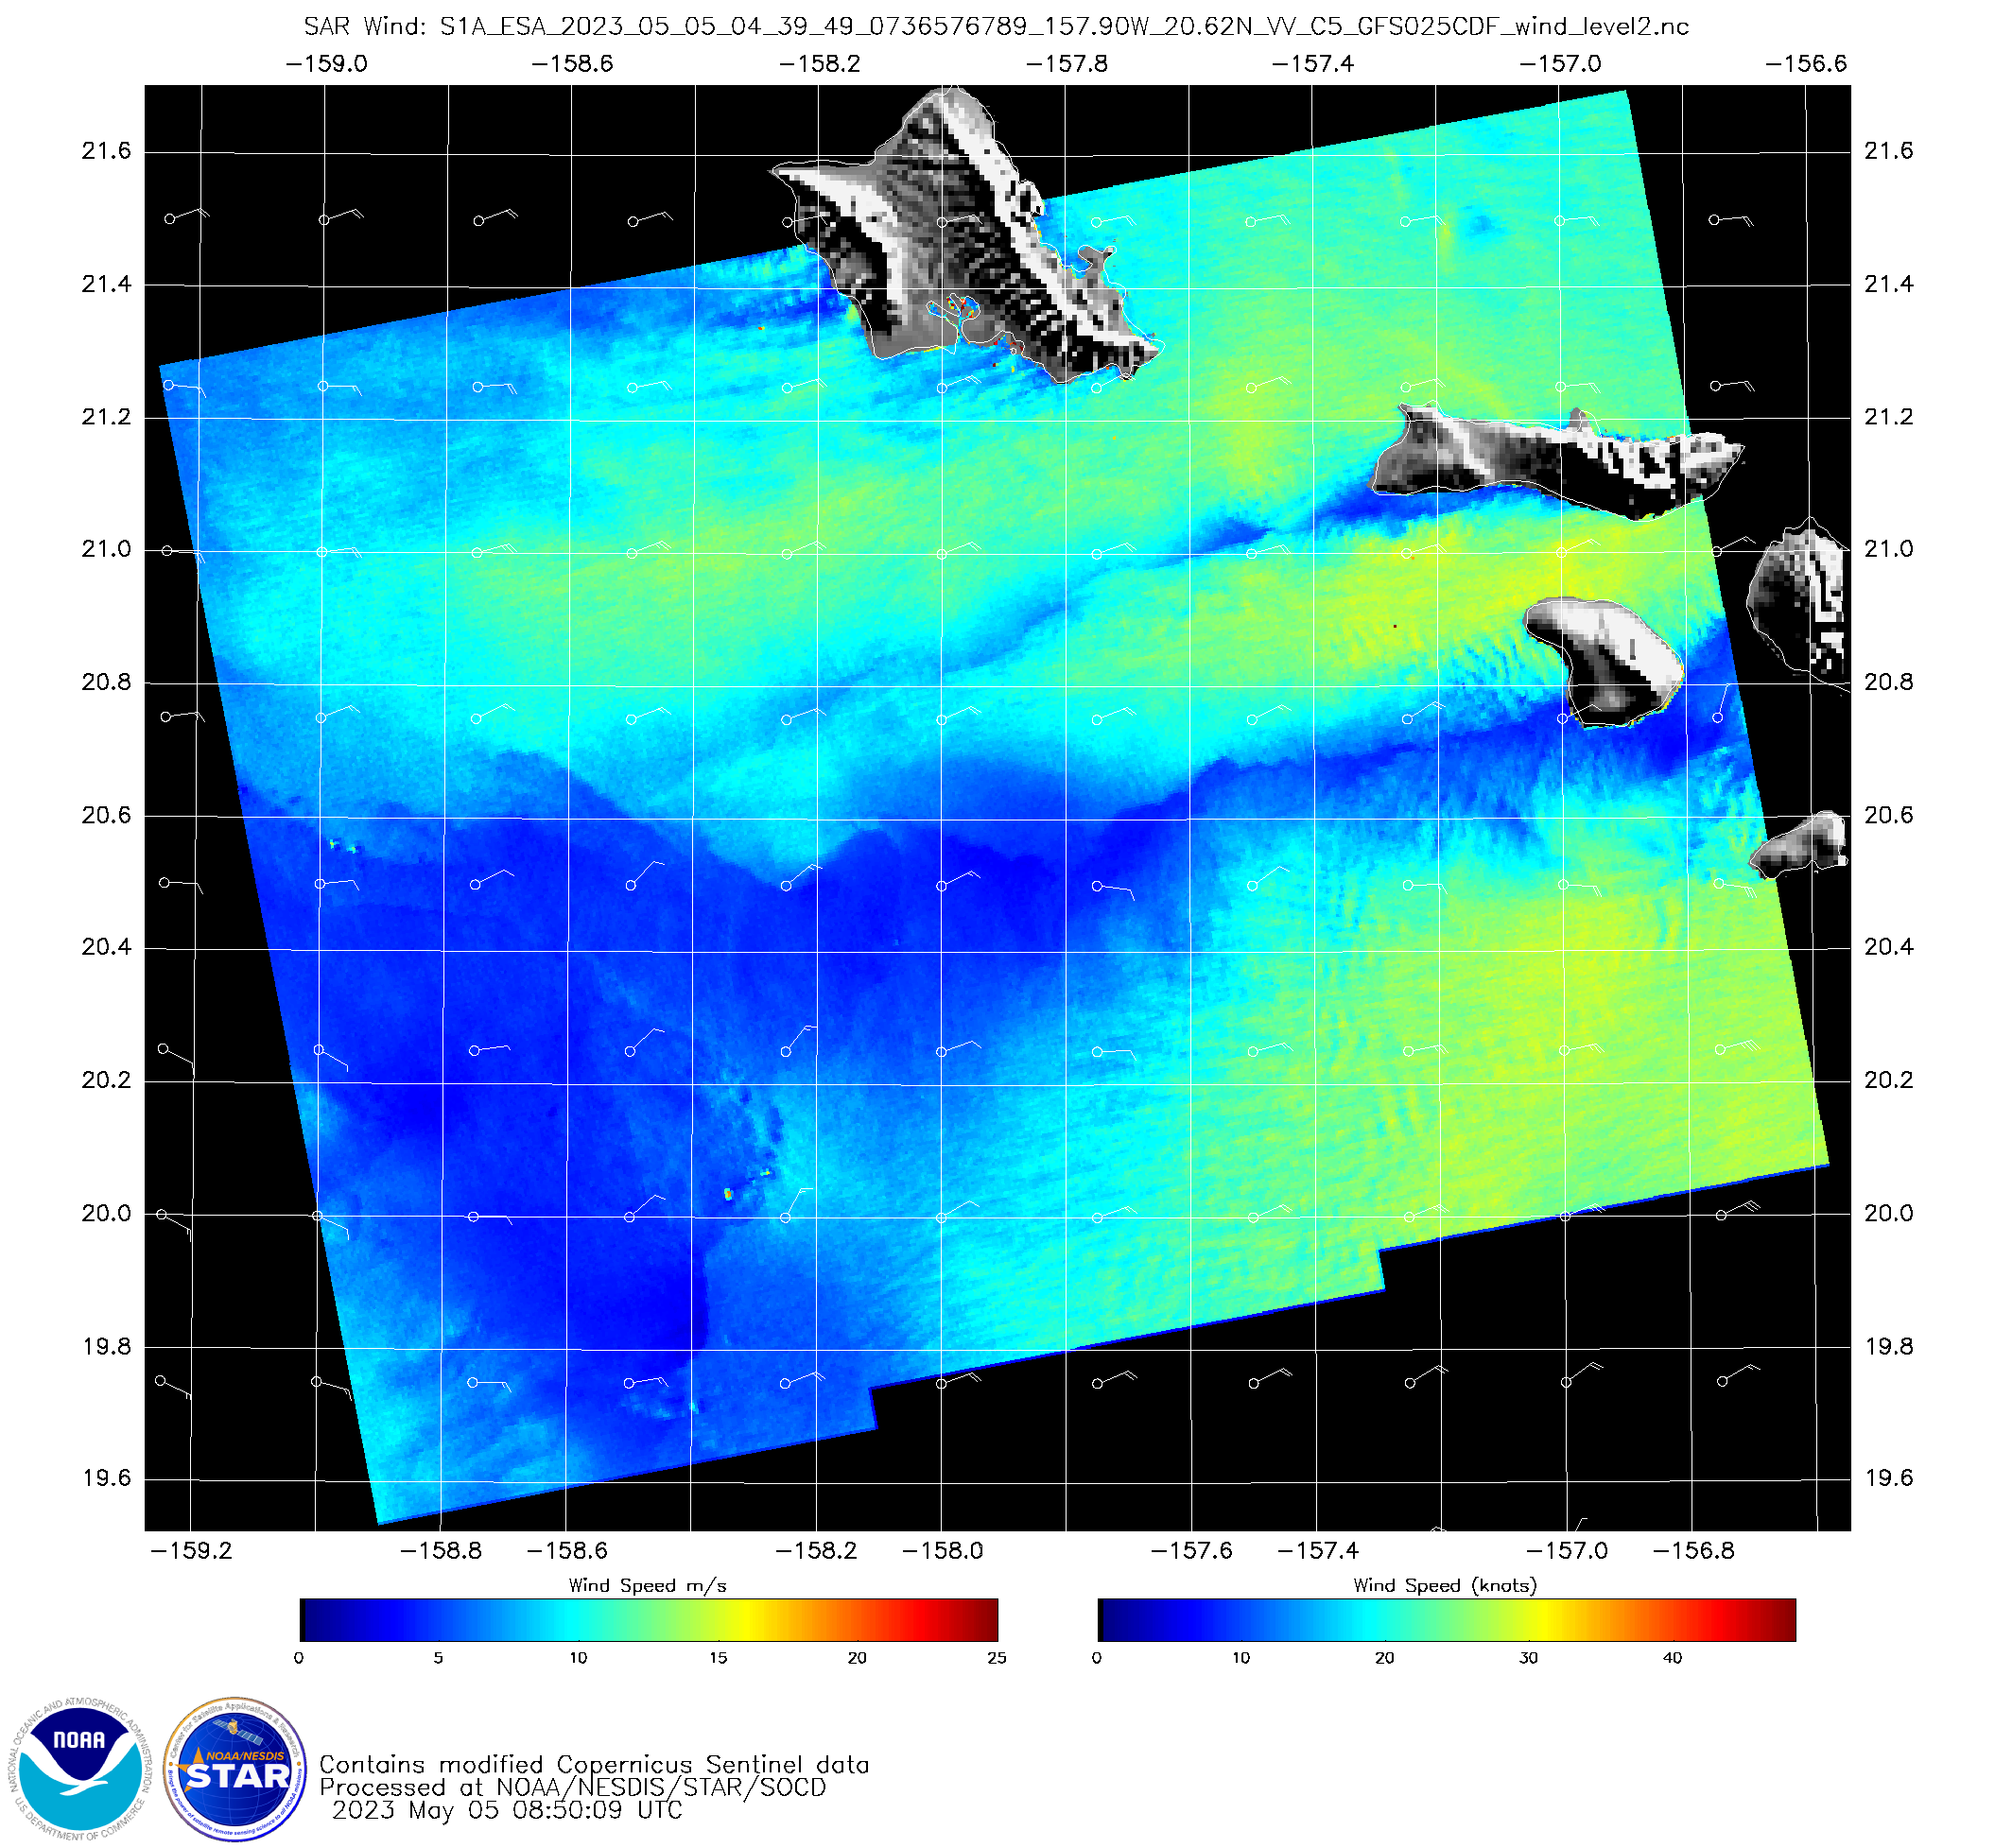
Sentinel-1A overflew the Hawai’ian Islands near sunset on 4 May, as shown above (Sentinel-1A SAR Imagery is available online here and here). The toggle above compares the derived winds with GOES-18 Visible imagery (Band 2, 0.64 µm); the visible data enhancement has been changed (that is, brightened) from the default range... Read More
Sentinel-1A wind speeds (0-35 knots) at 0439 UTC along with GOES-18 Visible (Band 2, 0.64 µm) imagery, 0441 UTC on 5 May 2023.
Sentinel-1A overflew the Hawai’ian Islands near sunset on 4 May, as shown above (Sentinel-1A SAR Imagery is available online here and here). The toggle above compares the derived winds with GOES-18 Visible imagery (Band 2, 0.64 µm); the visible data enhancement has been changed (that is, brightened) from the default range of 0 to 130 to just 0 to 5 for this post-sunset scene. Winds approaching 30 knots (orange/red in the enhancement used) are common in the bands of wind between the islands. The regions of relatively calm winds (purple and blue in the enhancement used) in between the strong wind bands are where cloud bands exist, as shown both in the toggle above and the side-by-side image below.
Sentinel-1A SAR Winds (0439 UTC), left, and GOES-18 Clean Window visible imagery (Band 2, 0.64 µm , 0441 UTC) (Click to enlarge)
The presence of the cloud bands suggests that surface convergence is occurring in between the bands of strong winds.
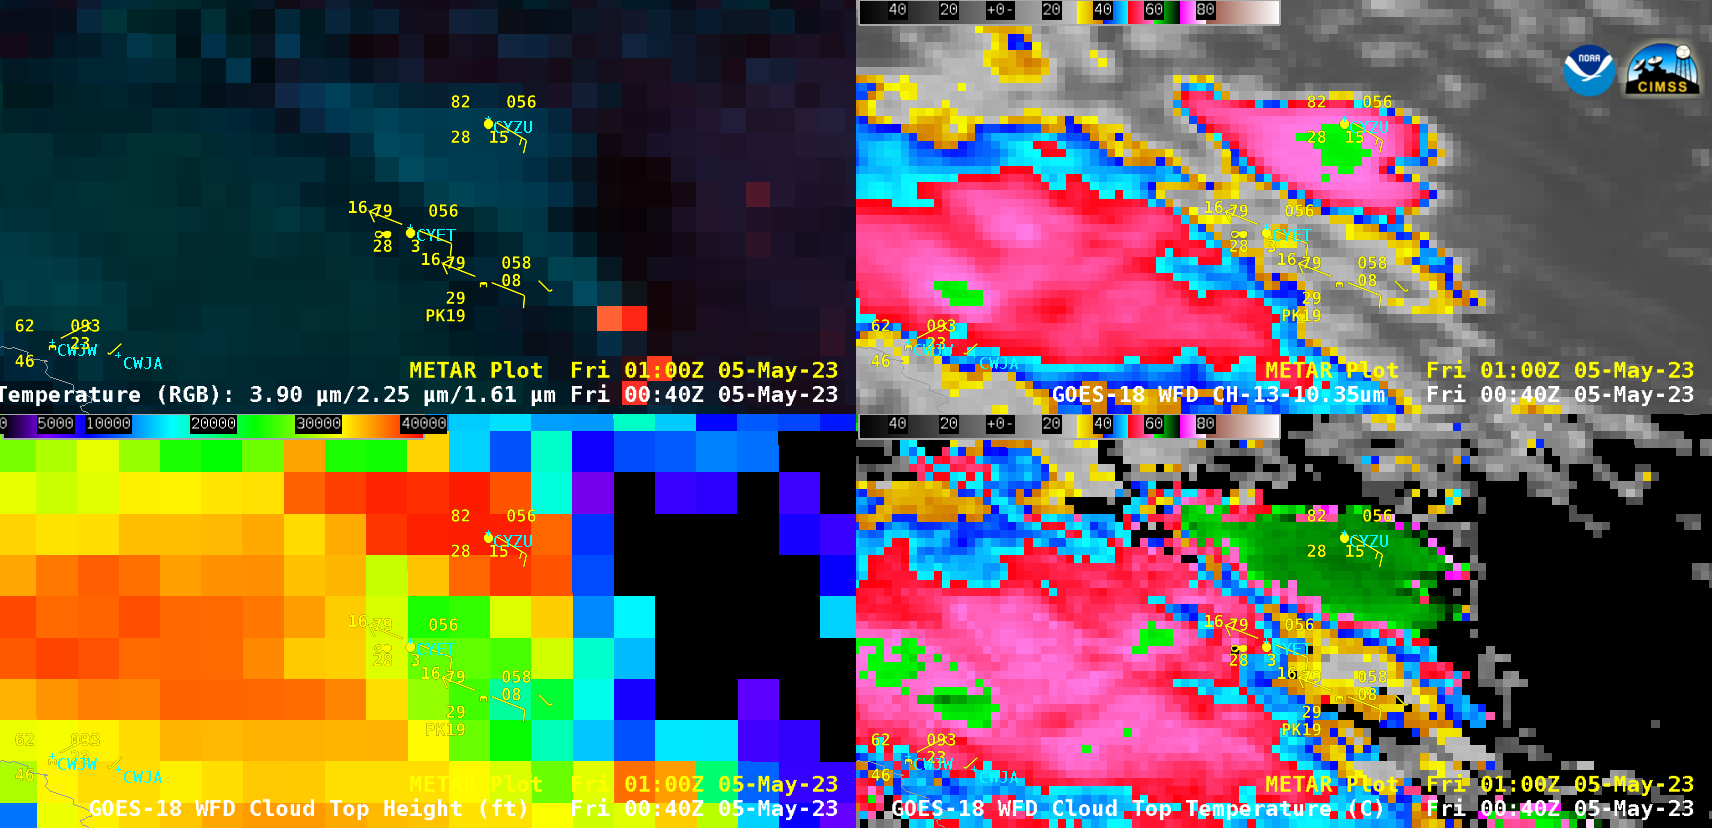
10-minute Full Disk sector GOES-18 (GOES-West) Fire Temperature RGB, “Clean” Infrared Window (10.3 µm), Cloud Top Height and Cloud Top Temperature (above) showed the formation of a pyrocumulonimbus (pyroCb) cloud produced by a wildfire southeast of Edson, Alberta (station identifier CYET) on 04 May 2023. Cloud-top 10.3 µm infrared brightness temperatures were as cold as -61ºC, while the multispectral... Read More
GOES-18 Fire Temperature RGB (top left), “Clean” Infrared Window (10.3 µm, top right), Cloud Top Height (bottom left) and Cloud Top Temperature (bottom right) [click to play animated GIF | MP4]
10-minute Full Disk sector GOES-18 (GOES-West)Fire Temperature RGB, “Clean” Infrared Window (10.3 µm), Cloud Top Height and Cloud Top Temperature(above) showed the formation of a pyrocumulonimbus (pyroCb) cloud produced by a wildfire southeast of Edson, Alberta (station identifier CYET) on 04 May 2023. Cloud-top 10.3 µm infrared brightness temperatures were as cold as -61ºC, while the multispectral Cloud Top Temperature derived product revealed values as cold as -66ºC. Cloud Top Height values reached 39,000 feet. It should be noted that these Full Disk sector images and products are (unfortunately) provided at a reduced spatial resolution in AWIPS.
A plot of 0000 UTC rawinsonde data from Edmonton, Alberta (below) indicated that the pyroCb cloud-top temperatures colder than -60ºC were close to the tropopause temperature, suggesting that some smoke and cloud material may have been injected into the lower stratosphere.
Plot of 0000 UTC rawinsonde data from Edmonton, Alberta [click to enlarge]
GOES-18 True Color RGB images from the CSPP GeoSphere site are shown below.
GOES-18 True Color RGB images [click to play animated GIF | MP4]
A long-wave diffluent trough centered over California and Nevada was helping to force benign convection along the Laramie Mountains, which run roughly from Laramie to Casper, Wyoming. The ProbSevere LightningCast model, which uses AI and GOES-R data to predict the probability of lightning in the next hour, was able to highlight... Read More
A long-wave diffluent trough centered over California and Nevada was helping to force benign convection along the Laramie Mountains, which run roughly from Laramie to Casper, Wyoming.
The ProbSevere LightningCast model, which uses AI and GOES-R data to predict the probability of lightning in the next hour, was able to highlight this convection before the first flashes occurred. Lead time to the initial flashes ranged from 10 to 30 minutes, measured from the 25% probability of lightning contour.
Figure 1: Animation of ProbSevere LightningCast probabilities of lightning (blue=10%, cyan=25%; green=50%; magenta=75%), GOES-16 GLM flash-extent density (blue foreground pixels), and GOES-16 ABI day land cloud convection RGB, all along the Laramie Mountains in Wyoming.
One interesting feature in this animation is the packing of the probability contours. The storms are moving generally from south to north. The contours are much more packed along the south and west edges of the region of convection (i.e., where convection is moving away from), while they are more diffuse along the north and east edges (i.e., where the convection is moving towards. This indicates that the model is (at least in part) accounting for the motion of the storms in the next hour. LightningCast expects the storms to move north, which is what they are indeed doing. This was a very surprising result, since LightningCast was trained with samples that used only one snapshot or timestamp of satellite data.
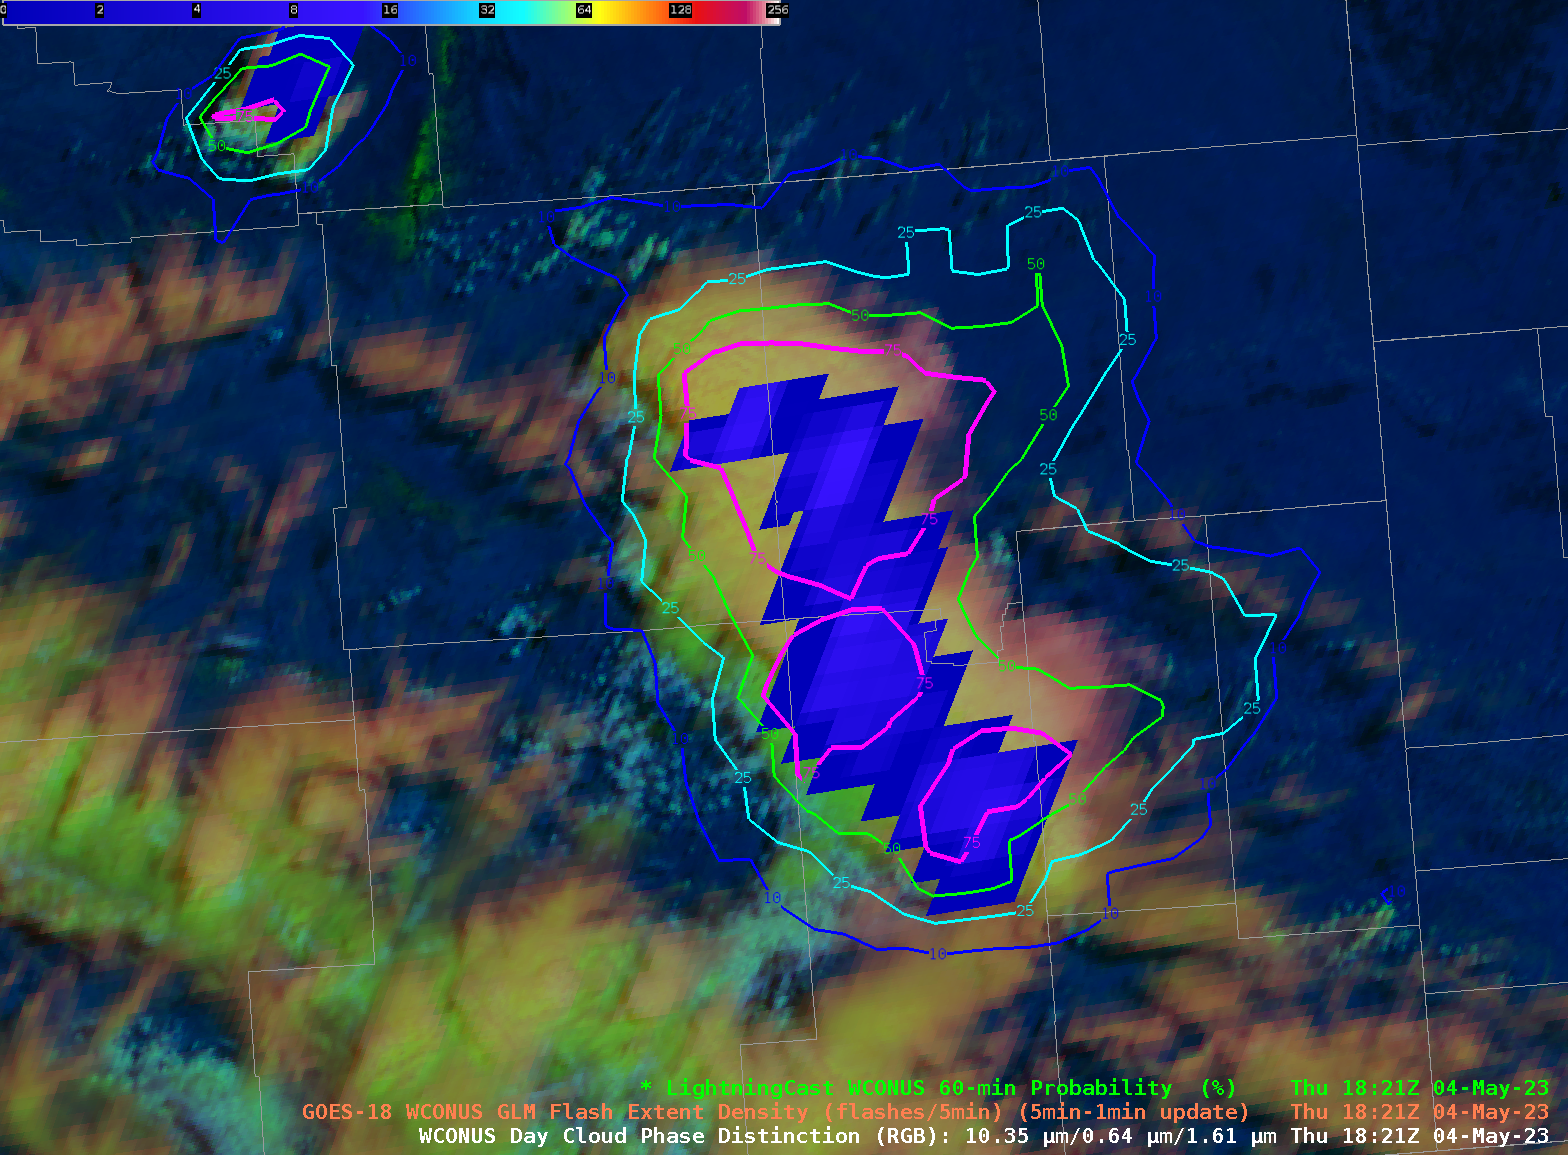
From GOES-West (GOES-18) in Figure 2, we can see the same effect, though perhaps not as pronounced. But keep in mind the satellite viewing geometry is much different in Wyoming from GOES-East versus GOES-West. And while next-hour motion of storms is not always well predicted, it is nevertheless encouraging that LightningCast is able to discern motion at times from only one snapshot of data. Forecasters often look at animations of satellite data to make nowcasts, and we believe that training the model with “videos” of data rather than images will further enhance its ability to project lightning threats in the near future. One downside is that this greatly increases the complexity and computational cost to create such a model. However, recent developments in AI/ML modeling show that training with video imagery (and predicting video imagery) is becoming more feasible.
Figure 2: ProbSevere LightningCast contours computed with GOES-18 data. Blue foreground pixels are GOES-18 GLM flash-extent density and background is GOES-18 ABI day cloud phase distinction RGB.
The mp4 animation above, downloaded from the CSPP Geosphere site, shows true-color imagery in the 90 minutes surrounding an EF-3 tornado in Virginia Beach, VA shortly before 2200 UTC on 30 April 2023 (CIMSS Satellite Blog post; SPC Storm reports; ProbSevere imagery for the storm is here). Note the overshooting tops moving from southeastern Virginia northeastward to... Read More
GOES-16 True-Color imagery from CSPP Geosphere site, 2051 – 2226 UTC on 30 April 2023
The mp4 animation above, downloaded from the CSPP Geosphere site, shows true-color imagery in the 90 minutes surrounding an EF-3 tornado in Virginia Beach, VA shortly before 2200 UTC on 30 April 2023 (CIMSS Satellite Blog post; SPC Storm reports; ProbSevere imagery for the storm is here). Note the overshooting tops moving from southeastern Virginia northeastward to the extreme southern Delmarva peninsula, likely associated with the strongest thunderstorms. This blog post considers how the addition of Polar Hyperspectral Sounding (PHS) data into a numerical model affected the model simulation of this tornadic event (model output is available here). This PHS modeling system is being demonstrated at the Hazardous Weather Testbed late in May, and in early June (PHS model output was also available at last year’s HWT!)
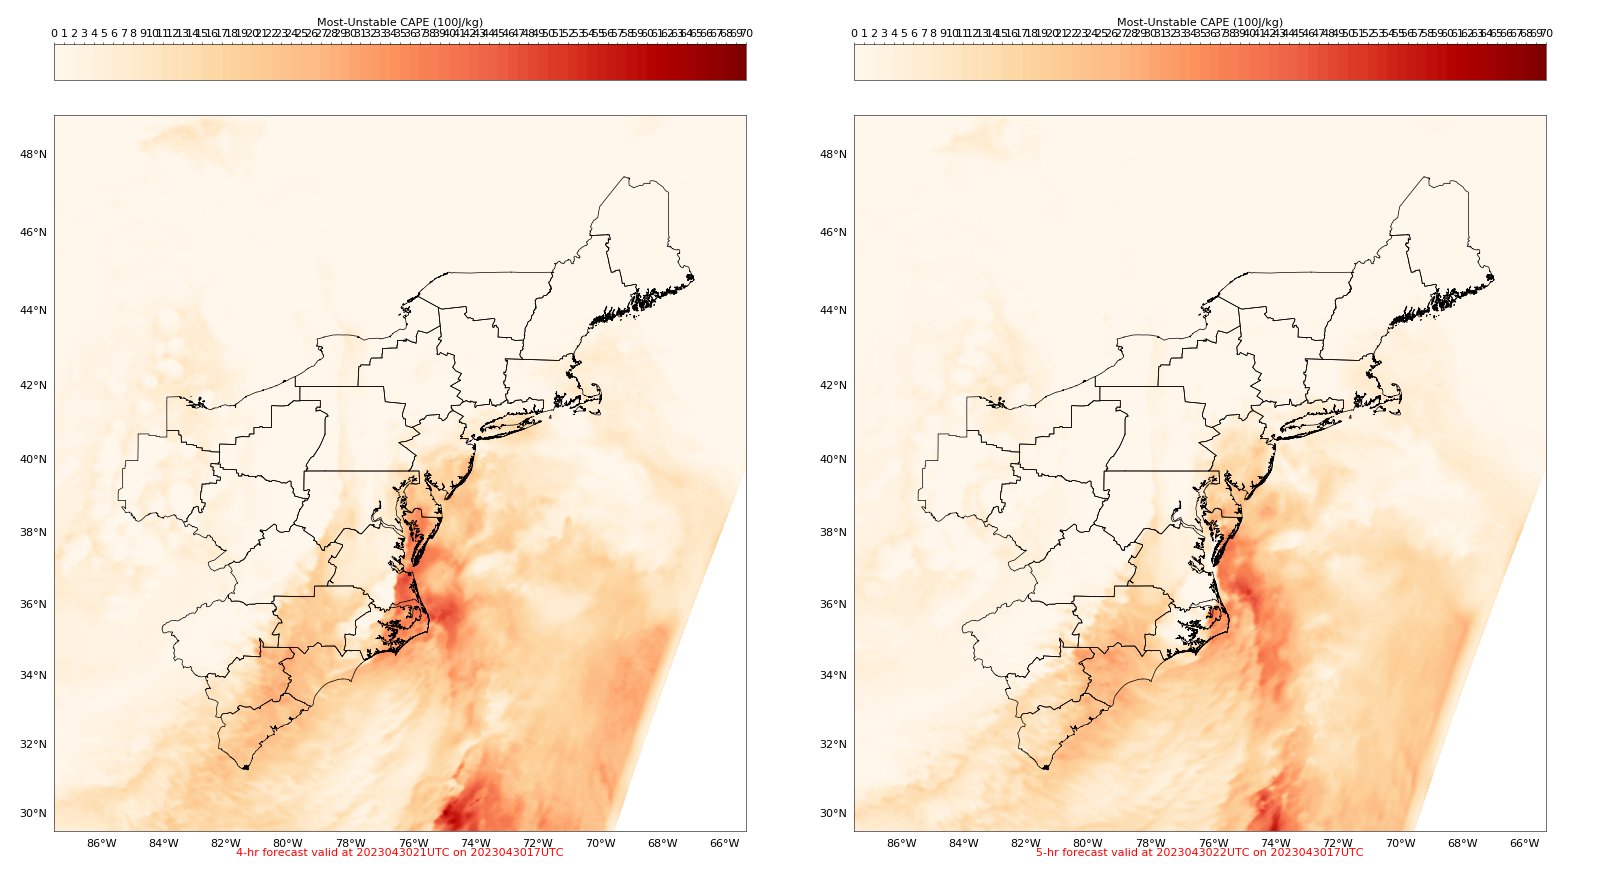
3-km WRF (initial time: 1600 UTC) estimates of MUCAPE, 5-h forecast valid 2100 UTC (Left) and 6-h forecast valid 2200 UTC (right) on 30 April 2023 (Click to enlarge)
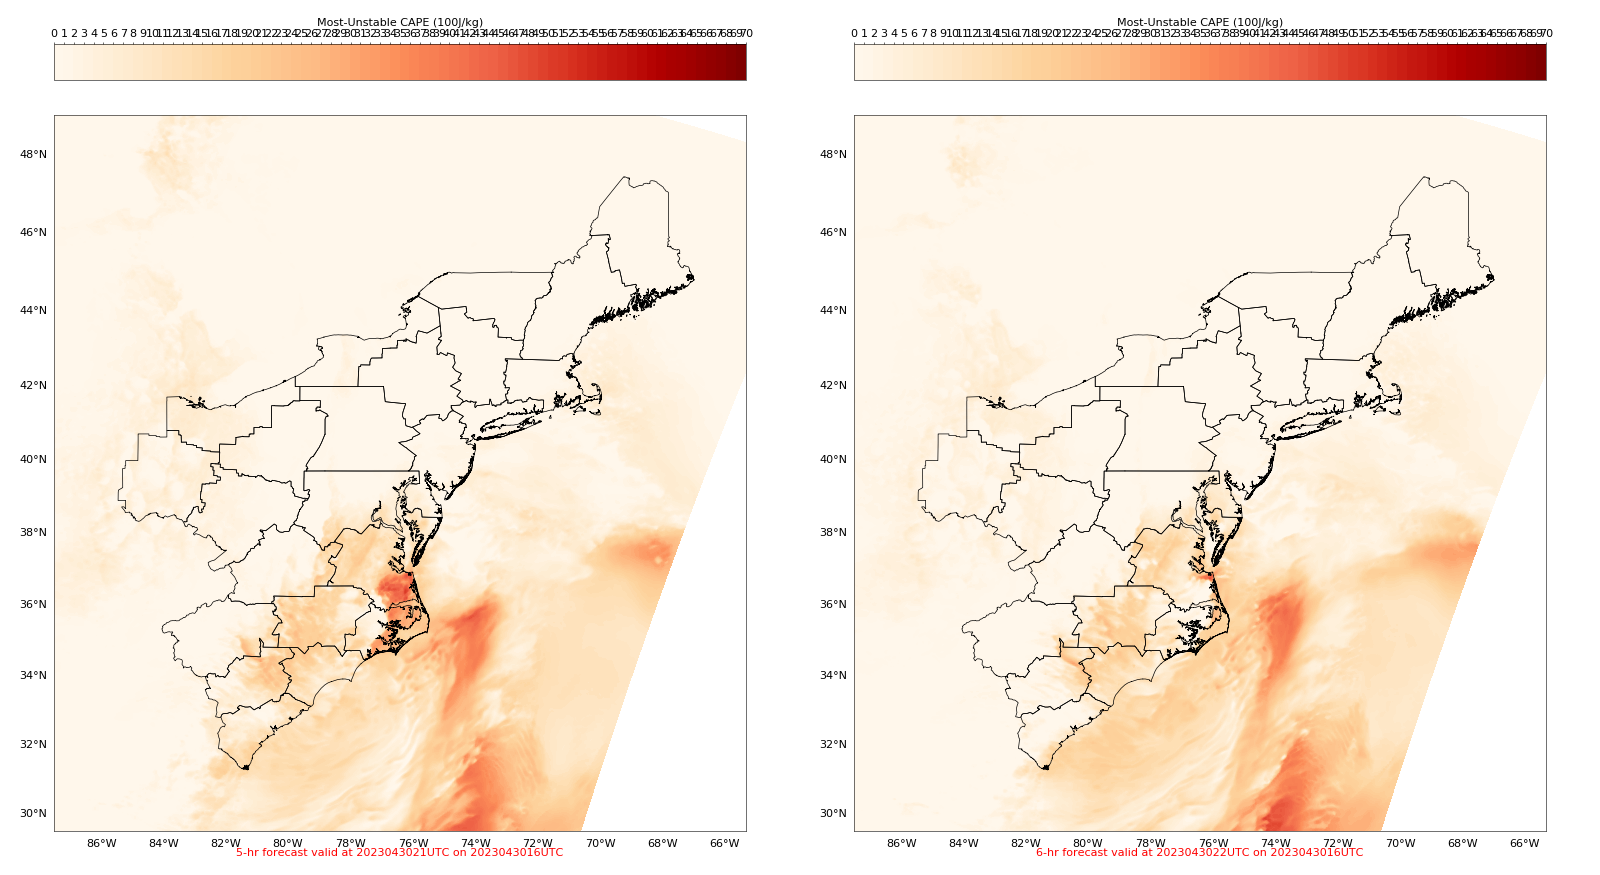
The two-panel image above shows 5- and 6-h MUCAPS distributions from a WRF simulation (with 3-km resolution) initialized with conventional data, and the image below shows 5- and 6-h forecast MUCAPS from a HRRR simulation (with 4-km resolution) that includes as part of its assimilation cycle temperature and moisture fields that include information from Polar Hyperspectral Soundings (in this case, from the morning overpasses from IASI on Metop-B and Metop-C). Compare the fields above and below. The HRRR simulation that includes the influence of Polar Hyperspectral Sounding data leads to a MUCAPE field that extends more seamlessly north towards the Delmarva peninsula.
4-km HRRR (initial time: 1600 UTC) estimates of MUCAPE, 5-h forecast valid 2100 UTC (Left) and 6-h forecast valid 2200 UTC (right) on 30 April 2023 (Click to enlarge)
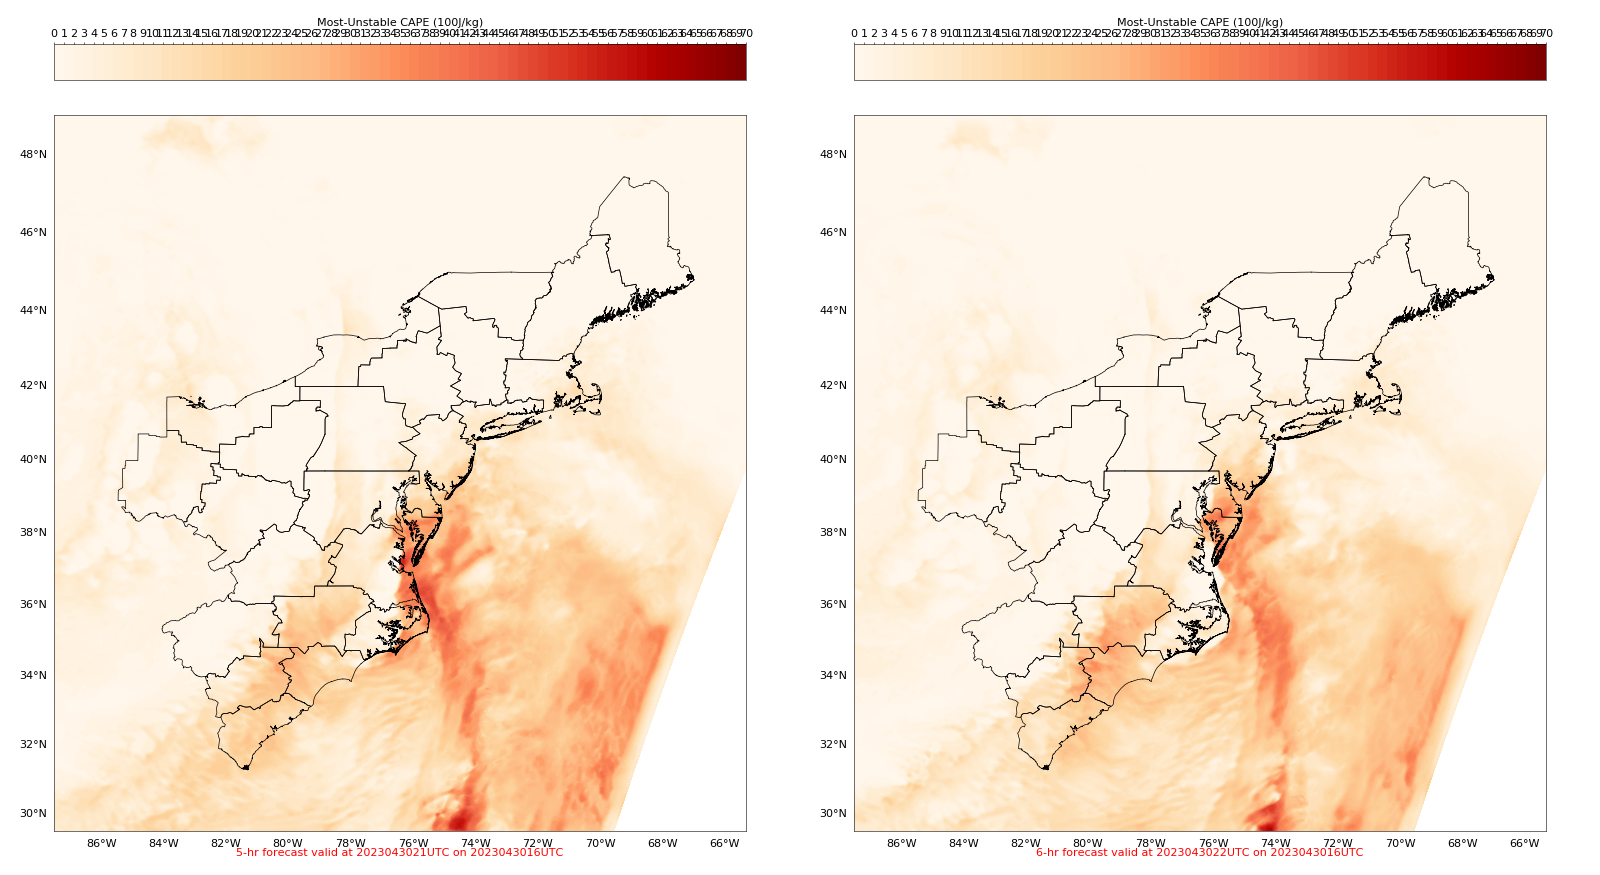
The PHS simulation from 1700 UTC, below, shows good consistency with the 1600 UTC run shown above. In particular, both show the most unstable CAPE lingering over extreme southeastern Virginia at 2100 UTC and offshore at 2200 UTC.
4-km HRRR (initial time: 1700 UTC) estimates of MUCAPE, 4-h forecast valid 2100 UTC (Left) and 5-h forecast valid 2200 UTC (right) on 30 April 2023 (Click to enlarge)
HRRR data was also used to compute Significant Tornado Parameter (STP), and the animation below shows parameter forecasts (from the model initialized at 1700 UTC) for 1900, 2000, 2100 and 2200 UTC.
Significant Tornado Parameter from a HRRR simulation intialized at 1700 UTC with PHS data; forecasts valid hourly from 1900-2200 UTC on 30 April 2023 (Click to enlarge)


