
In August 2024, the European Space Agency in partnership with EUMETSAT launched a pathfinder mission called Arctic Weather Satellite (AWS), designed to prove that high-quality passive microwave observations on a micro-satellite (about the size of a washing machine!) in polar low-earth orbit are possible. AWS has one instrument on board to do this, the Microwave Radiometer (MWR), that collects observations across 19 channels, with a pixel footprint size between 10 – 40 km, depending on the channel:
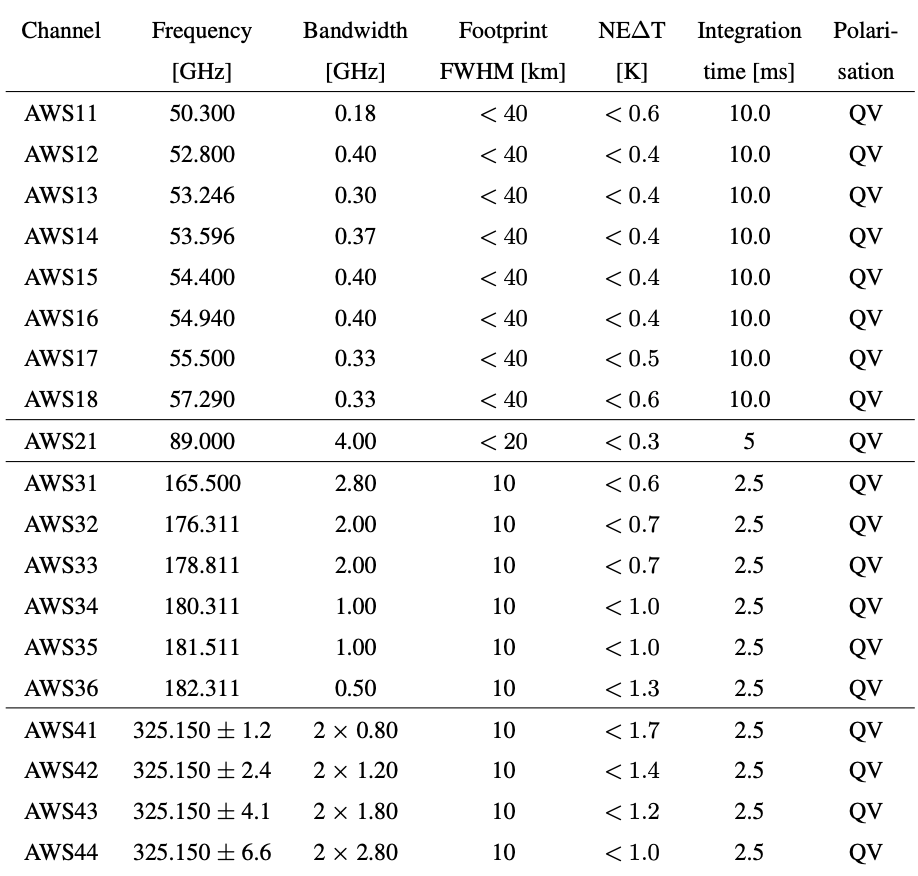
Notably, AWS MWR is the first weather satellite to include channels (4 of them) around 325 GHz, which is designed to add new information about ice clouds. All together, these channels provide information that can be used to determine vertical structure of temperature and humidity in all-sky conditions.
This satellite downlinks its global, full-orbit data to a ground station in Svalbard. Since July 2025, ECMWF has been operationally assimilating AWS MWR into its forecast models with positive results. In addition, AWS has a direct broadcast capability in the L-band, allowing anyone with the right equipment to capture science data as it flies overhead. To collect this signal as the satellite passes overhead and make it useful, you need 5 things:
- An antenna and feed capable of receiving the direct broadcast signal.
- A demodulator configured to handle the received RF signal and turn it into a stream of packets.
- An antenna control server that can routinely schedule reception of the satellite and capture the packets.
- Software that can assemble, geolocate, and calibrate the raw packets to a Level 1 file.
- Software that can read the Level 1 file and produce useful file formats for visualization.
On item 1, SSEC (along with our partners at the University of Alaska Fairbanks GINA) already operate a network of LEO direct broadcast antennas capable of L-band reception around the United States. Over the last year, we worked with the antenna vendor to develop a demodulator mode and schedule/reception configuration for AWS, covering items 2 and 3.
As of today, there two known direct broadcast antennas in the United States with all the hardware and software needed to routinely capture AWS direct broadcast – SSEC’s antenna in Madison, WI and GINA’s antenna at NOAA FCDAS in Fairbanks, AK.
In July 2025, EUMETSAT released their Level 0 / Level 1 processing package for AWS MWR. SSEC and GINA have since integrated this software into downstream processing servers, producing a real-time feed of AWS MWR Level 1 files. Then, on March 2nd, 2026, the CSPP team released Polar2Grid v3.2, which, among other things, adds the ability to read Arctic Weather Satellite MWR Level 1 files, and produce GeoTIFF and AWIPS tiled outputs. With that, all 5 items have been accomplished! For example, here’s a sample of Polar2Grid-generated images from the two systems of AWS MWR Band 19 (called AWS44 in the chart above), which is most sensitive to low level ice clouds and snow:


Work has yet to be done by various groups on developing useful colormaps to make these MWR Level 1 bands helpful for forecasters, and on the integration of AWS MWR into NOAA’s operational Level 2 microwave products (like MiRS). EUMETSAT plans on launching additional micro-satellites (up 6 operational satellites at a time, spread across 3 orbital planes), nearly identical to AWS, starting in 2029, creating a constellation called Sterna. Sterna satellites, along with the traditional NOAA JPSS and EUMETSAT MetOp constellations, would provide rapid-revisit passive microwave soundings across the whole globe to improve weather forecast accuracy.

More information about EUMETSAT’s future Sterna constellation can be found at: https://www.eumetsat.int/eps-sterna
Looking ahead, SSEC hopes to purchase the hardware needed to support AWS and other upcoming DB missions at its other 5 antenna sites. GINA is providing Alaska AWS DB data to NOAA/NESDIS for experimental inclusion in an improved Level 2 Snowfall Rate product. Work on this initial AWS direct broadcast development was partially supported by SSEC’s Polar Satellite Antenna Systems contract with the National Weather Service Office of Observations.
View only this post Read Less


