A toggle between NOAA-20 VIIRS Day/Night Band (0.7 µm) and Infrared Window (11.45 µm) images valid at 0805 UTC or 2:05 AM CST on 12 November 2022 (above) showed a broad plume of lake effect clouds streaming south-southwestward from Lake Nipigon, Ontario (north of Katatota Island, station CWKK) toward Lake Superior. A strong... Read More
NOAA-20 VIIRS Day/Night Band (0.7 µm) and Infrared Window (11.45 µm) images valid at 0805 UTC [click to enlarge]
A toggle between NOAA-20 VIIRS Day/Night Band (0.7 µm) and Infrared Window (11.45 µm) images valid at 0805 UTC or 2:05 AM CST on
12 November 2022 (above) showed a broad plume of lake effect clouds streaming south-southwestward from
Lake Nipigon, Ontario (north of Katatota Island, station CWKK) toward Lake Superior. A strong northeasterly flow of cold air across the still-unfrozen Lake Nipigon was helping to create this plume of lake effect clouds.
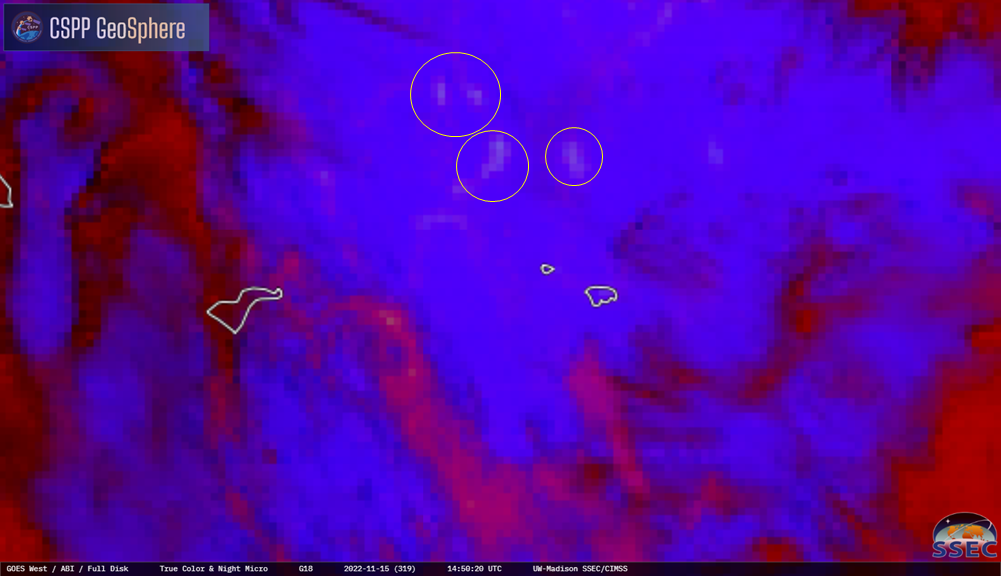
During the subsequent daytime hours, GOES-16 True Color RGB images from the CSPP GeoSphere site (below) displayed the lake effect snow (LES) bands that were streaming southwestward from Lake Nipigon and across the western portion of Lake Superior. The dominant LES band produced snowfall amounts as high as 10 inches in western Upper Michigan and 13.8 inches in northwestern Wisconsin.
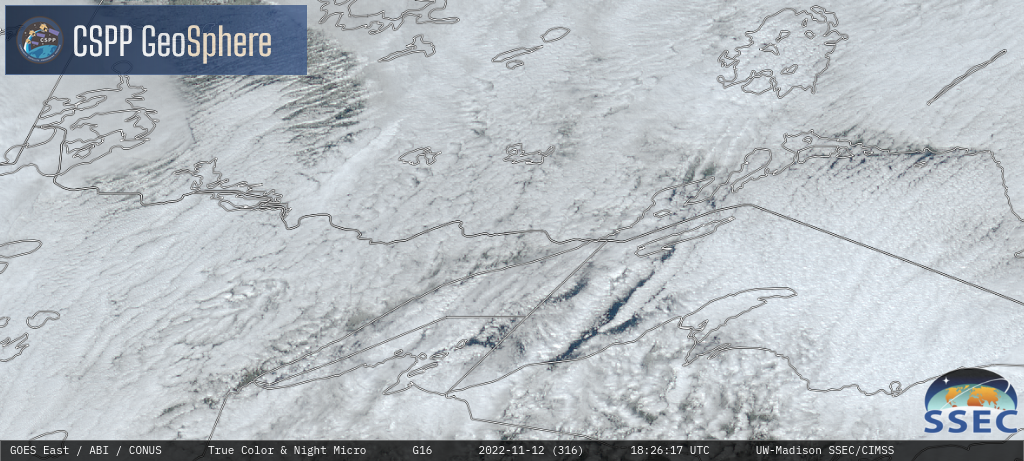
GOES-16 True Color RGB images [click to play MP4 animation]
GOES-16
Day Cloud Phase Distinction RGB images
(below) suggested that there was some glaciation of the dominant LES band, as indicated by the shades of yellow to green.

GOES-16 Day Cloud Phase Distinction RGB images [click to play animated GIF | MP4]
————————————————————————
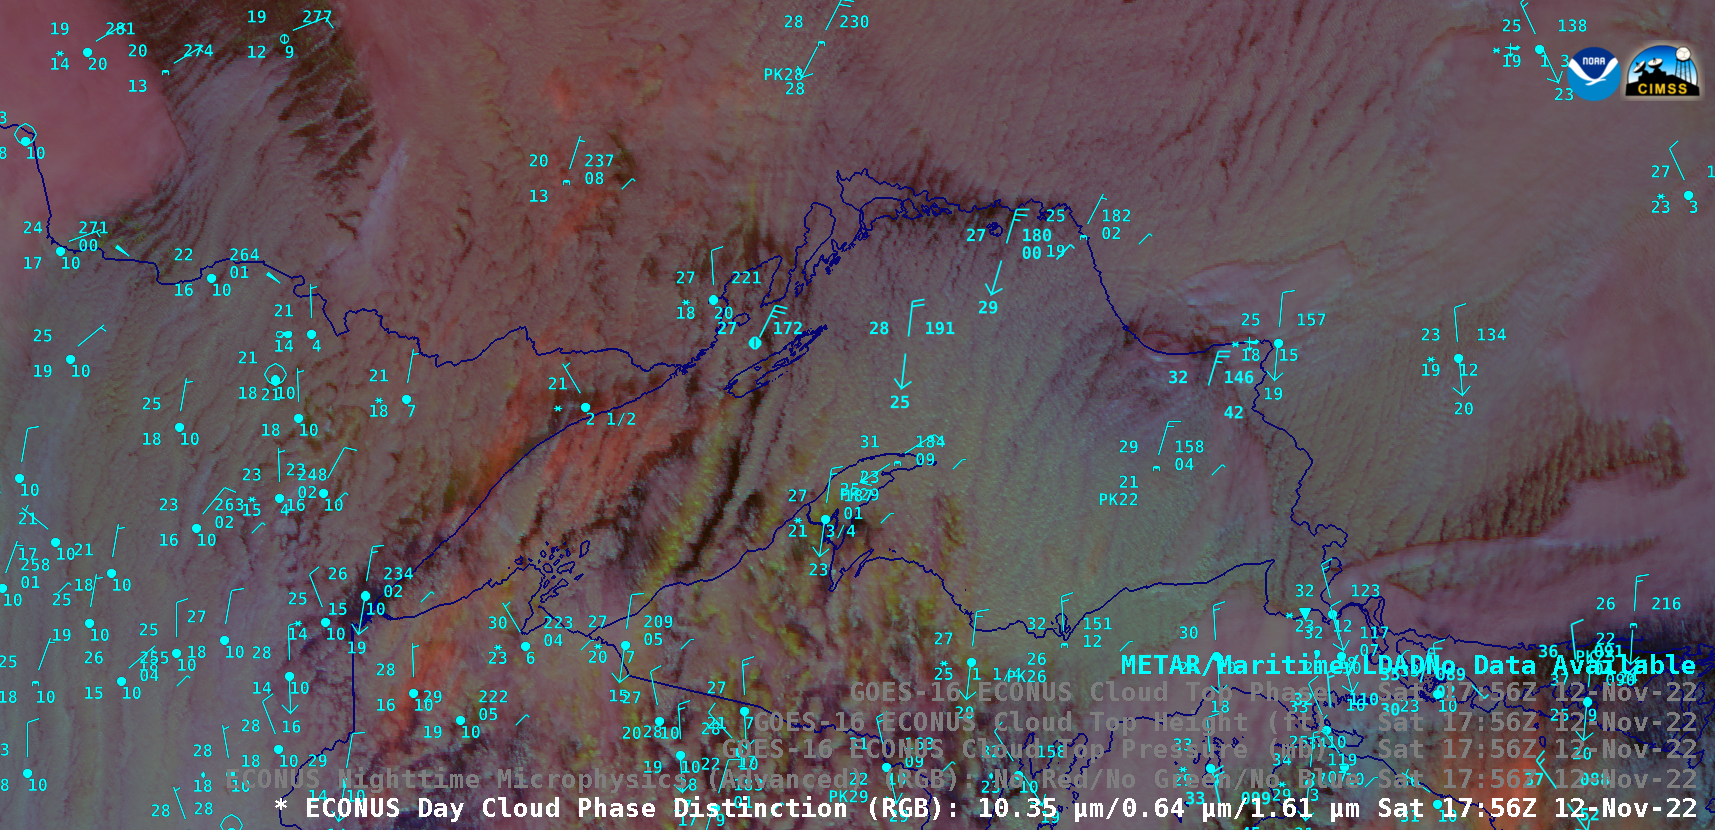
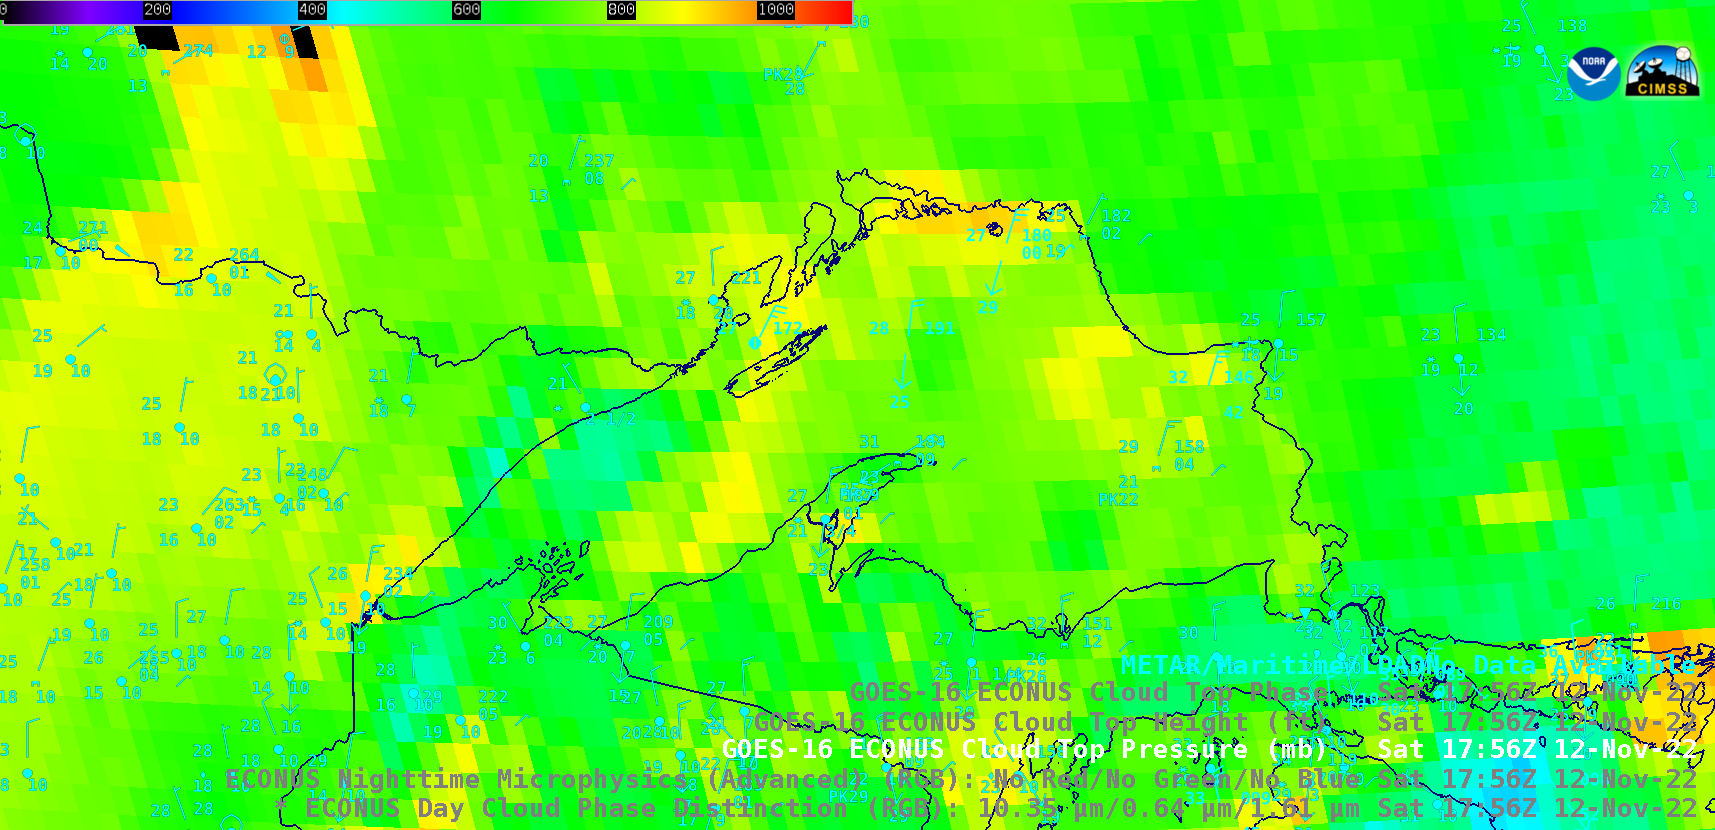
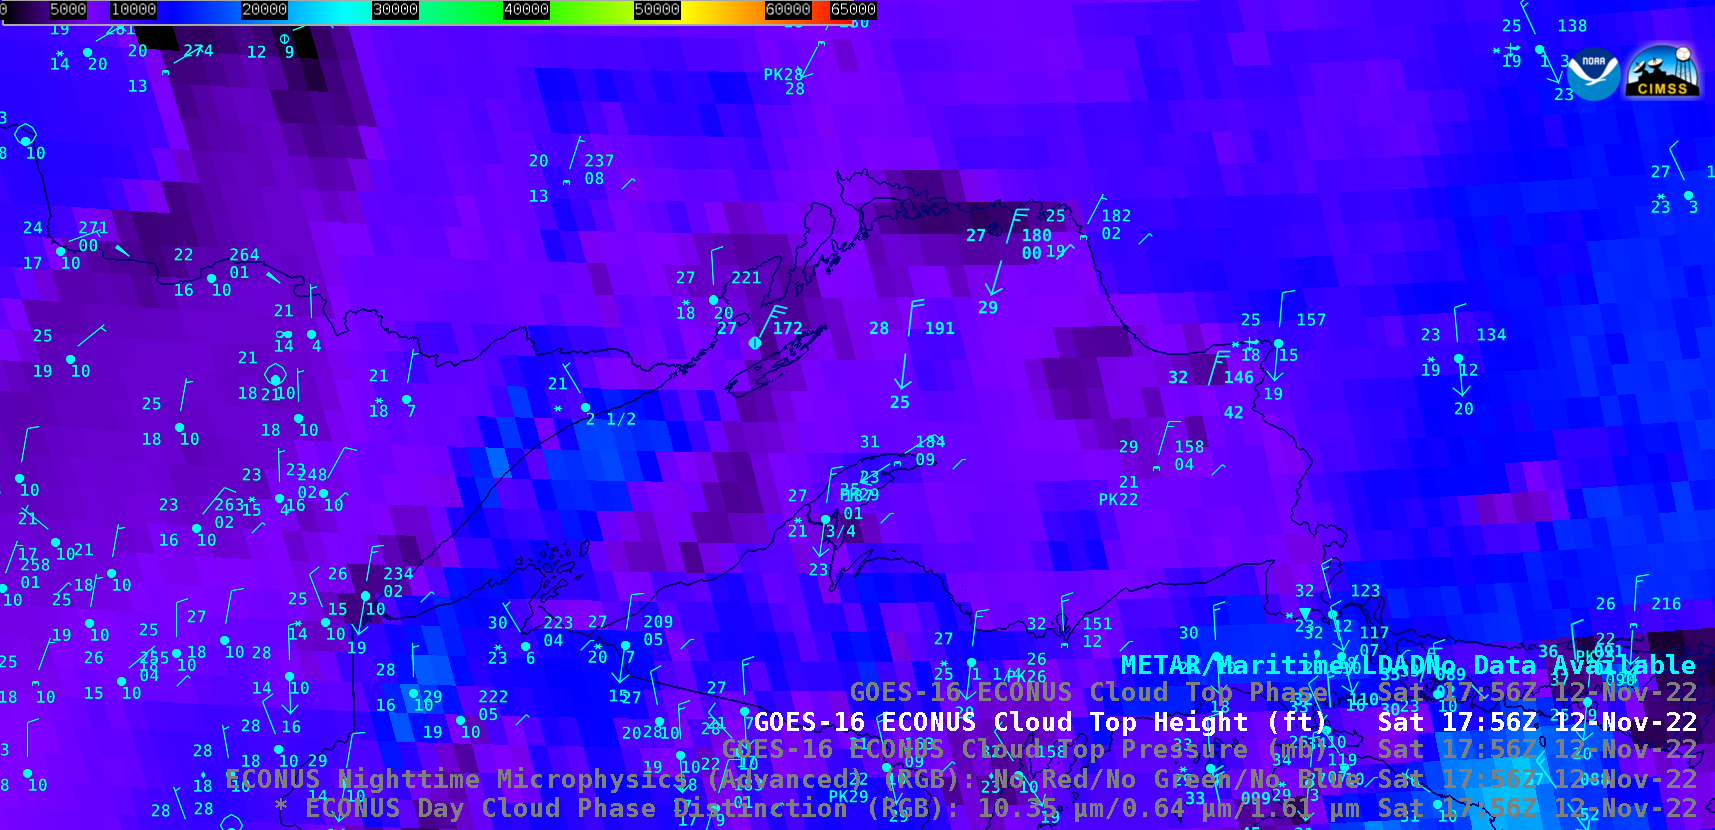
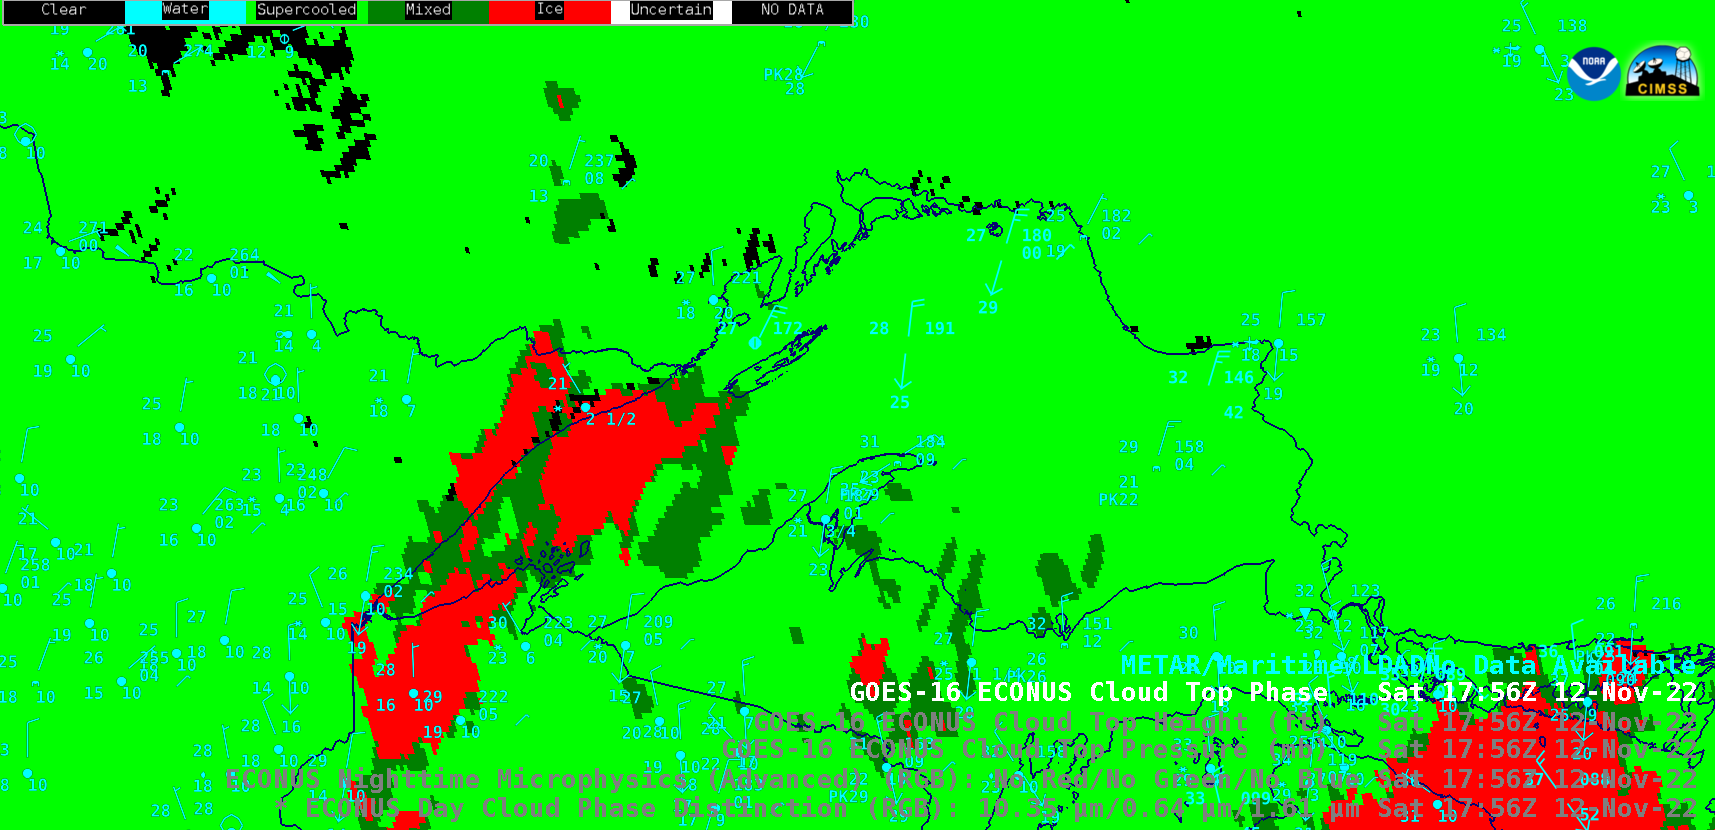
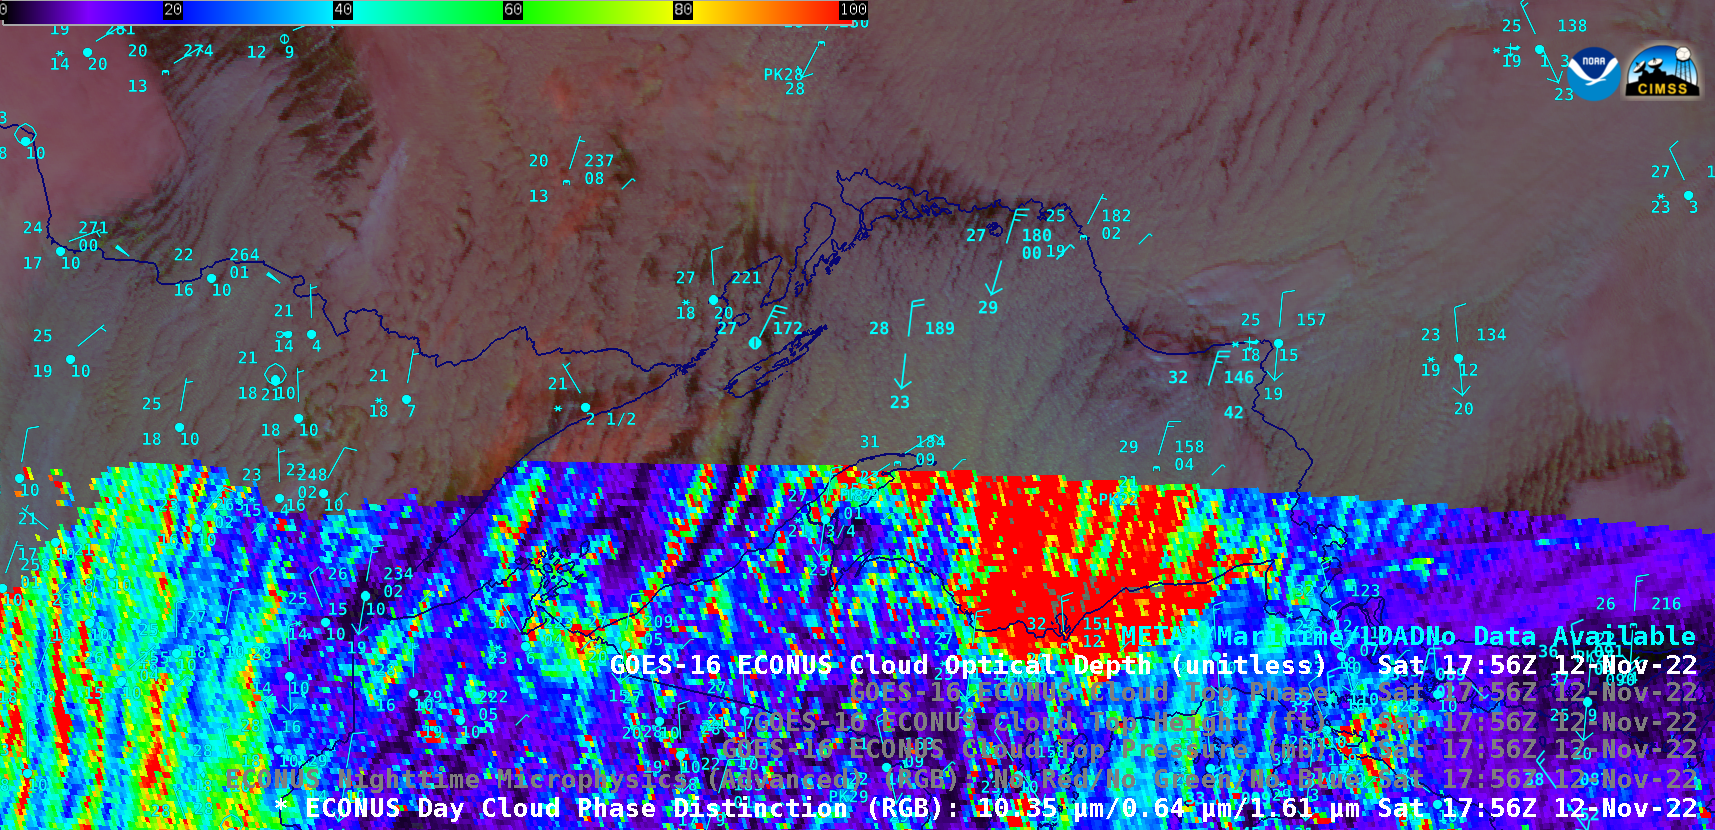
GOES-16 Day Cloud Phase Distinction RGB, Cloud Top Pressure, Cloud Top Height, Cloud Top Phase and Cloud Optical Depth at 1756 UTC [click to enlarge]
A comparison of GOES-16 Day Cloud Phase Distinction RGB,
Cloud Top Pressure,
Cloud Top Height,
Cloud Top Phase and
Cloud Optical Depth at 1756 UTC
(above) highlighted the southern portion of the dominant LES band that produced the heaviest snowfall reports in Upper Michigan and northwestern Wisconsin.
Cursor-sampled values of GOES-16 Day Cloud Phase Distinction RGB components, Cloud Top Pressure, Cloud Top Height and Cloud Top Phase (below) showed typical values of those parameters along the dominant LES band at 1756 UTC.
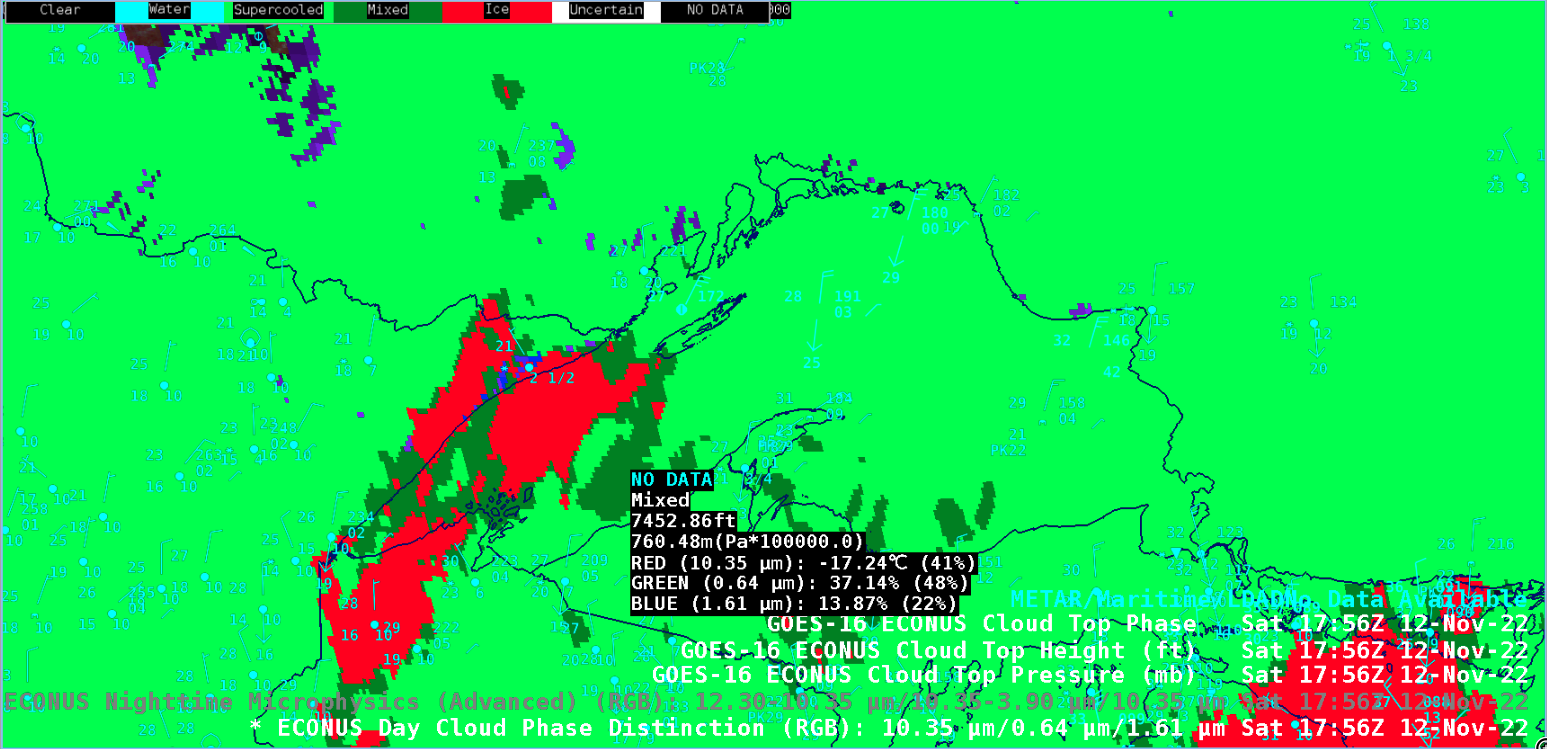
Cursor-sampled values of GOES-16 Day Cloud Phase Distinction RGB, Cloud Top Pressure, Cloud Top Height and Cloud Top Phase at 1756 UTC [click to enlarge]
Cursor-sampled values of Level 2 Derived Products (such as Cloud Top Phase and Cloud Top Height) can also be obtained directly from RGB imagery — in this case, Day Cloud Phase Distinction
(below) — using an AWIPS “Local Menu Items” option, as discussed in this
Satellite Book Club presentation.

GOES-16 Day Cloud Phase Distinction RGB image at 1831 UTC, with cursor-sampled values of Cloud Top Phase (green) and Cloud Top Height (cyan) along with the RGB image components [click to enlarge]
Animations of GOES-16 Cloud Top Pressure, Cloud Top Height, Cloud Top Phase and Cloud Optical Depth derived products during the period from 0001-1956 UTC on 12 November are shown below. Note that Cloud Optical Depth values are only displayed across the southern part of the satellite scene, since the operational version of this product is only created for pixels having a local solar zenith angle of 65 degrees or less (and the November sun angle was low across that region).
GOES-16 Cloud Top Pressure derived product [click to play animated GIF | MP4]
GOES-16 Cloud Top Height derived product [click to play animated GIF | MP4]
GOES-16 Cloud Top Phase derived product [click to play animated GIF | MP4]
GOES-16 Day Cloud Phase Distinction RGB images, with an overlay of the GOES-16 Cloud Optical Depth derived product [click to play animated GIF | MP4]
View only this post
Read Less


