
1-minute Mesoscale Domain Sector GOES-16 (GOES-East) “Red” Visible (0.64 µm) images (above) showed a supercell thunderstorm that produced a tornado, hail as large as 5.00 inches in diameter and wind gusts to 100 mph (SPC Storm Reports | NWS Aberdeen summary) in central South Dakota during the late afternoon and early evening hours on 18 July 2023. Several pulses of overshooting tops... Read More
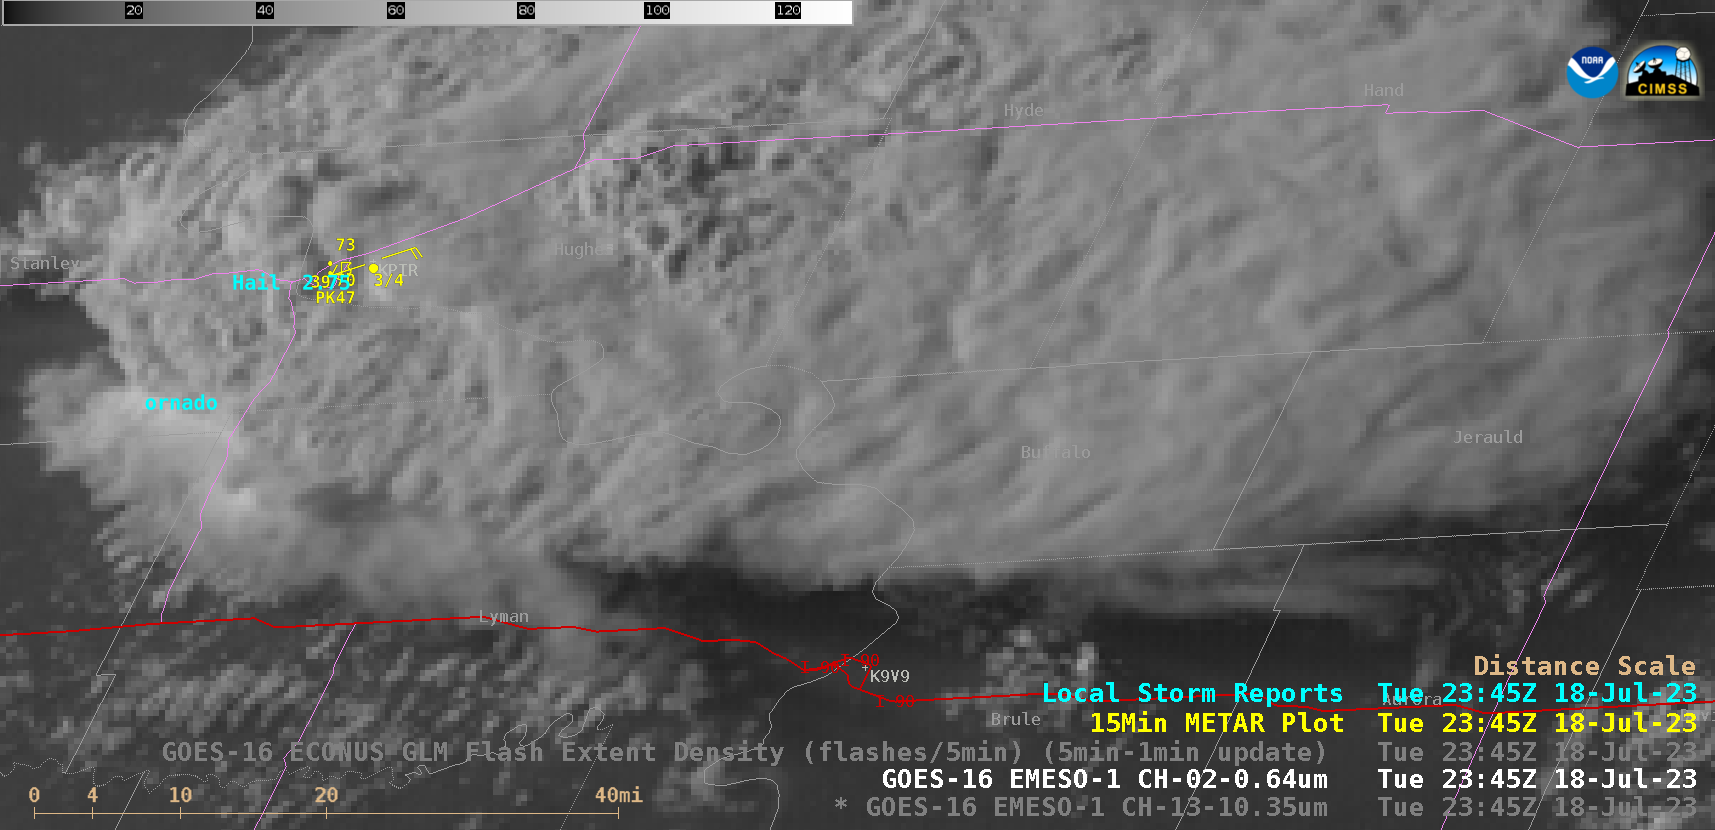
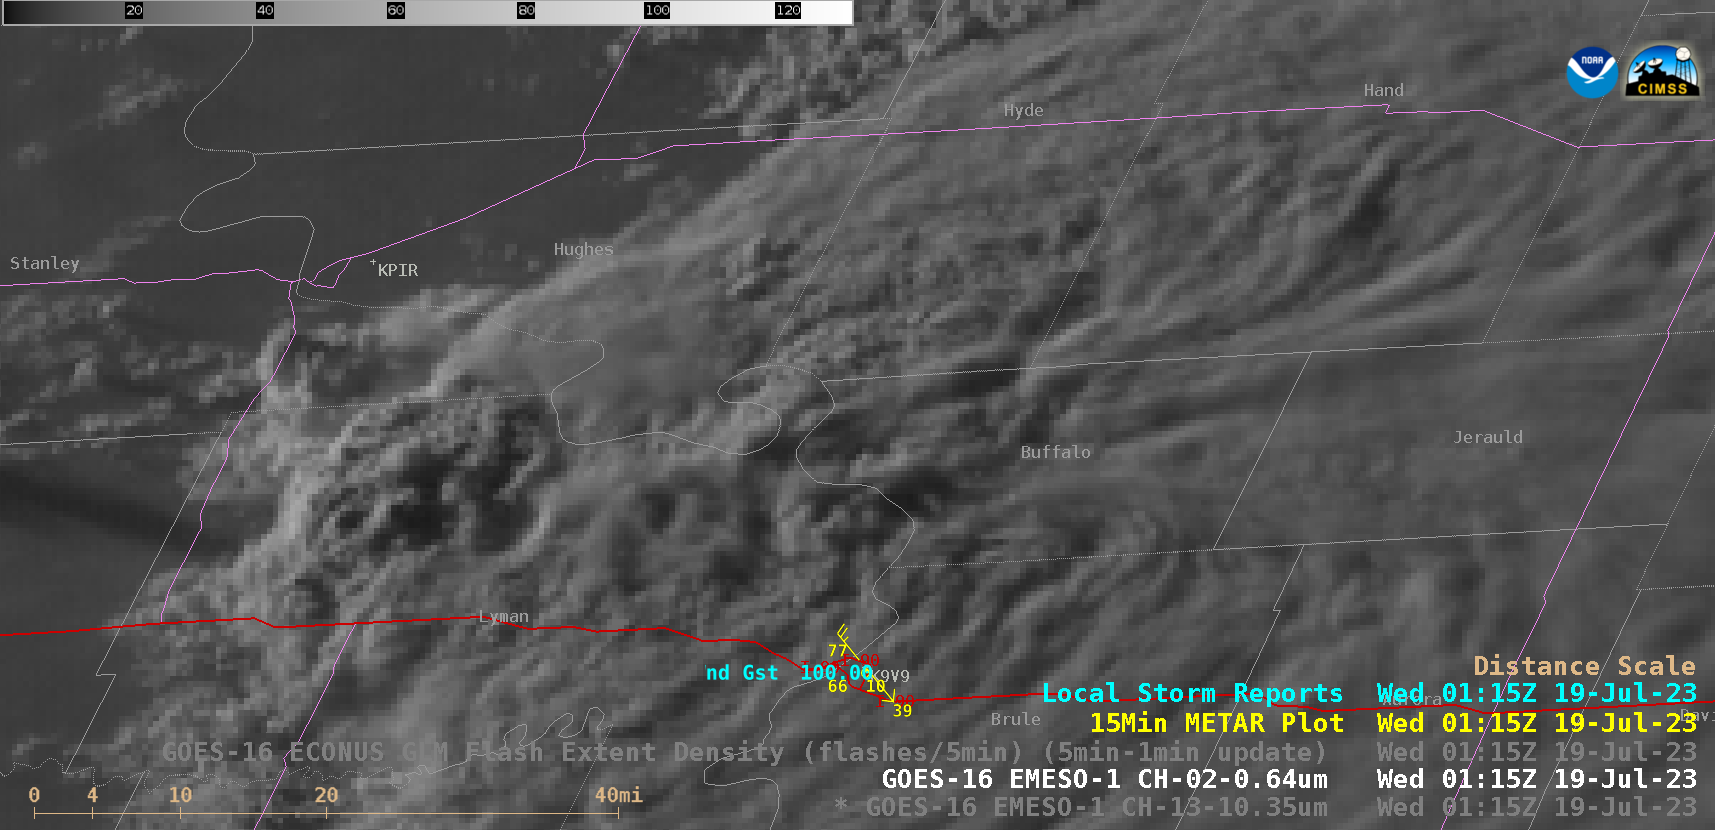
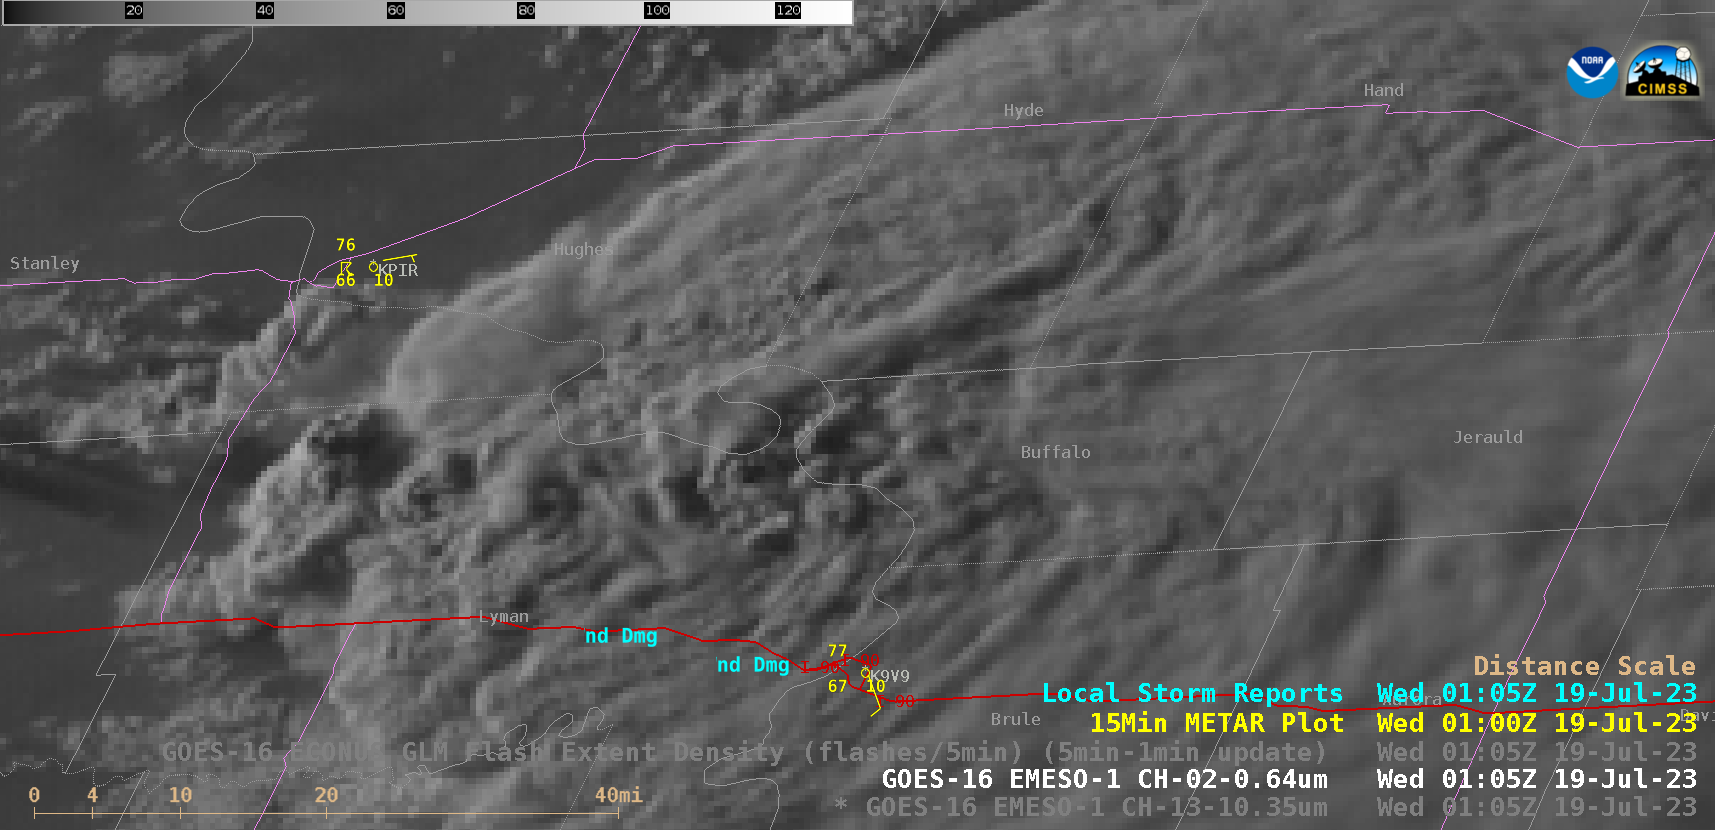
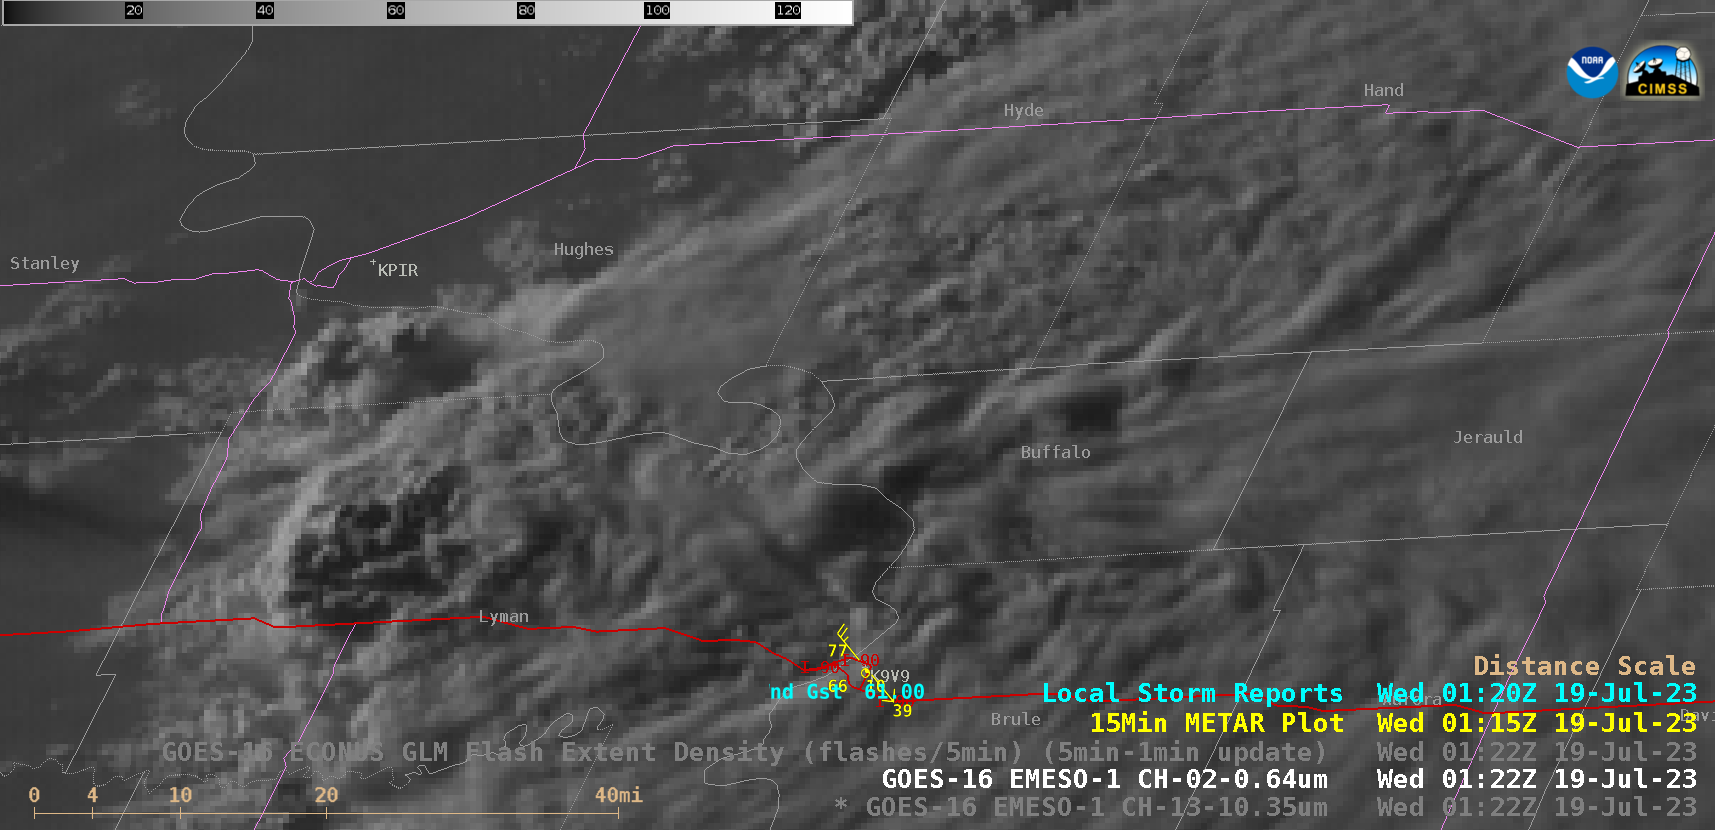
GOES-16 “Red” Visible (0.64 µm) images, with plots of Local Storm Reports (cyan), 15-minute METAR surface reports (yellow), Interstate Highways (red) and State Highways (violet) [click to play animated GIF | MP4]
1-minute
Mesoscale Domain Sector GOES-16
(GOES-East) “Red” Visible (
0.64 µm) images
(above) showed a supercell thunderstorm that produced a tornado, hail as large as 5.00 inches in diameter and wind gusts to 100 mph (
SPC Storm Reports |
NWS Aberdeen summary) in central South Dakota during the late afternoon and early evening hours on
18 July 2023. Several pulses of overshooting tops were evident in the visible imagery, an indicator of vigorous thunderstorm updrafts. It bears mention that 10 minutes prior to the 100 mph wind gust (at
0115 UTC), there were reports of semi trucks overturned by strong winds along Interstate 90 (in eastern Lyman County at
0105 UTC). The peak wind gust at nearby Chamberlain (
K9V9) was 53 knots (61 mph) at
0122 UTC.
In the corresponding 1-minute GOES-16 “Clean” Infrared Window (10.3 µm) images (below), the coldest thunderstorm overshooting tops exhibited infrared brightness temperatures around -70ºC (brighter white pixels embedded within dark black regions).
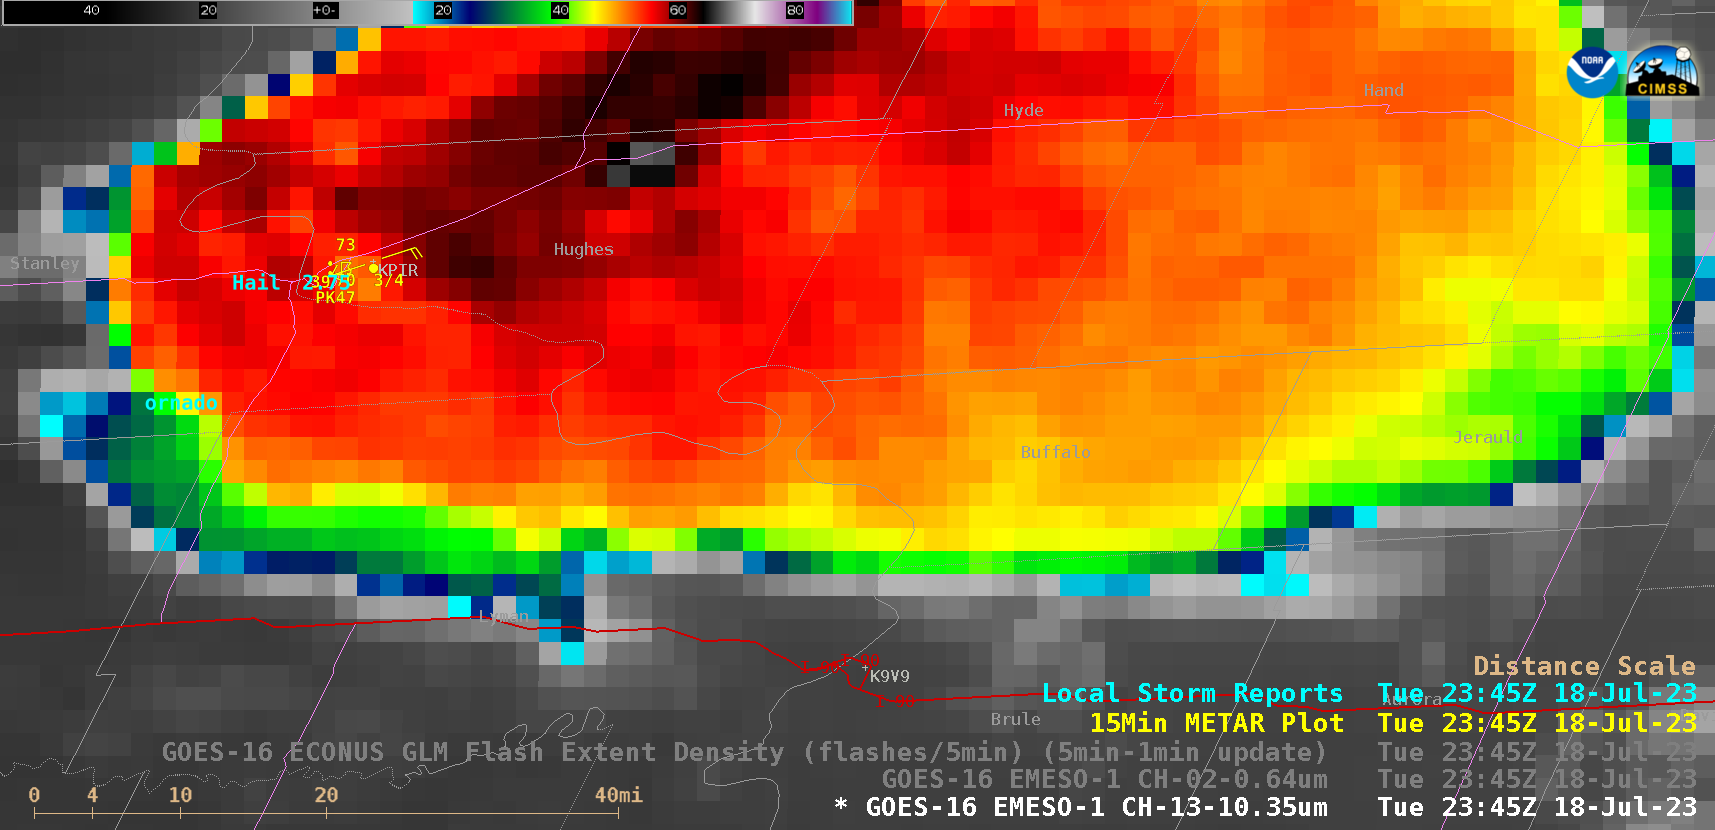
GOES-16 “Clean” Infrared Window (10.3 µm) images, with plots of Local Storm Reports (cyan), 15-minute METAR surface reports (yellow), Interstate Highways (red) and State Highways (violet) [click to play animated GIF | MP4]
A closer view of Infrared imagery at 2347 UTC
(below) revealed that a report of 4.50″ diameter hail occurred within a cluster of 2 other reports of 2.75″ diameter hail just southwest of Pierre (KPIR) — in fact, with further evidence the size of that largest hail was later upgraded to
5.00 inches (which was a record hail size for Hughes County in South Dakota:
media report).
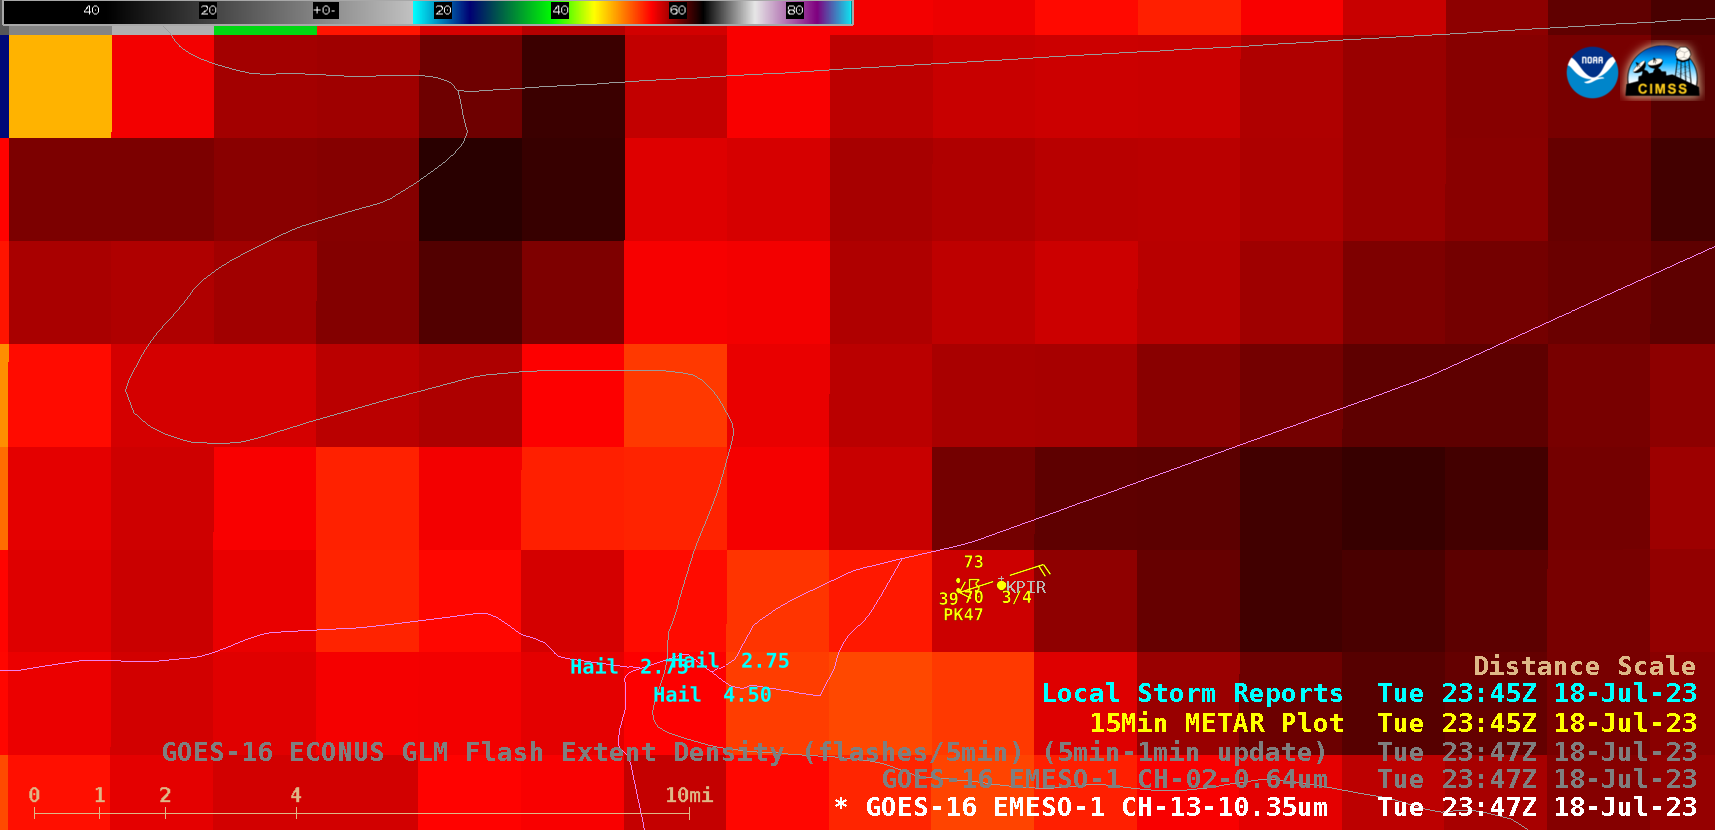
GOES-16 “Clean” Infrared Window (10.3 µm) image at 2347 UTC, with Local Storm Reports plotted in cyan [click to enlarge]
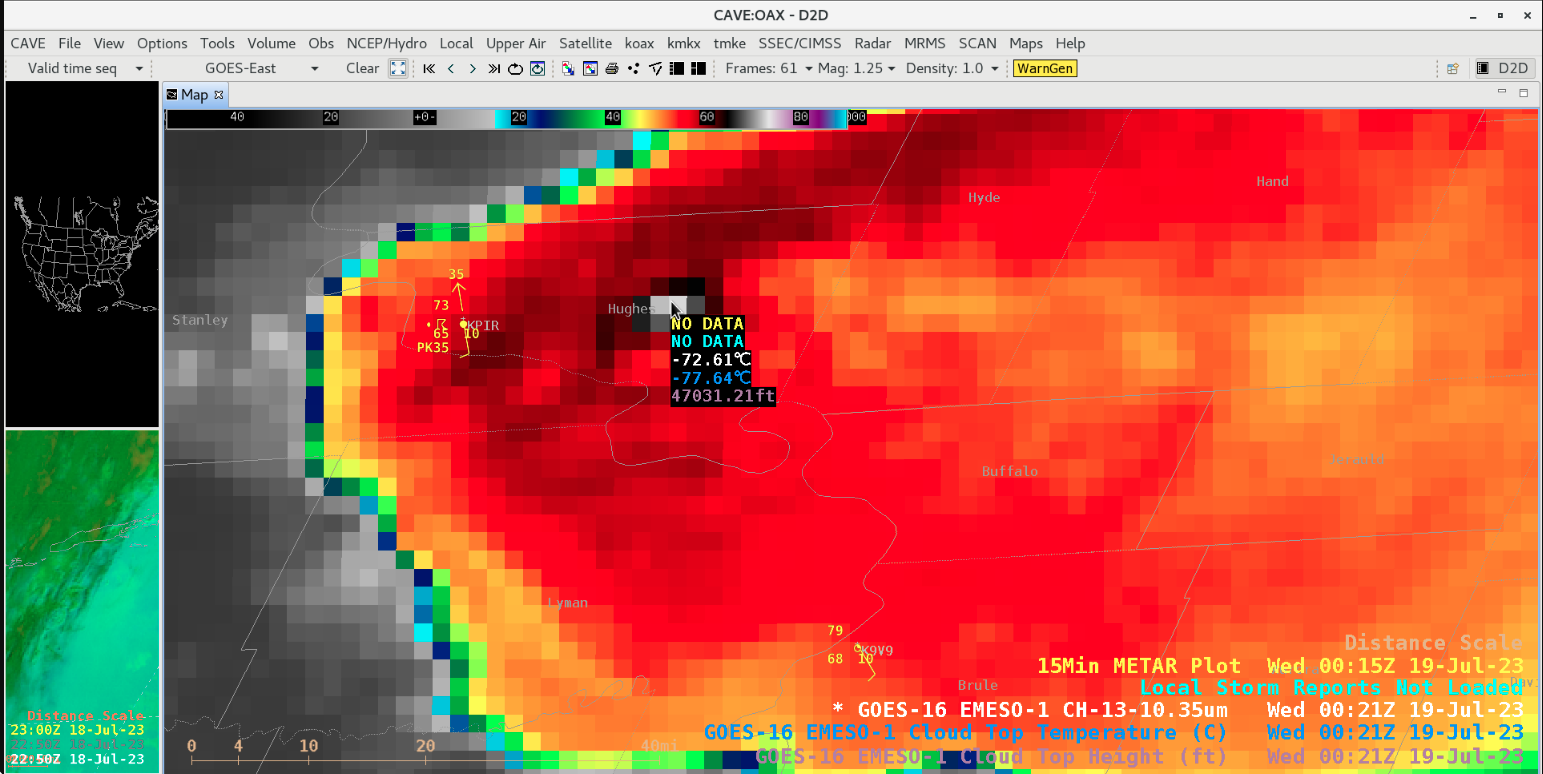
Cursor sample of GOES-16 infrared (10.3 µm) brightness temperature, Cloud Top Temperature and Cloud Top Height derived products at 0021 UTC [click to enlarge]
A cursor sample of GOES-16 infrared (10.3 µm) brightness temperature,
Cloud Top Temperature and
Cloud Top Height derived products at 0021 UTC
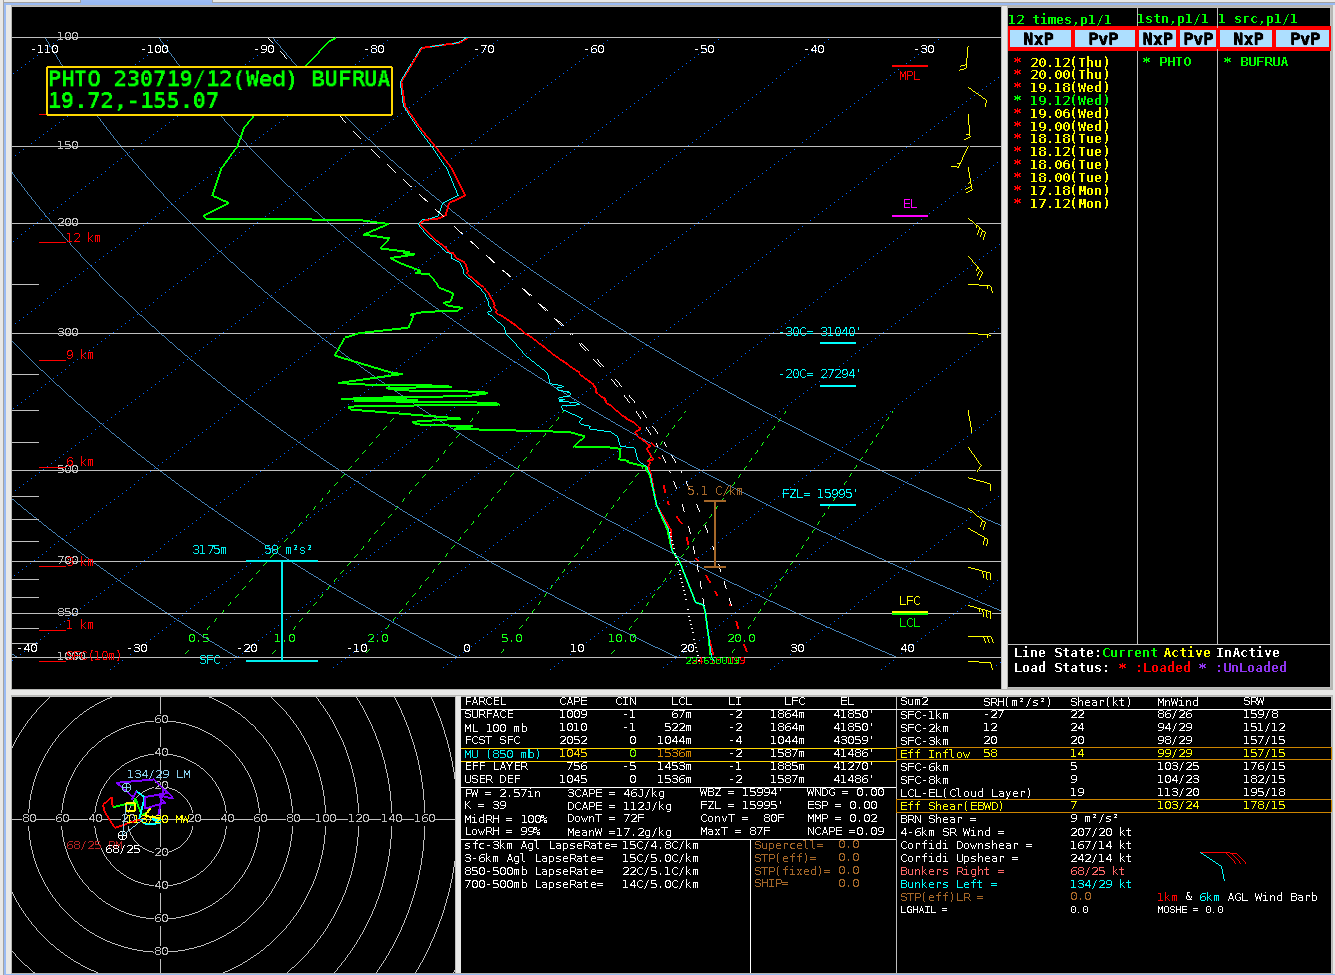
(above) displayed values of -72.61ºC, -77.64ºC and 47031.21 feet, respectively — these Cloud Top Temperature and Cloud Top Height values were similar to those of a Most Unstable (MU) air parcel’s Maximum Parcel Level (MPL), calculated using 0000 UTC
rawinsonde data (
source) from Aberdeen SD
(below).
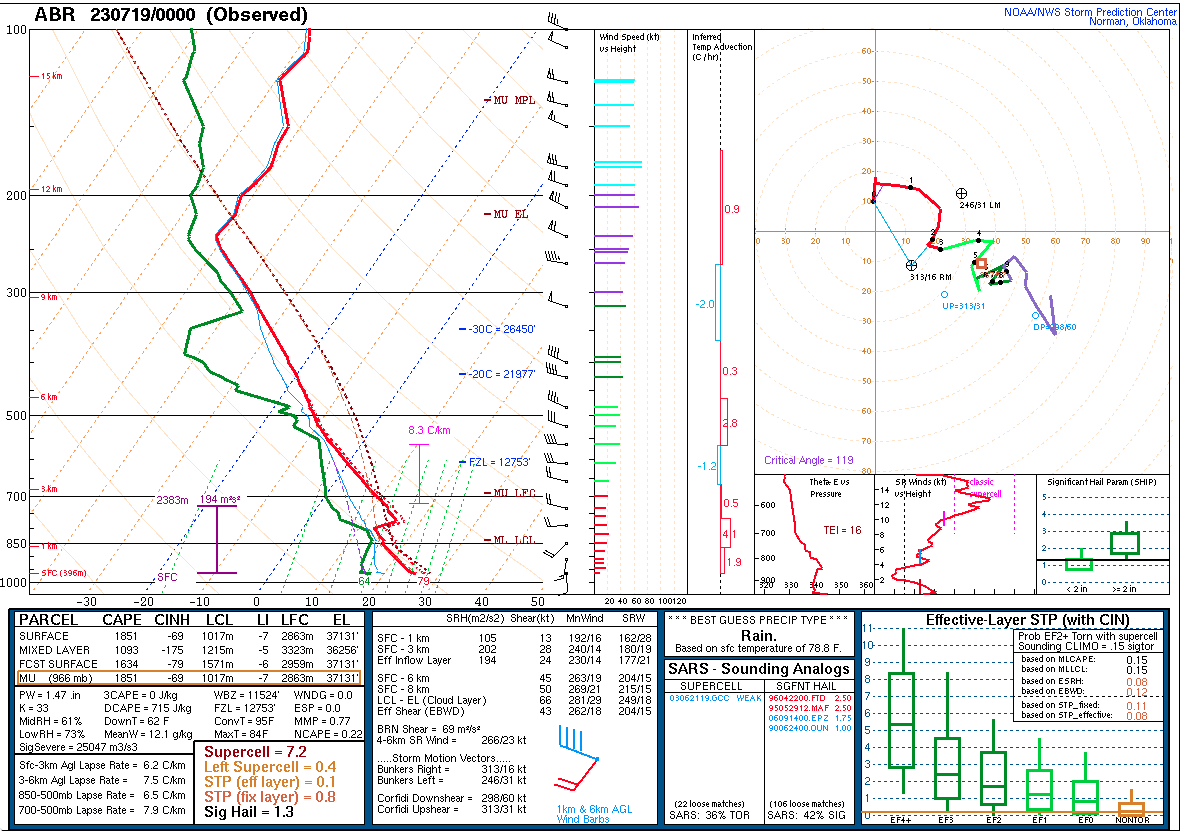
Plot of rawinsonde data from Aberdeen SD at 0000 UTC [click to enlarge]
1-minute GOES-16 Visible images with an overlay of
GLM Flash Extent Density (below) showed modest lightning activity with this thunderstorm, with a number of minor lightning jumps during that time period.
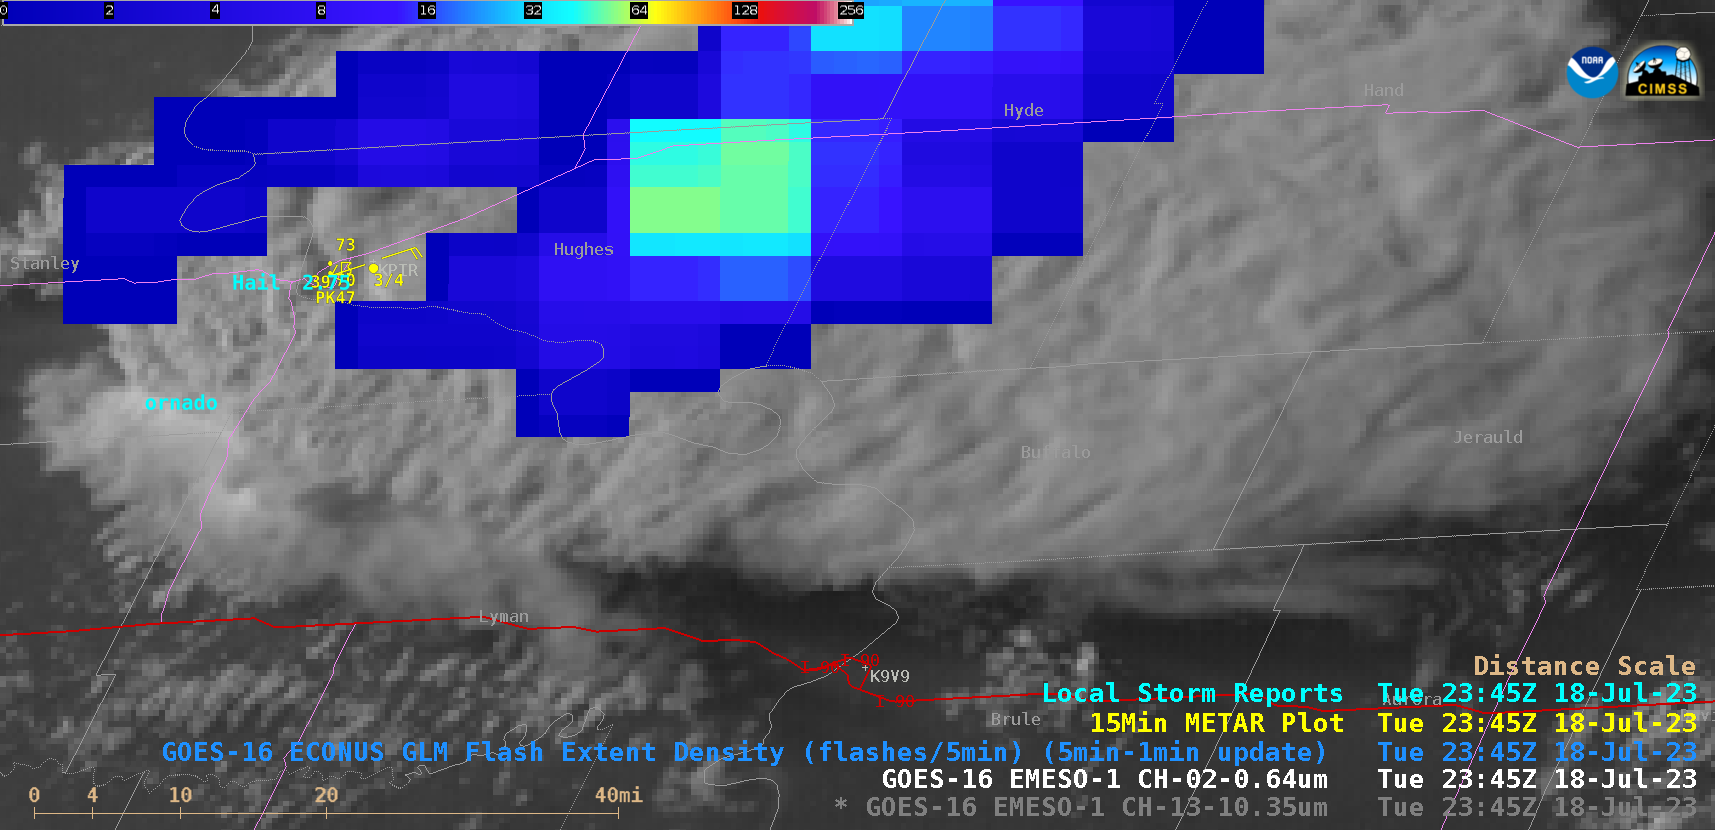
GOES-16 “Red” Visible (0.64 µm) images, with an overlay of GLM Flash Extent Density [click to play animated GIF | MP4]
In a larger-scale view of GOES-16 Infrared and Visible images
(below), the signature of an Above-Anvil Cirrus Plume (
reference |
VISIT training) was evident in the Visible imagery (but was more subtle in the Infrared imagery).
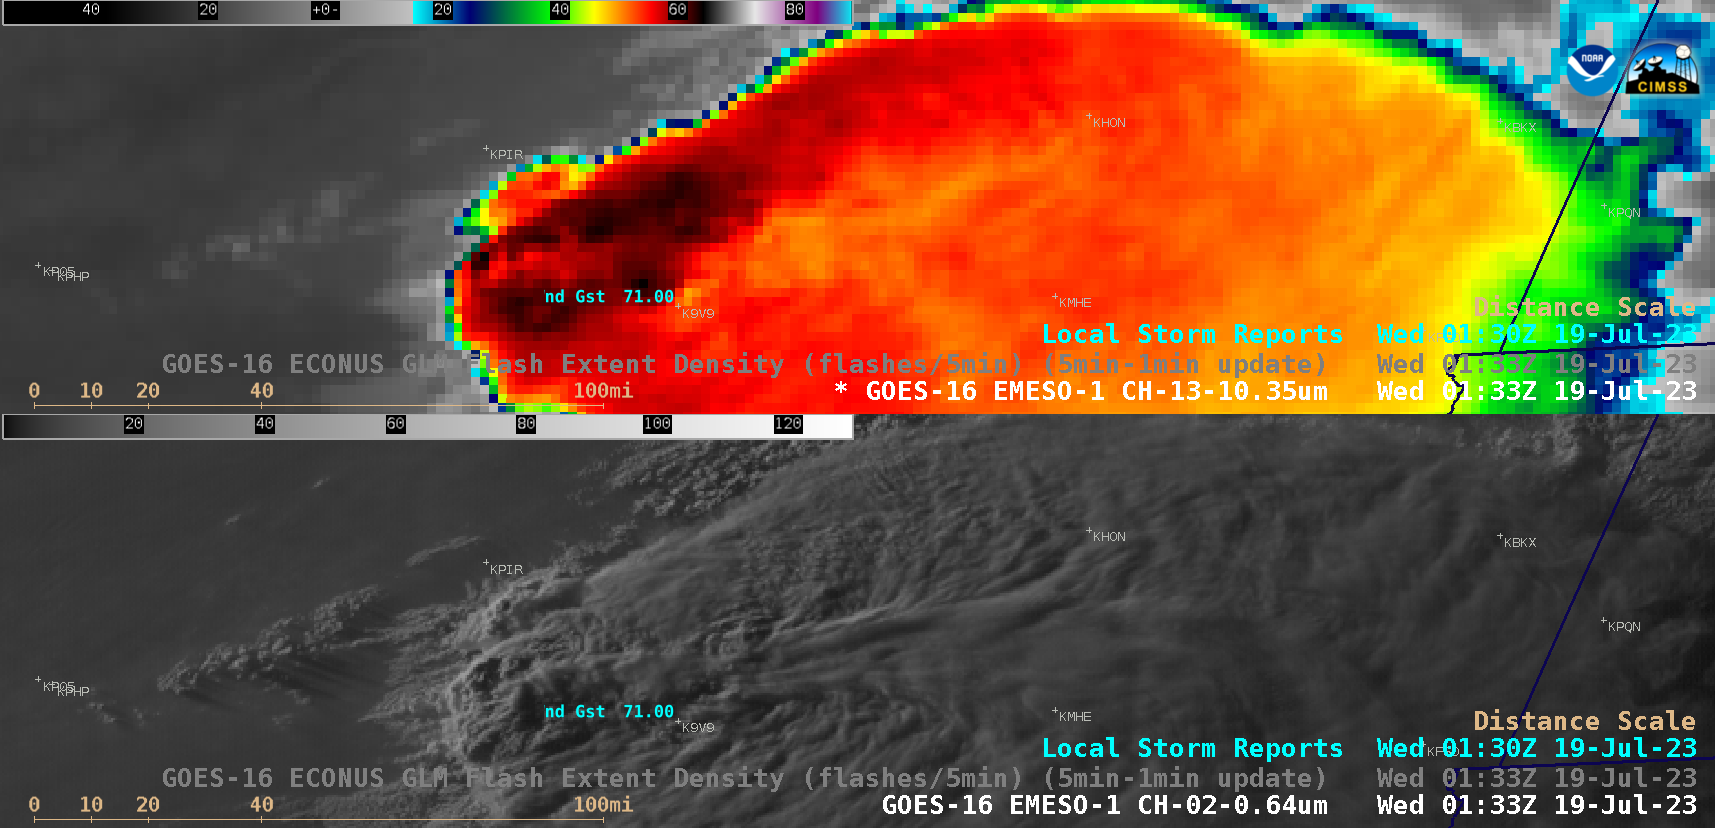
GOES-16 Infrared (top) and Visible (bottom) images, with Local Storm Reports potted in cyan [click to play animated GIF | MP4]
The supercell thunderstorm developed within a corridor of instability and moisture that existed in the warm sector between a cold front and a warm front (
surface analyses) — as seen in GOES-16
Convective Available Potential Energy (CAPE), Lifted Index and
Total Precipitable Water derived products
(below). CAPE values were around 1900 J/kg, Lifted Index values were around -7ºC and Total Precipitable Water values were around 1.6 inches.
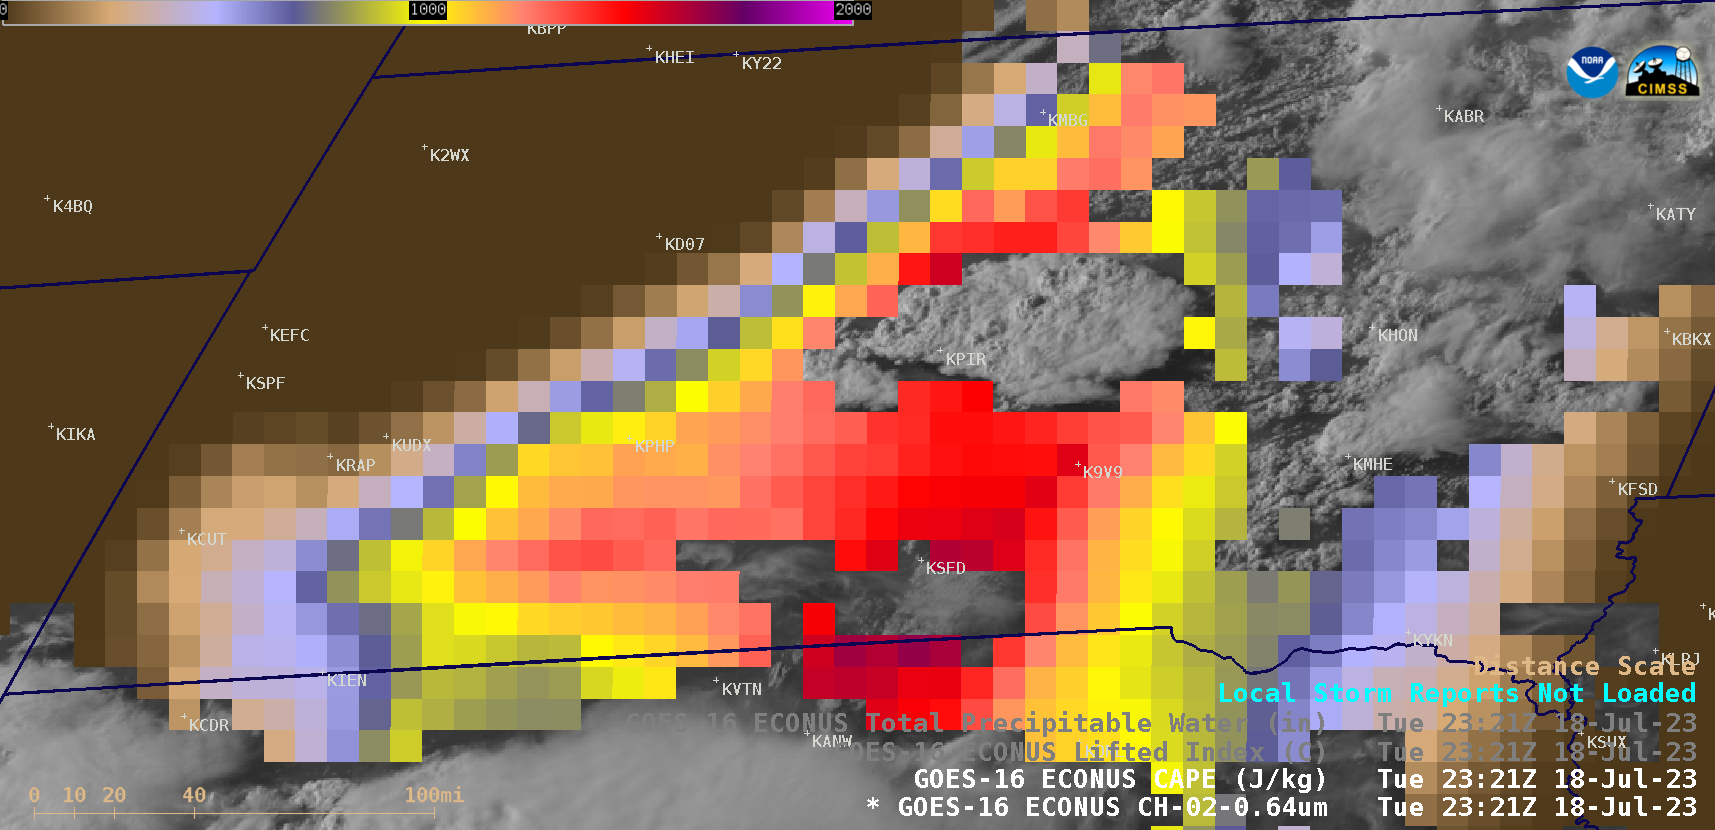
GOES-16 Visible images with an overlay of the CAPE derived product [click to play animated GIF | MP4]
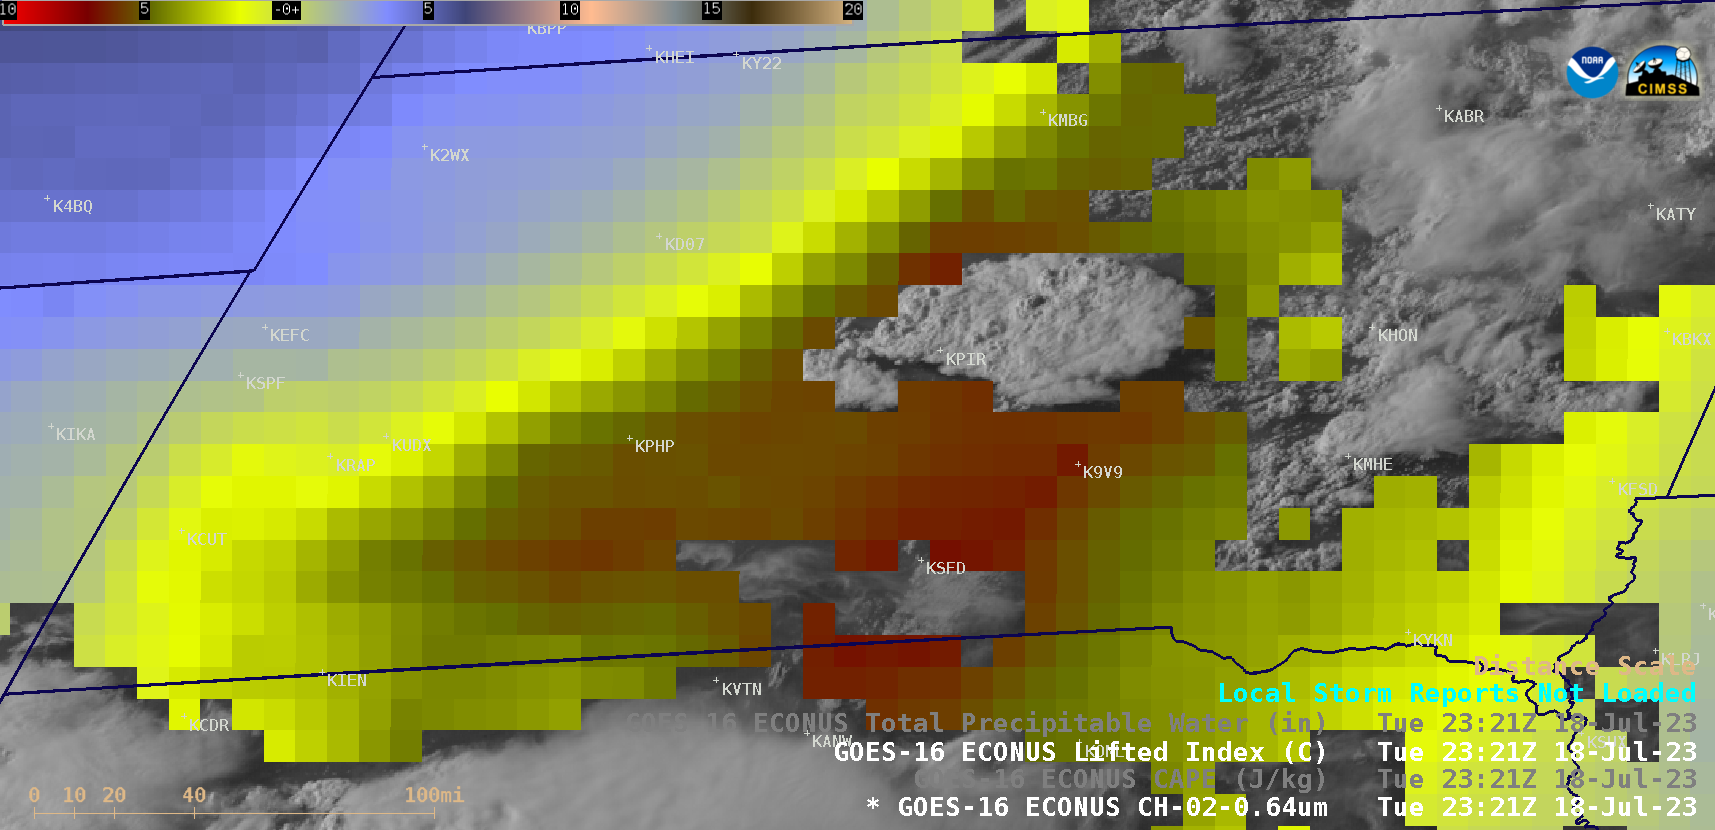
GOES-16 Visible images with an overlay of the Lifted Index derived product [click to play animated GIF | MP4]
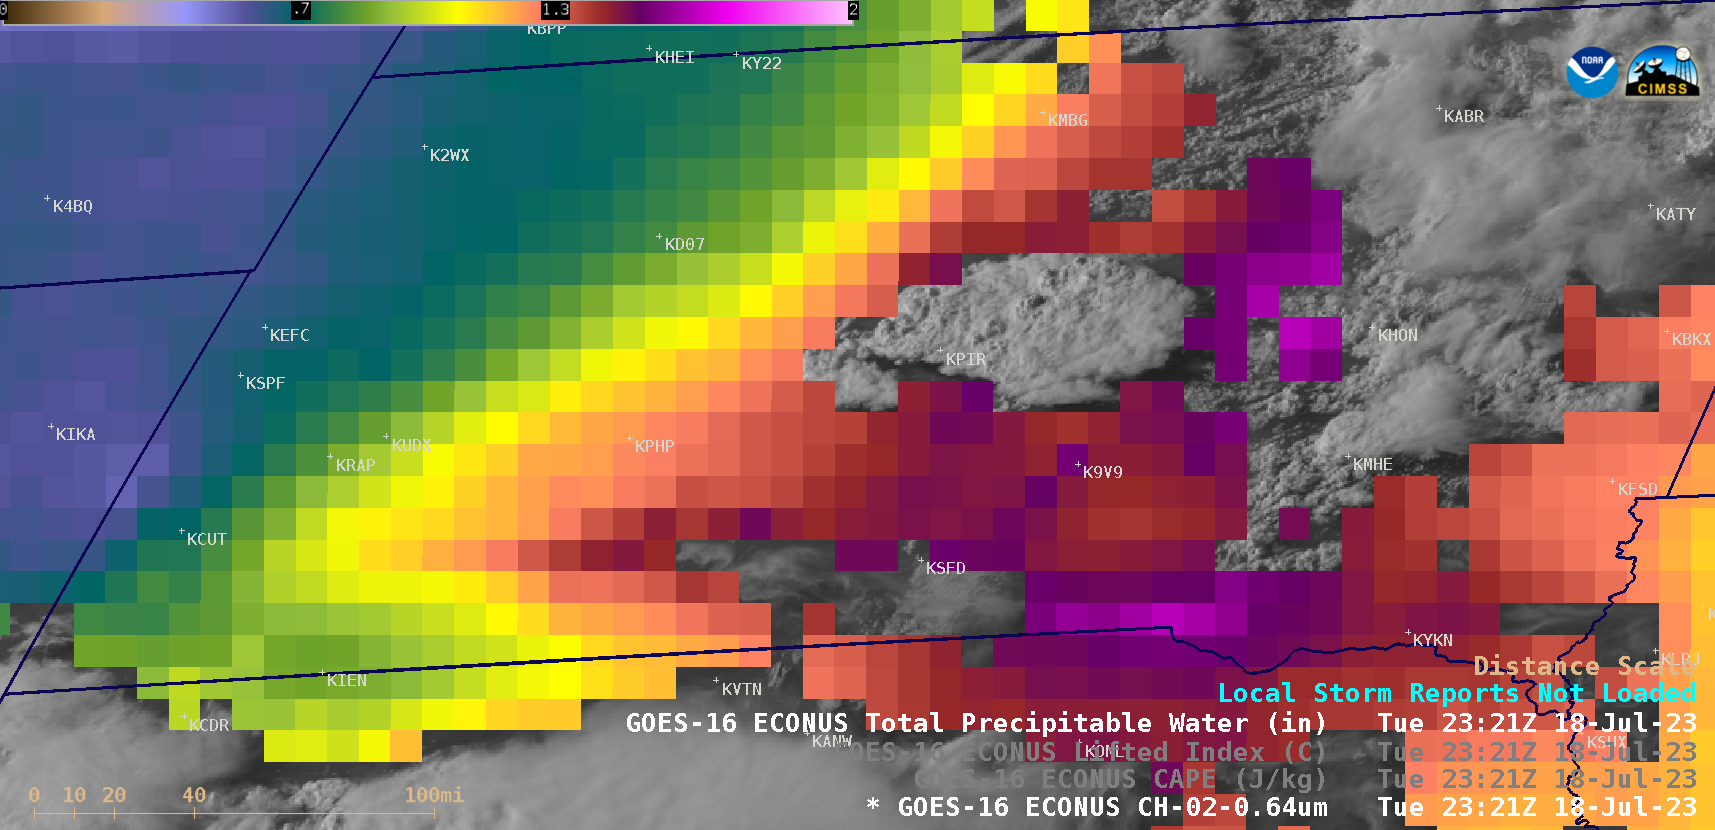
GOES-16 Visible images with an overlay of the Total Precipitable Water derived product [click to play animated GIF | MP4]
View only this post
Read Less

