

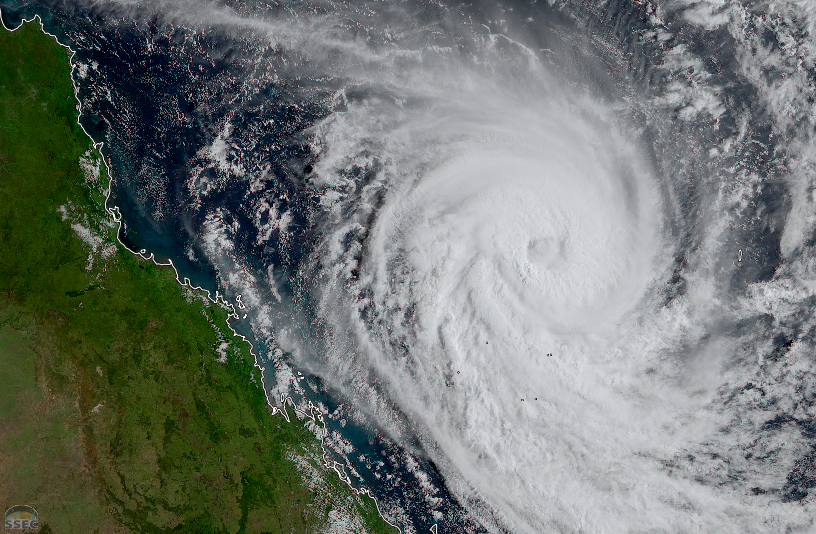
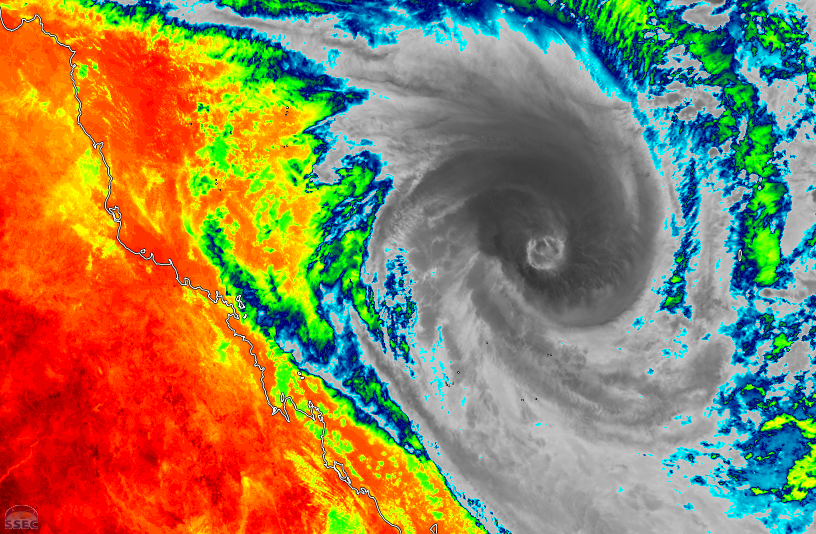
GOES-18 infrared imagery, above, shows a cyclonic circulation over the northeastern Gulf of Alaska. Shower development is suggested by the evolution of brightness temperatures changing from cyan to blue to green (showing cooling); showers then dissipate as the brightness temperatures warm. Do you think these are showers of rain or of snow? Note in particular the motion of the clouds over Prince of Wales island, the southernmost large island of the southeast Alaskan archipelago, just north of Haida Gwaii (formerly called Queen Charlotte island) that is at the southern edge of the domain. Cloud motion is parallel to the development of colder cloud tops.
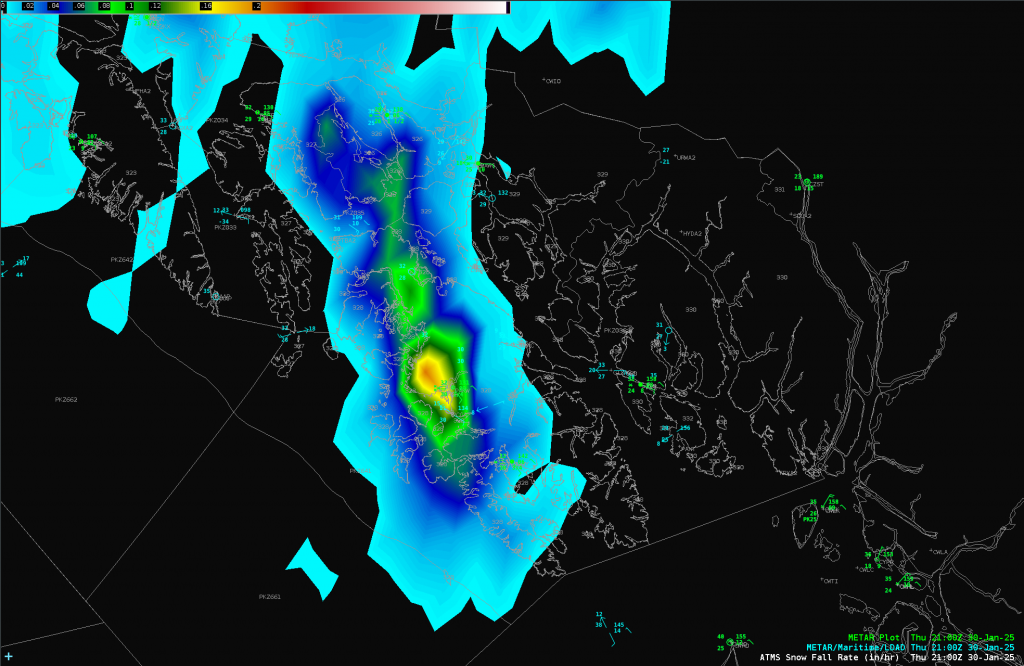
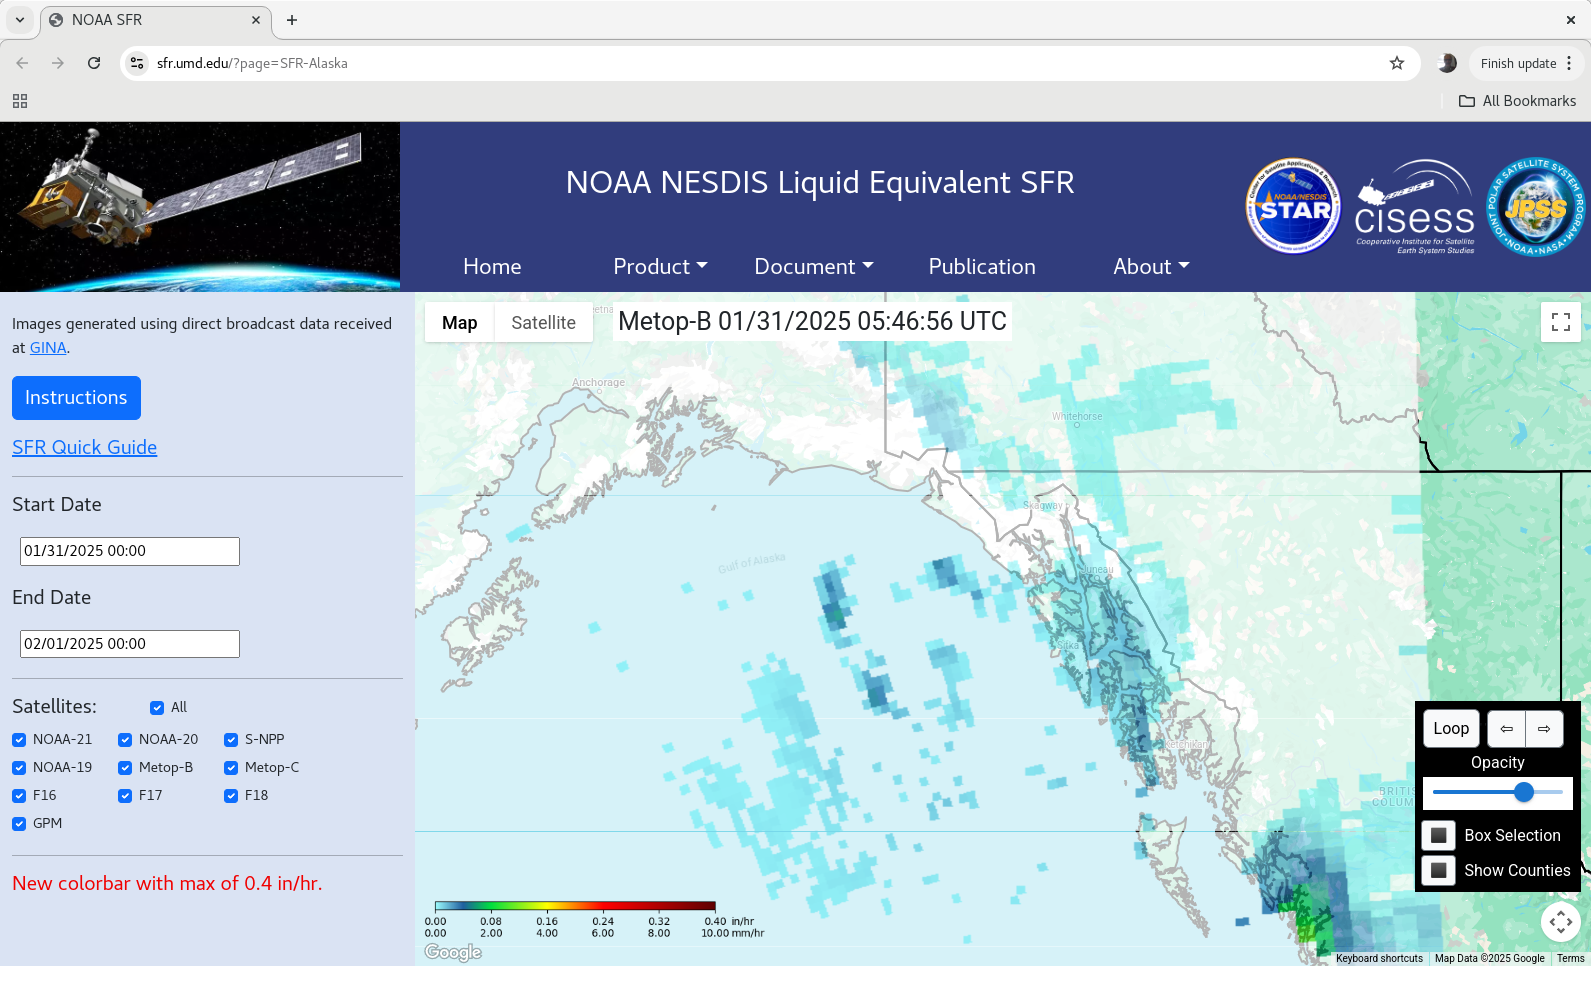
Microwave sounder data are used to estimate snowfall rates (SFR), and those estimates are available at this website; additionally SFR is inserted into Alaska Region AWIPS. Because microwave sounder data are available from many different polar orbiting satellites, coverage over Alaska can be quite solid. In particular, a cluster of observations comes in from NOAA-19 and Metop satellites; then a second cluster of observations occurs thanks to NOAA-20/NOAA-21 observations.
For this event, training convective snow showers spread over Prince of Wales Island allowing regions to receive around 8 inches of snow at sea level and over 15 inches of snow at higher elevations (as predicted well by forecast models). Satellite SFR products showed the convective snow showers over the southern Gulf of Alaska before they moved over the island and produced 1”/hour snowfall rates with visibilities of less than a quarter mile. The animation above shows the estimates during the day on 30 January; the animation below focuses on times after 1900 UTC. This case demonstrates how model information can raise situational awareness for incoming adverse weather (in the near term), and satellite information can confirm its existence in the short term as well as aid forecasters in making operational decisions to notify the public. Note how the SFR persistently identifies a snowband over Prince of Wales Island, something that continues through at least 0500 UTC on 31 January!
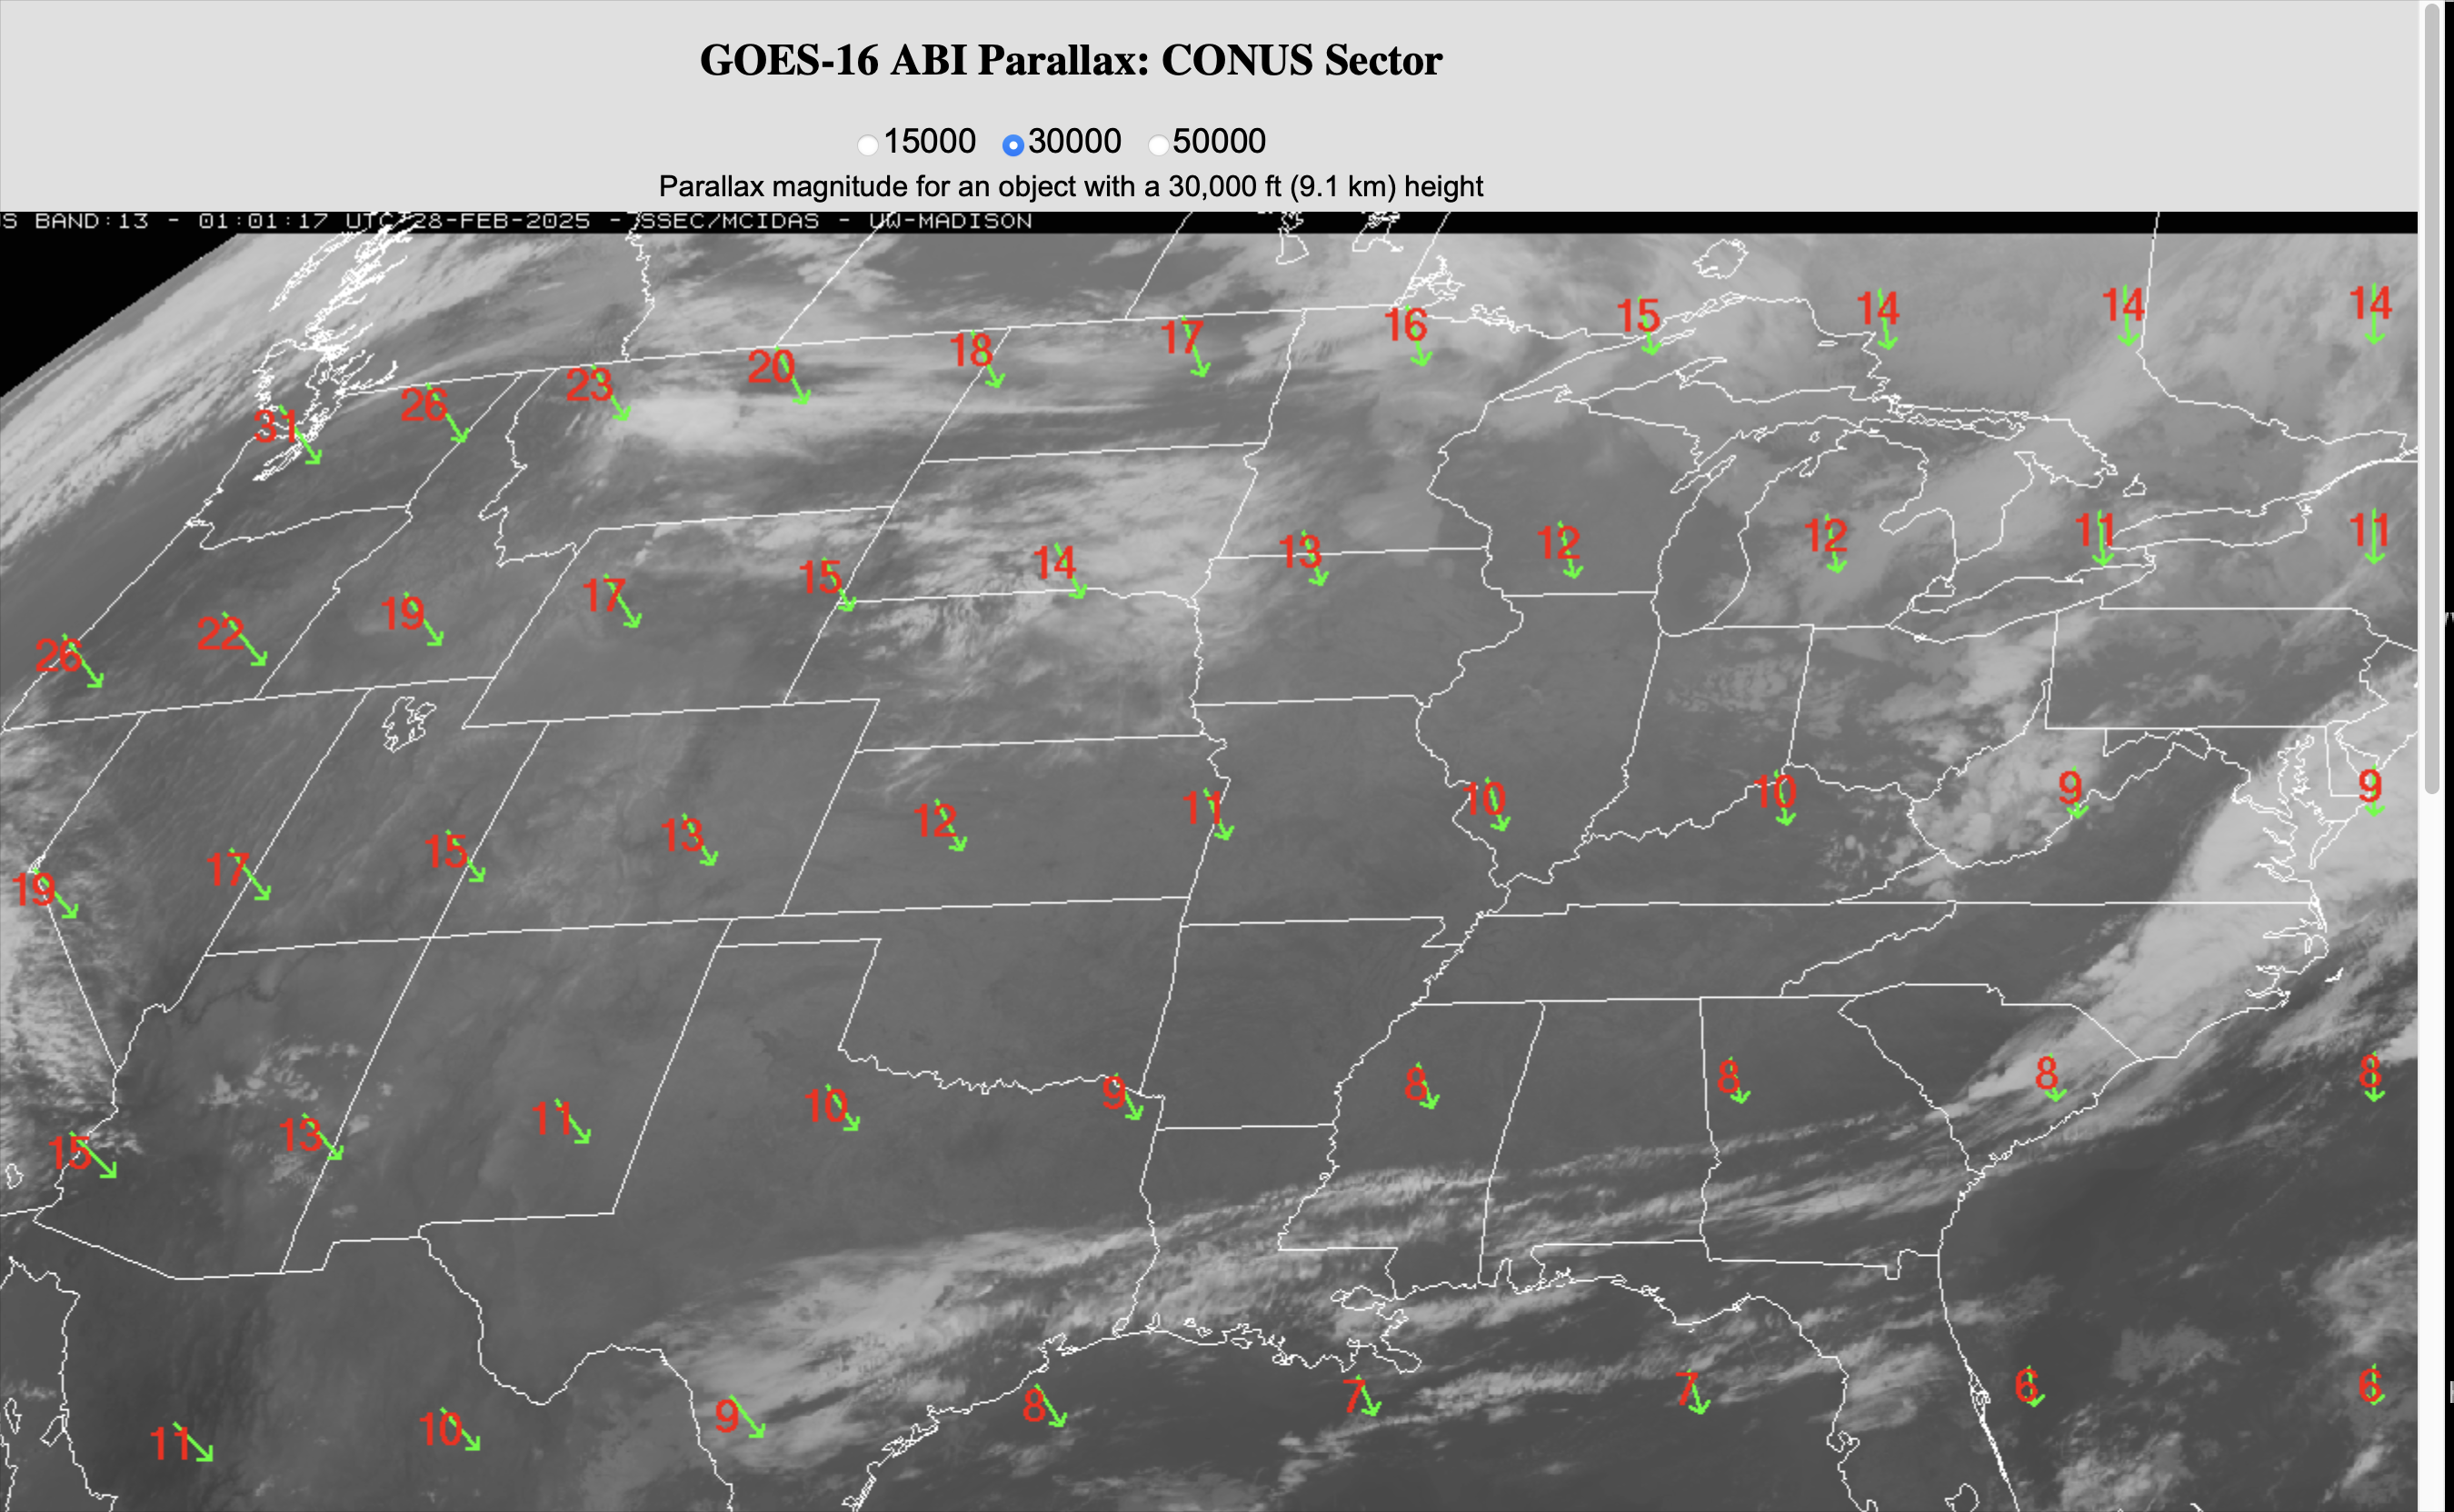
Many thanks to Spencer Fielding, WFO Juneau, for alerting me to this event. A comparison between Microwave snowfall rates and radar observations over CONUS is here. Note in particular how the width of a snowband might be overestimated by the large microwave footprint!
View only this post Read Less


