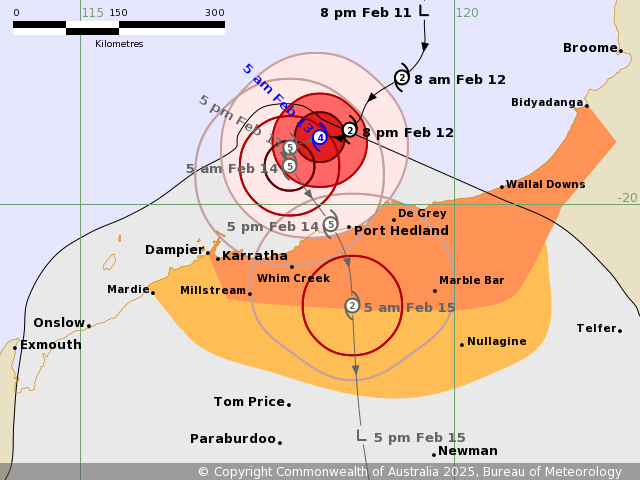
Severe Tropical Cyclone Zelia Hits Australia
Overnight in the eastern Indian ocean, a tropical storm underwent significant deepening to become Severe Tropical Cyclone Zelia. The name “tropical cyclone” might make one think of a comparatively weak storm compared to a hurricane, but that is because the names of these systems vary depending on the part of the world they take place. There’s no functional different between a hurricane, typhoon, or severe tropical cyclone, just a different ocean basin where they can be found. The category rankings are the same for all tropical cyclones, and as of sunrise on 13 February, it had become a Catergory 4 storm, with winds over 209 km/h (130 mph). Forecasts from the Australian Bureau of Meteorology indicate that it will continue to strengthen to a Category 5 system before taking a sharp left hand turn and heading south. Zelia is currently lashing the coast with winds and rain as it strengthens, and because of some locations will be under this system for many hours, some rainfall forecasts are in excess of 50 cm (20 inches).
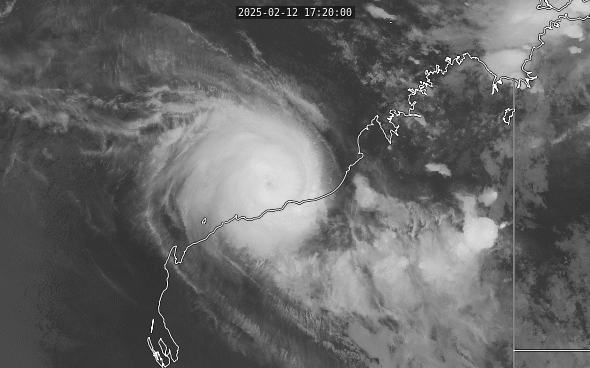
The rapid development of an eye can be seen in the following loop of Band 13 (10.4 microns, the infrared window) from the Advanced Himawari Imager (AHI) aboard Japan’s Himawari-9 geostationary satellite, . Because this eye development took place in the nighttime hours, visible-wavelength imagery cannot be used to observe this process. Longtime viewers of tropical cyclone imagery might be slightly started to see Zelia spinning in a clockwise direction, but that’s expected for a Southern Hemisphere cyclone.
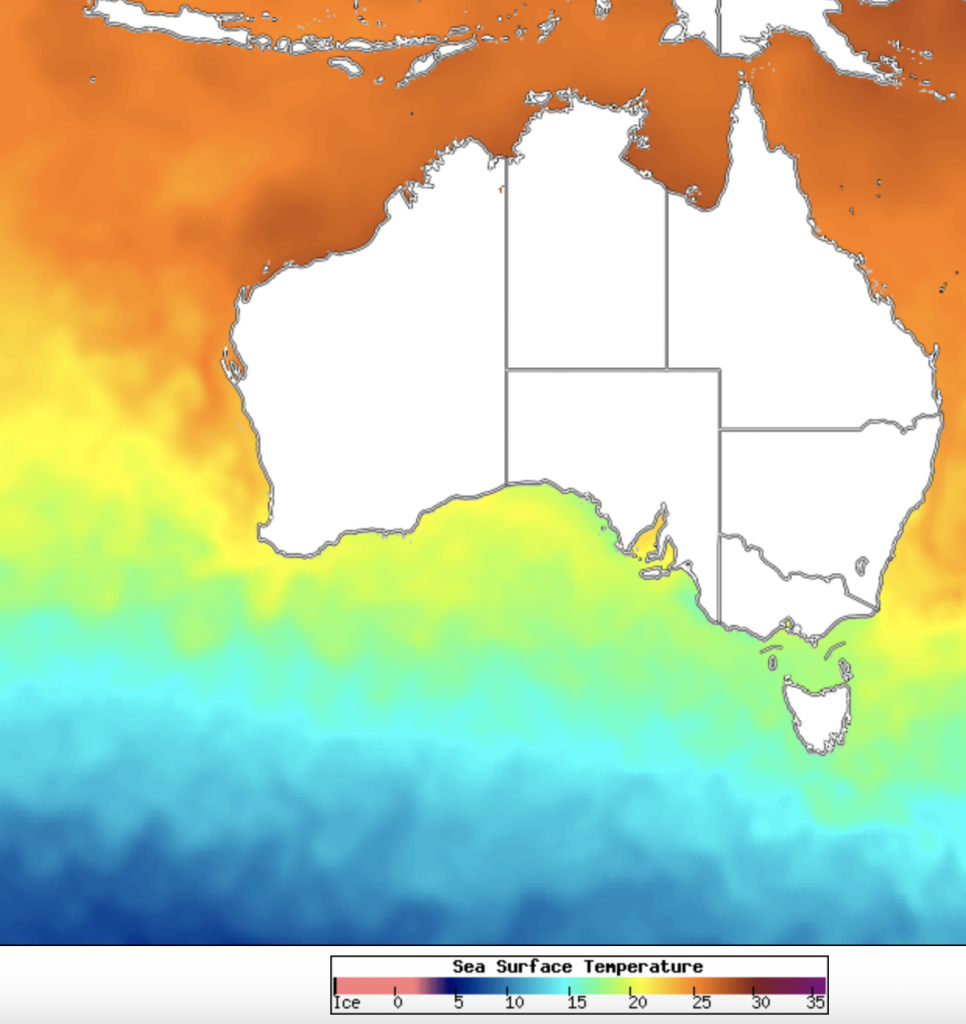
This strong intensification is not unexpected given the extremely warm sea surface temperatures found just northwest of Australia. The NESDIS High Resolution Sea Surface Temperature analysis (available from SSEC’s Real Earth) shows temperatures at or above 25 C (over 77 F), which contribute substantially to the latent heat processes needed for tropical cyclone development and maintenance.
For the latest updates, be sure to check the BOM’s Tropical Cyclone website.
===== 14 February Update =====
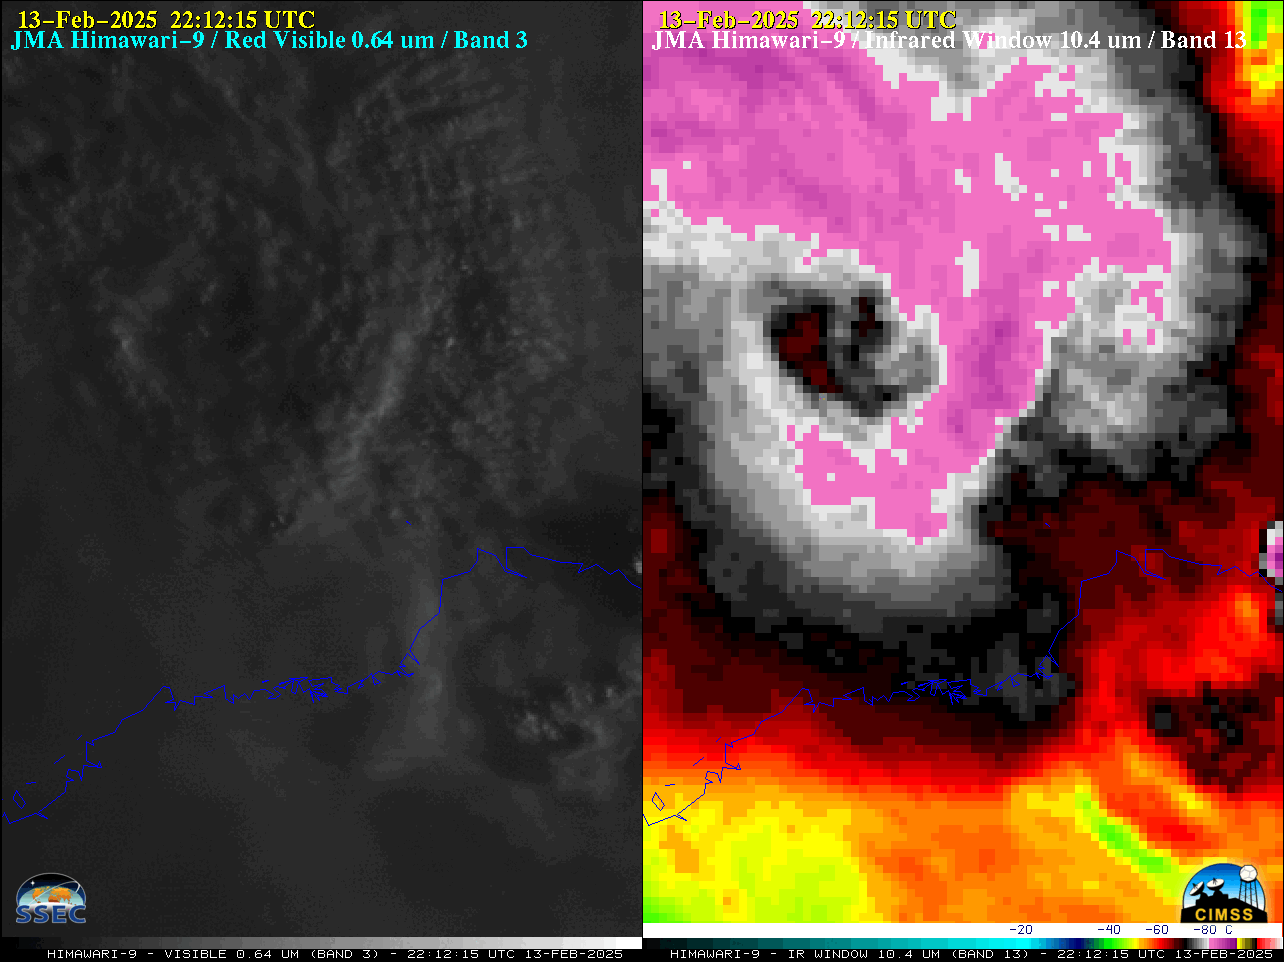
2.5-minute Himawari-9 Visible (0.64 µm, left) and Infrared (10.4 µm, right) images, from 2212 UTC on 13 February to 0502 UTC on 14 February (courtesy Scott Bachmeier, CIMSS) [click to play animated GIF | MP4]
2.5-minute Target Sector JMA Himawari-9 Visible and Infrared images (above) showed that Zelia made landfall along the coast of Western Australia (near Port Hedland) not long before 0500 UTC on 14 February. Cloud-top infrared brightness temperatures in the eyewall region were in the -80 to -85ºC range (shades of violet to purple).
A Suomi-NPP VIIRS Day/Night Band image (below) provided a high resolution view of the cloud-filled eye of Zelia, shortly after the tropical cyclone made landfall.
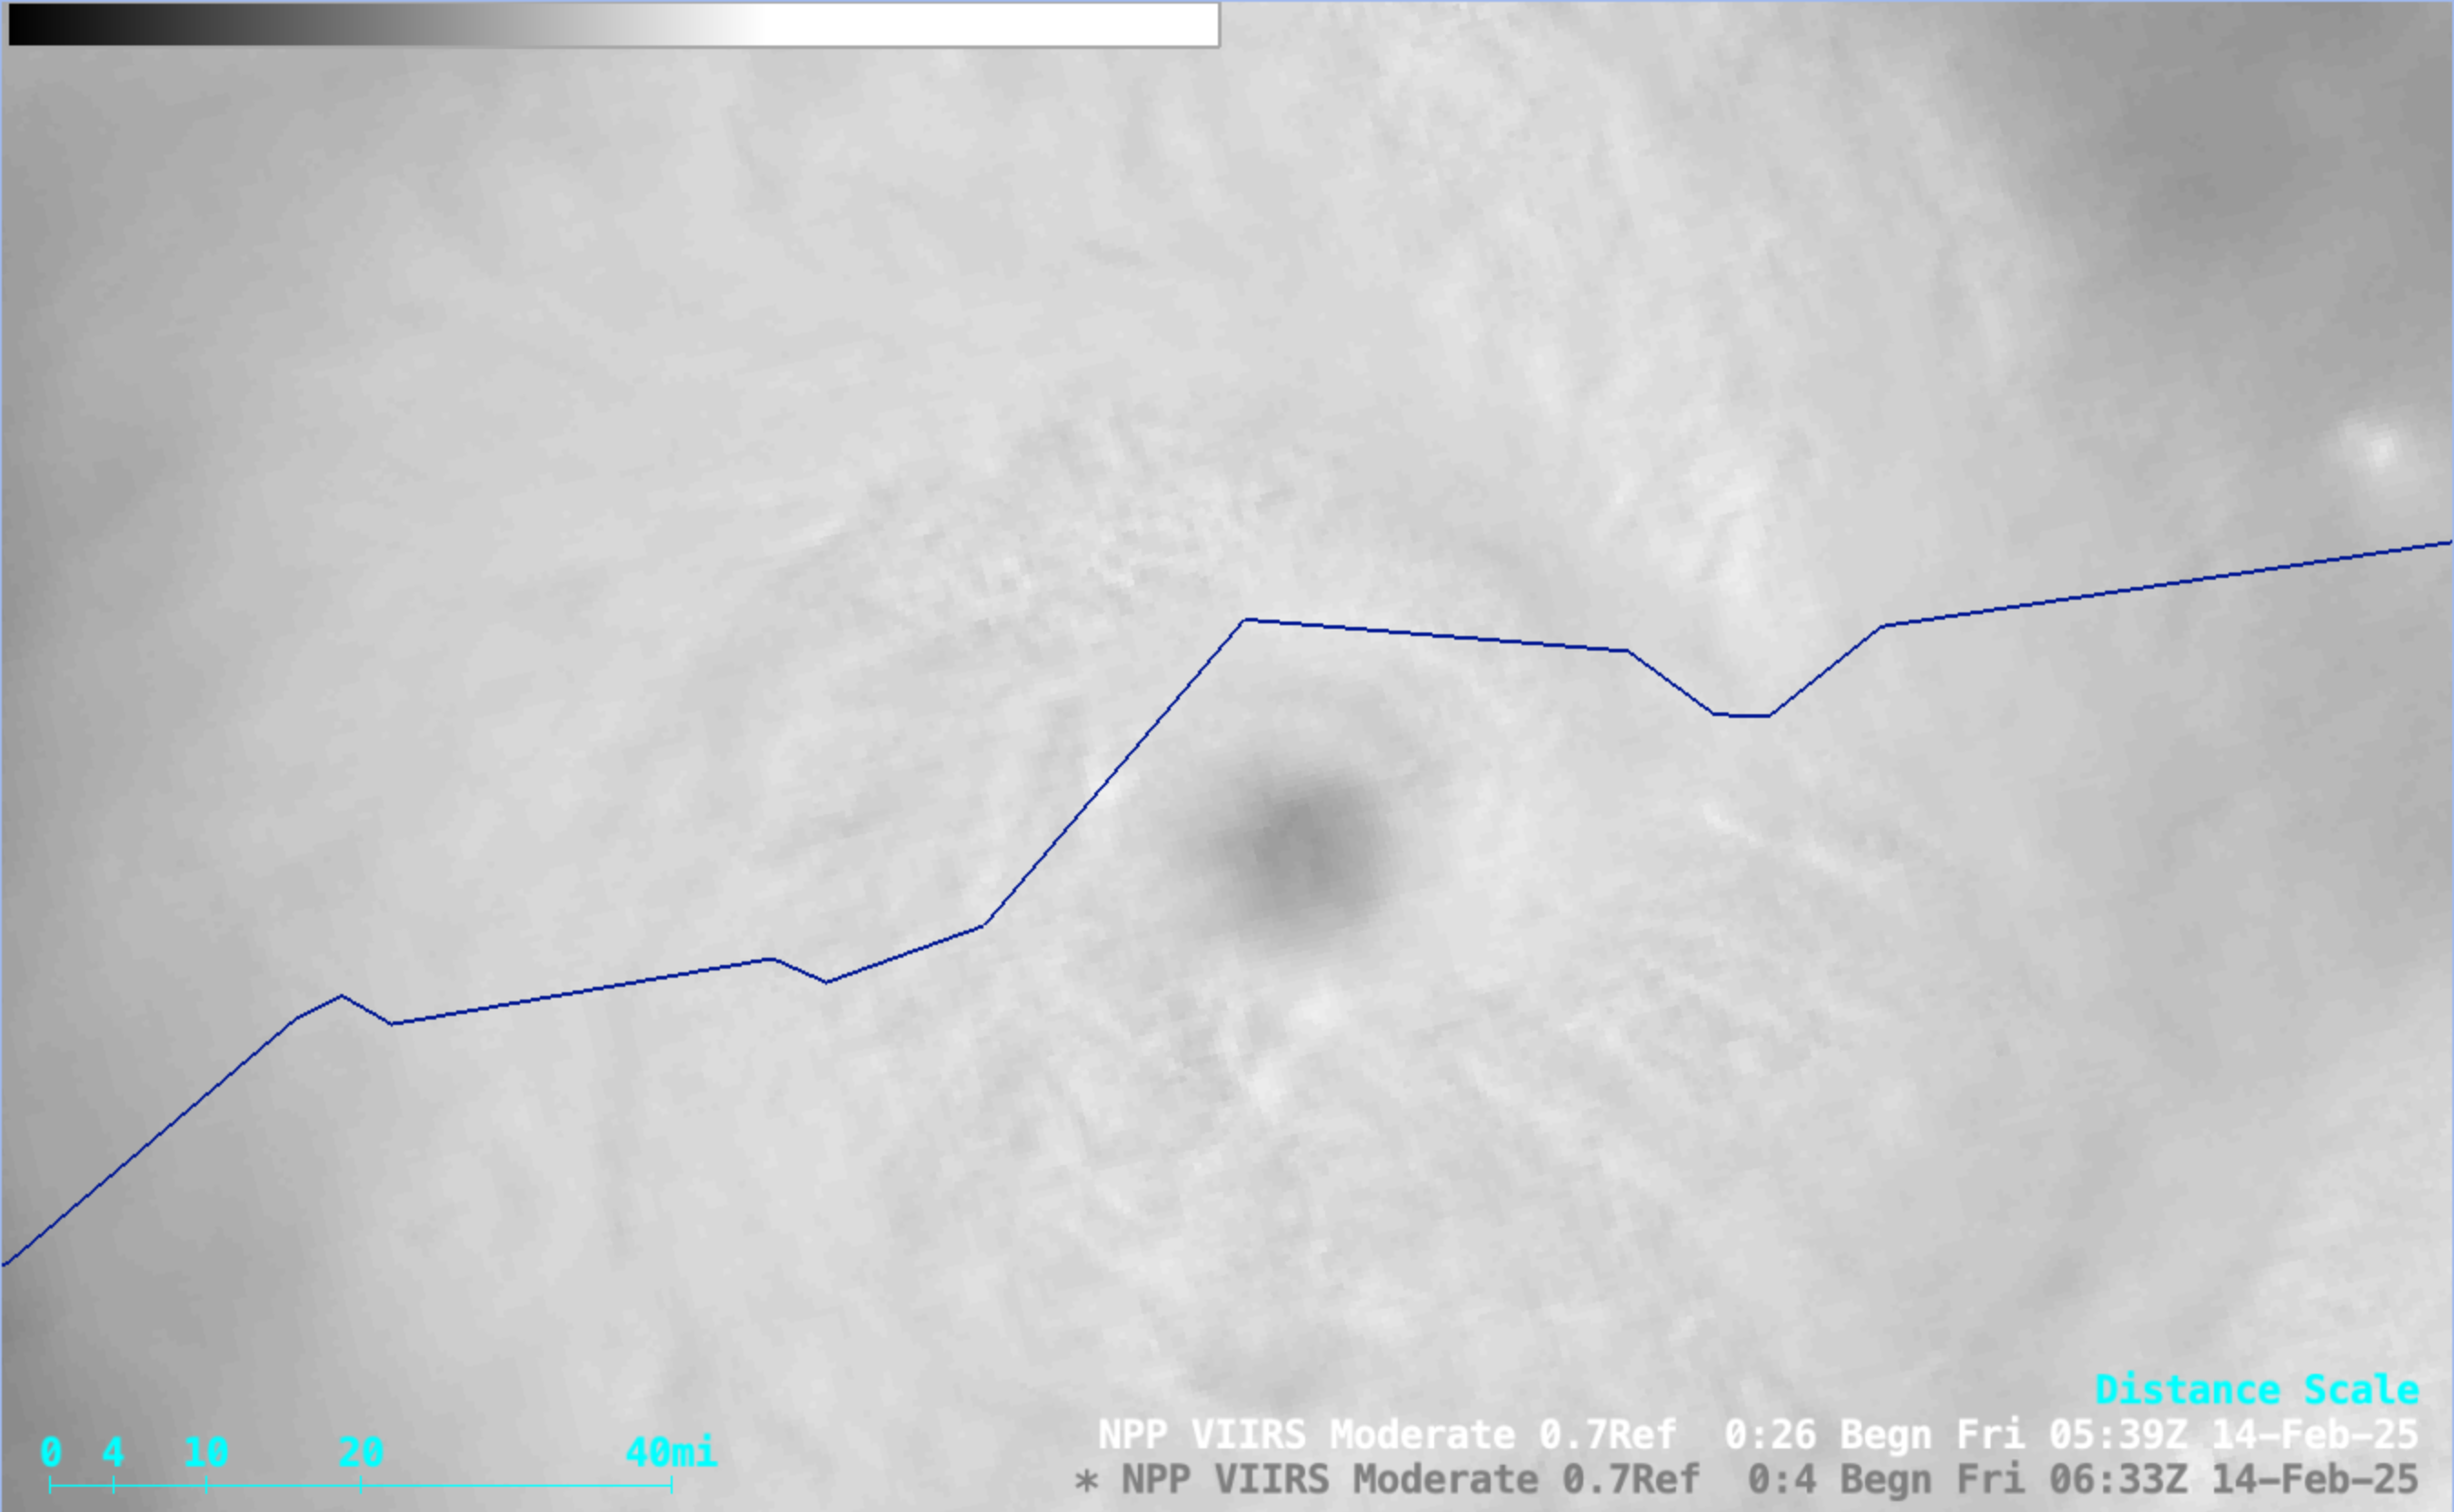
Suomi-NPP VIIRS Day/Night Band (0.7 µm) image, valid at 0524 UTC on 14 February (courtesy Scott Bachmeier, CIMSS) [click to enlarge]
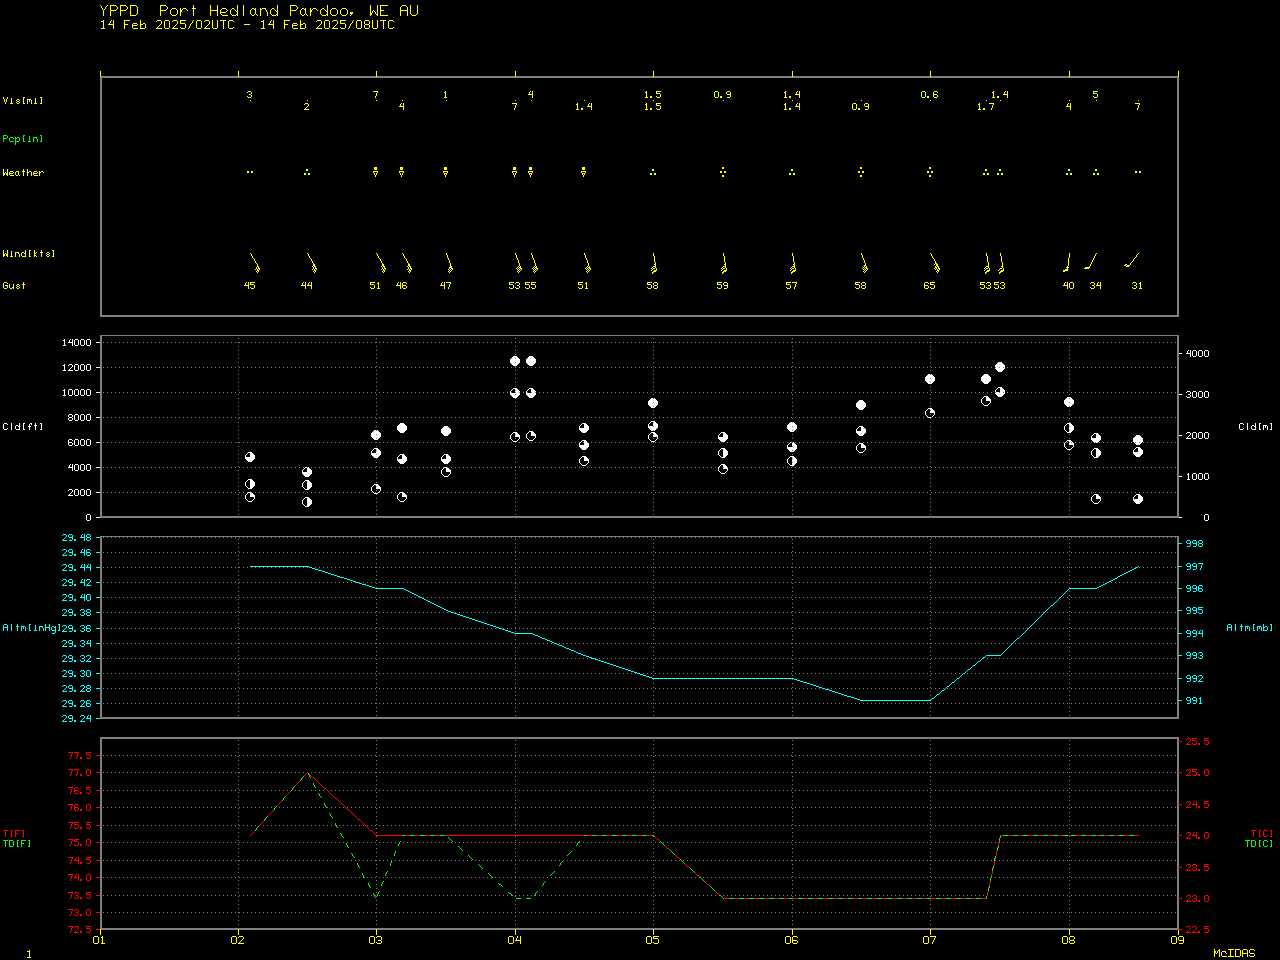
In a ~2 day animation of 2.5-minute Himawari-9 Infrared images (below), it was apparent that Zelia remained generally quasi-stationary for an extended period on 12-13 February — and as mentioned in a Joint Typhoon Warning Center discussion, this led to a wind-induced upwelling of cooler sub-surface water beneath the Category 4 intensity tropical cyclone (which likely played a role in reducing further intensification). The images include surface plots from Port Hedland (YPPD), which reported a wind gust of 65 knots at 0700 UTC. Also of note: during much of the day on 12 February, thunderstorms moving inland across the Port Hedland region exhibited cloud-top infrared brightness temperatures as cold as -90 to -95ºC (shades of yellow to gray, embedded within darker purple areas) — these thunderstorms were producing periods of heavy rain (YPPD METARs).

2.5-minute Himawari-9 Infrared (10.4 µm) images, from 1502 UTC on 12 February to 0702 UTC on 14 February (courtesy Scott Bachmeier, CIMSS) [click to play animated GIF | MP4]