
United Airlines Flight 85 (UAL85) encountered severe turbulence as it was on approach to landing at Newark Liberty International Airport (KEWR) — which injured 22 passengers, with 7 of those being transported to a hospital (media report 1 | media report 2) late in the day on 29 March 2024. Gusty NW winds may have contributed... Read More
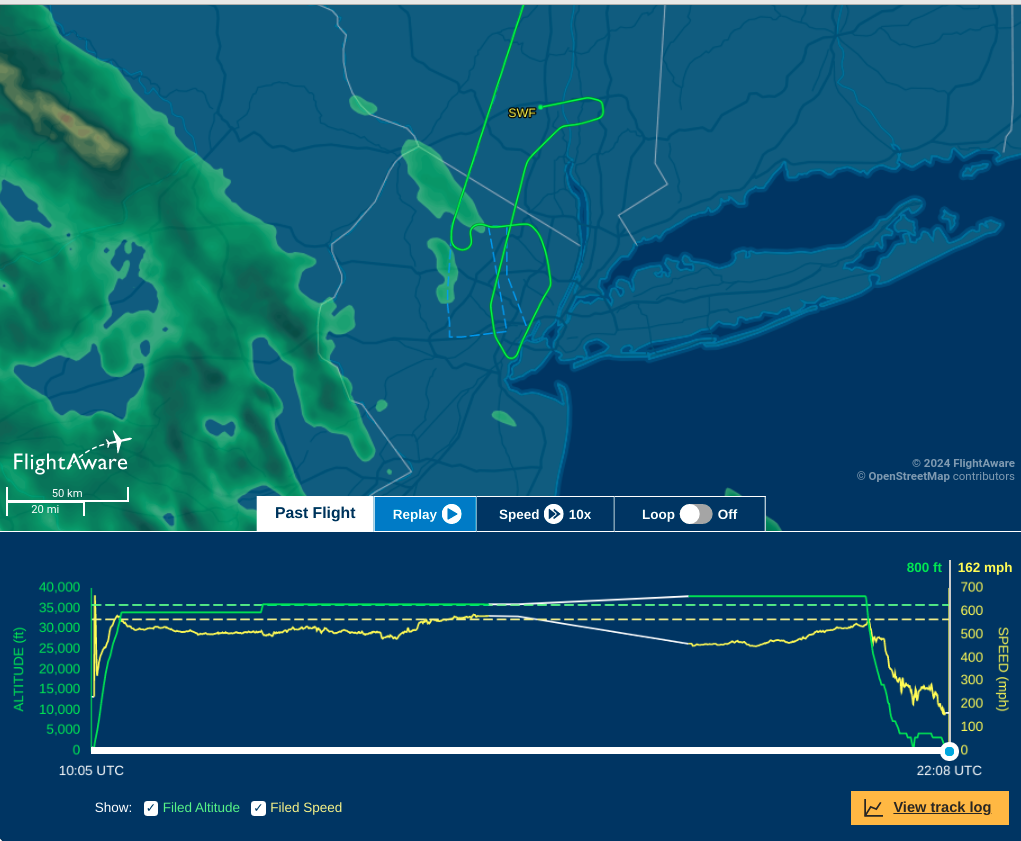
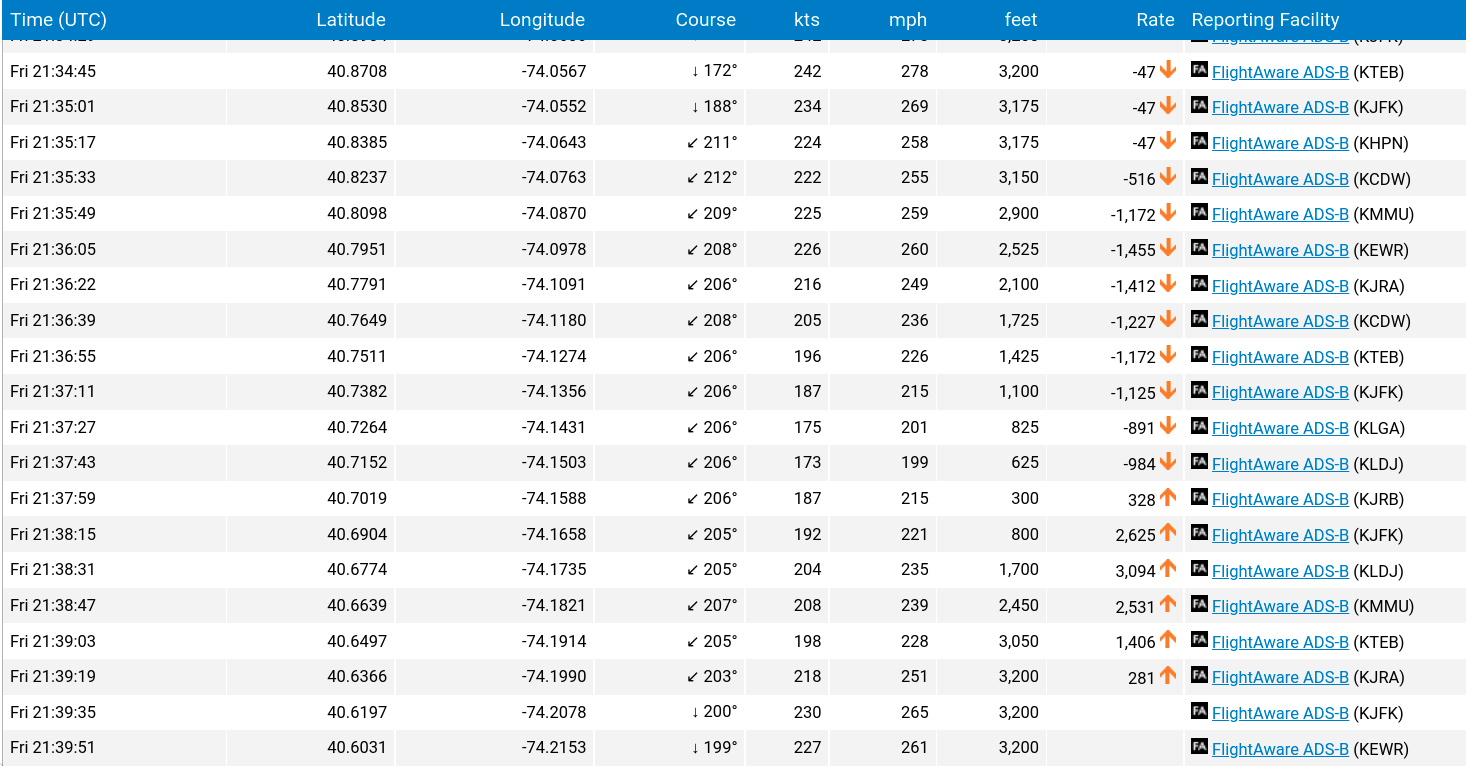
Final flight path of UAL85 (top) with plots of aircraft altitude and speed during its entire flight (bottom), from FlightAware.com
United Airlines Flight 85 (UAL85) encountered severe turbulence as it was on approach to landing at Newark Liberty International Airport (KEWR) — which injured 22 passengers, with 7 of those being transported to a hospital (media report 1 | media report 2) late in the day on 29 March 2024. Gusty NW winds may have contributed to the turbulence (which likely occurred around 2138 UTC, according to flight data from FlightAware — note the rapid rate of ascent beginning at that time); the peak wind gust at KEWR was 48 knots or 55 mph at 2039 UTC. After UAL85 aborted its landing at KEWR, it diverted north to New York Stewart International Airport (KSWF), landing at 2208 UTC (above).
1-minute Mesoscale Domain Sector GOES-16 (GOES-East) Low-level Water Vapor (7.3 µm) images (below) depicted widespread mountain waves across southeastern New York and northern New Jersey during that time. These mountain waves could also have played a role in creating boundary layer turbulence. The Pilot Report (PIREP) for this UAL85 incident did not appear in the real-time AWIPS data, probably due to time restraints imposed upon the flight crew to get the aircraft safely diverted as quickly as possible.
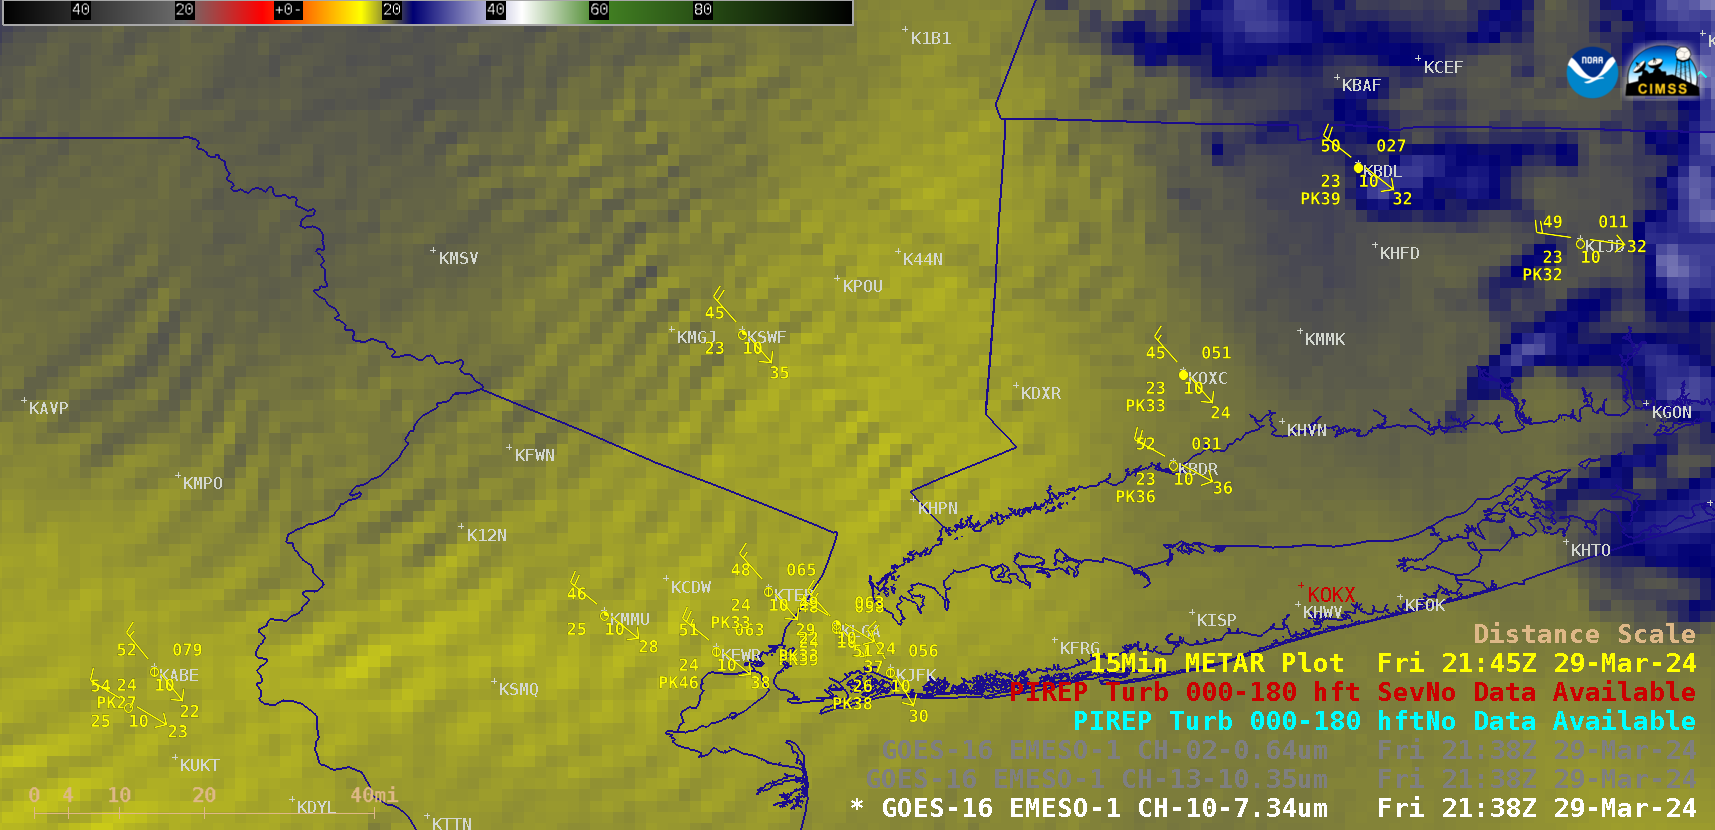
1-minute GOES-16 Low-level Water Vapor (7.3 µm) images, from 2100-2200 UTC on 29 March [click to play animated GIF | MP4]
In a faster animation of GOES-16 Water Vapor images without plots of surface reports
(below), note that the mountain wave structure across northern New Jersey (including near KEWR) becomes slightly deformed, and even begins to move westward a few miles.
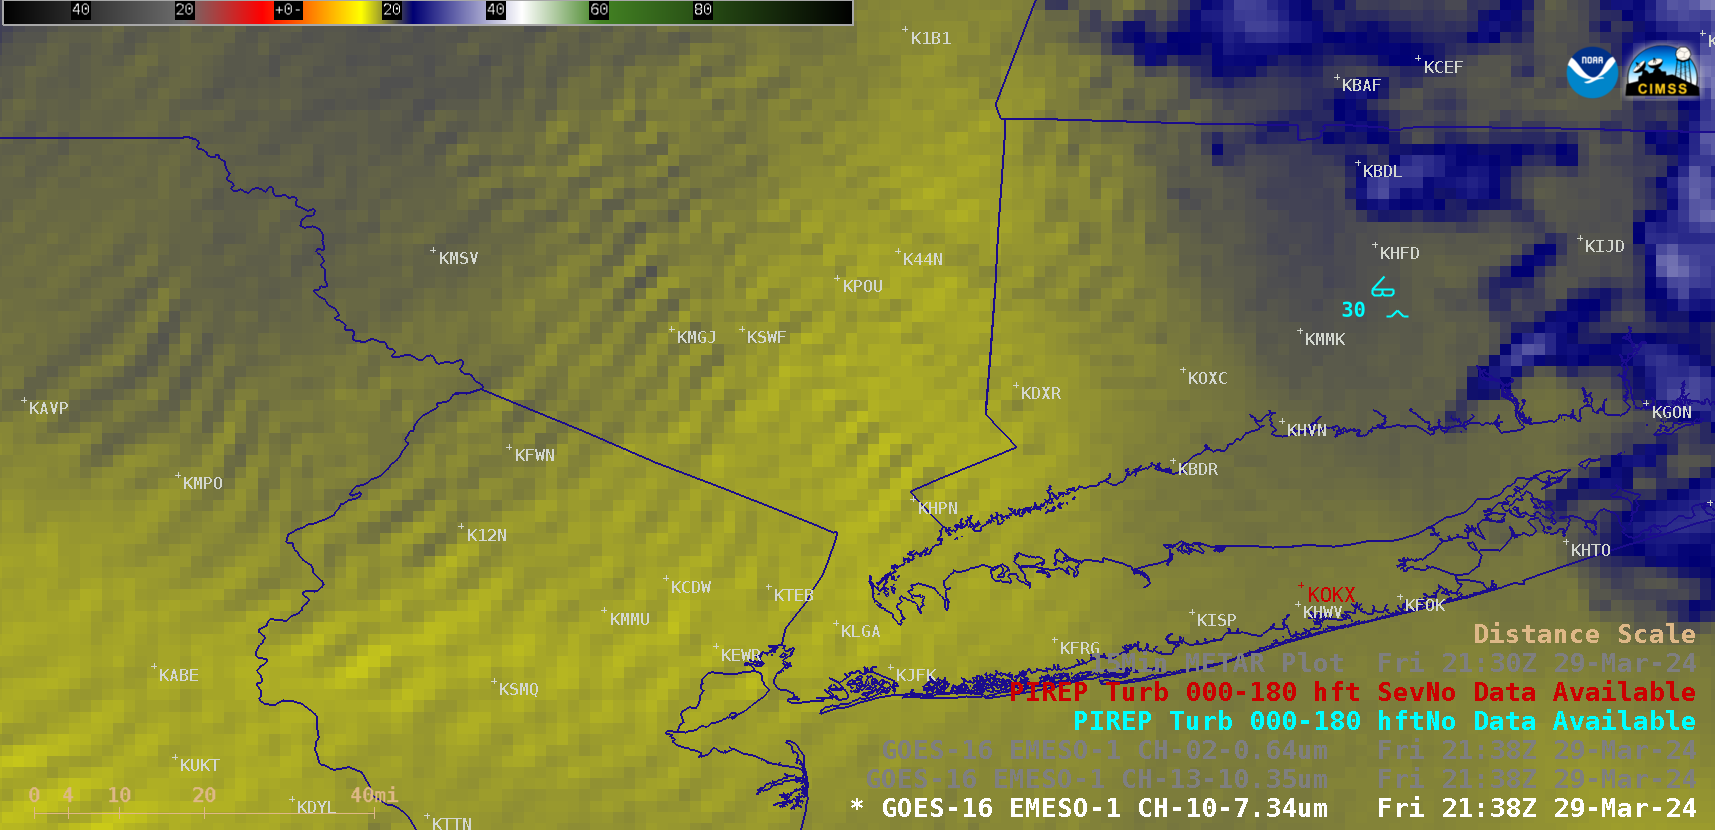
1-minute GOES-16 Low-level Water Vapor (7.3 µm) images, from 2040-2200 UTC on 29 March [click to play animated GIF | MP4]
A toggle between GOES-16 Water Vapor imagery and Topography
(below) indicated that these mountain waves were forming downwind of the
Catskills in New York and the
Poconos in Pennsylvania.
GOES-16 Low-level Water Vapor (7.3 µm) image + Topography [click to enlarge]
Plots of rawinsonde data from Albany NY and Upton NY
(below) both showed adiabatic or near-adiabatic lapse rates below the 800-850 hPa pressure level — which aided in the downward transport of momentum (stronger winds) aloft to the surface earlier in the day.
Plot of rawinsonde data from Albany NY at 0000 UTC on 30 March [click to enlarge]
Plot of rawinsonde data from Upton NY at 0000 UTC on 30 March [click to enlarge]
View only this post
Read Less


