This website works best with a newer web browser such as Chrome, Firefox, Safari or Microsoft
Edge. Internet Explorer is not supported by this website.
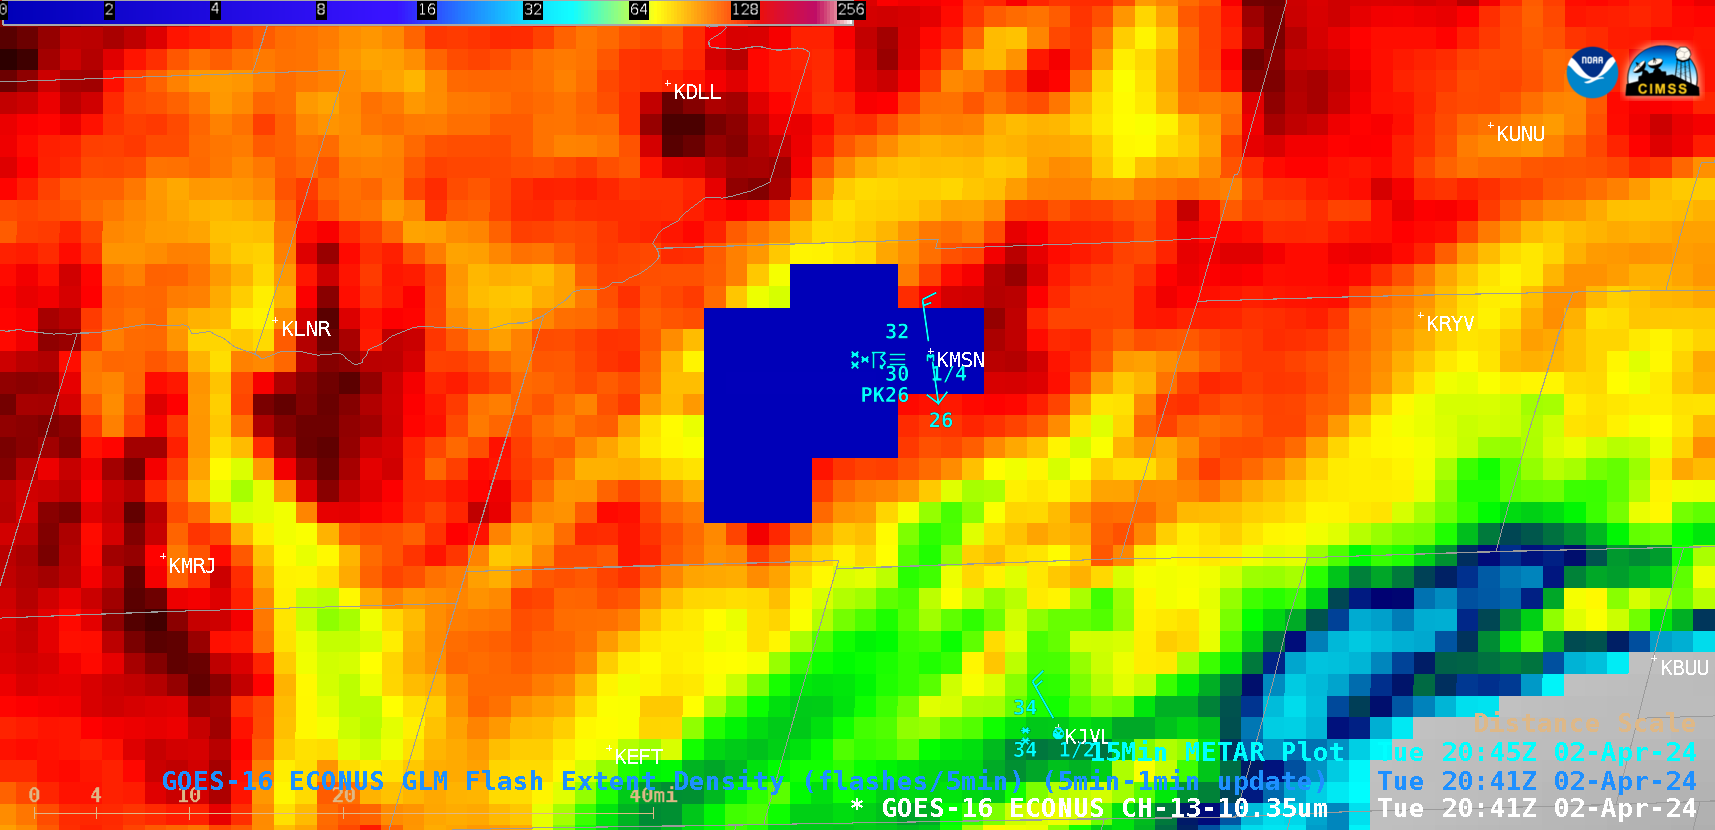
5-minute CONUS Sector GOES-16 (GOES-East) “Clean” Infrared Window (10.3 µm) images that included an overlay of GLMFlash Extent Density (above) revealed 2 brief flashes of lightning activity in southern Wisconsin during the afternoon hours on 02 April 2024. Heavy thundersnow (+TSSN) was reported at Madison (station identifier KMSN) at 2047 UTC and 2053 UTC, with the thunderstorm... Read More
GOES-16 “Clean” Infrared Window (10.3 µm) images with an overlay of GLM Flash Extent Density and plots of surface reports, from 2001-2106 UTC on 02 April [click to play animated GIF | MP4]
5-minute CONUS Sector GOES-16 (GOES-East) “Clean” Infrared Window (10.3 µm) images that included an overlay of GLMFlash Extent Density(above) revealed 2 brief flashes of lightning activity in southern Wisconsin during the afternoon hours on 02 April 2024. Heavy thundersnow (+TSSN) was reported at Madison (station identifier KMSN) at 2047 UTC and 2053 UTC, with the thunderstorm ending at 2104 UTC. Increasing snowfall rates accompanied the onset of this thundersnow.
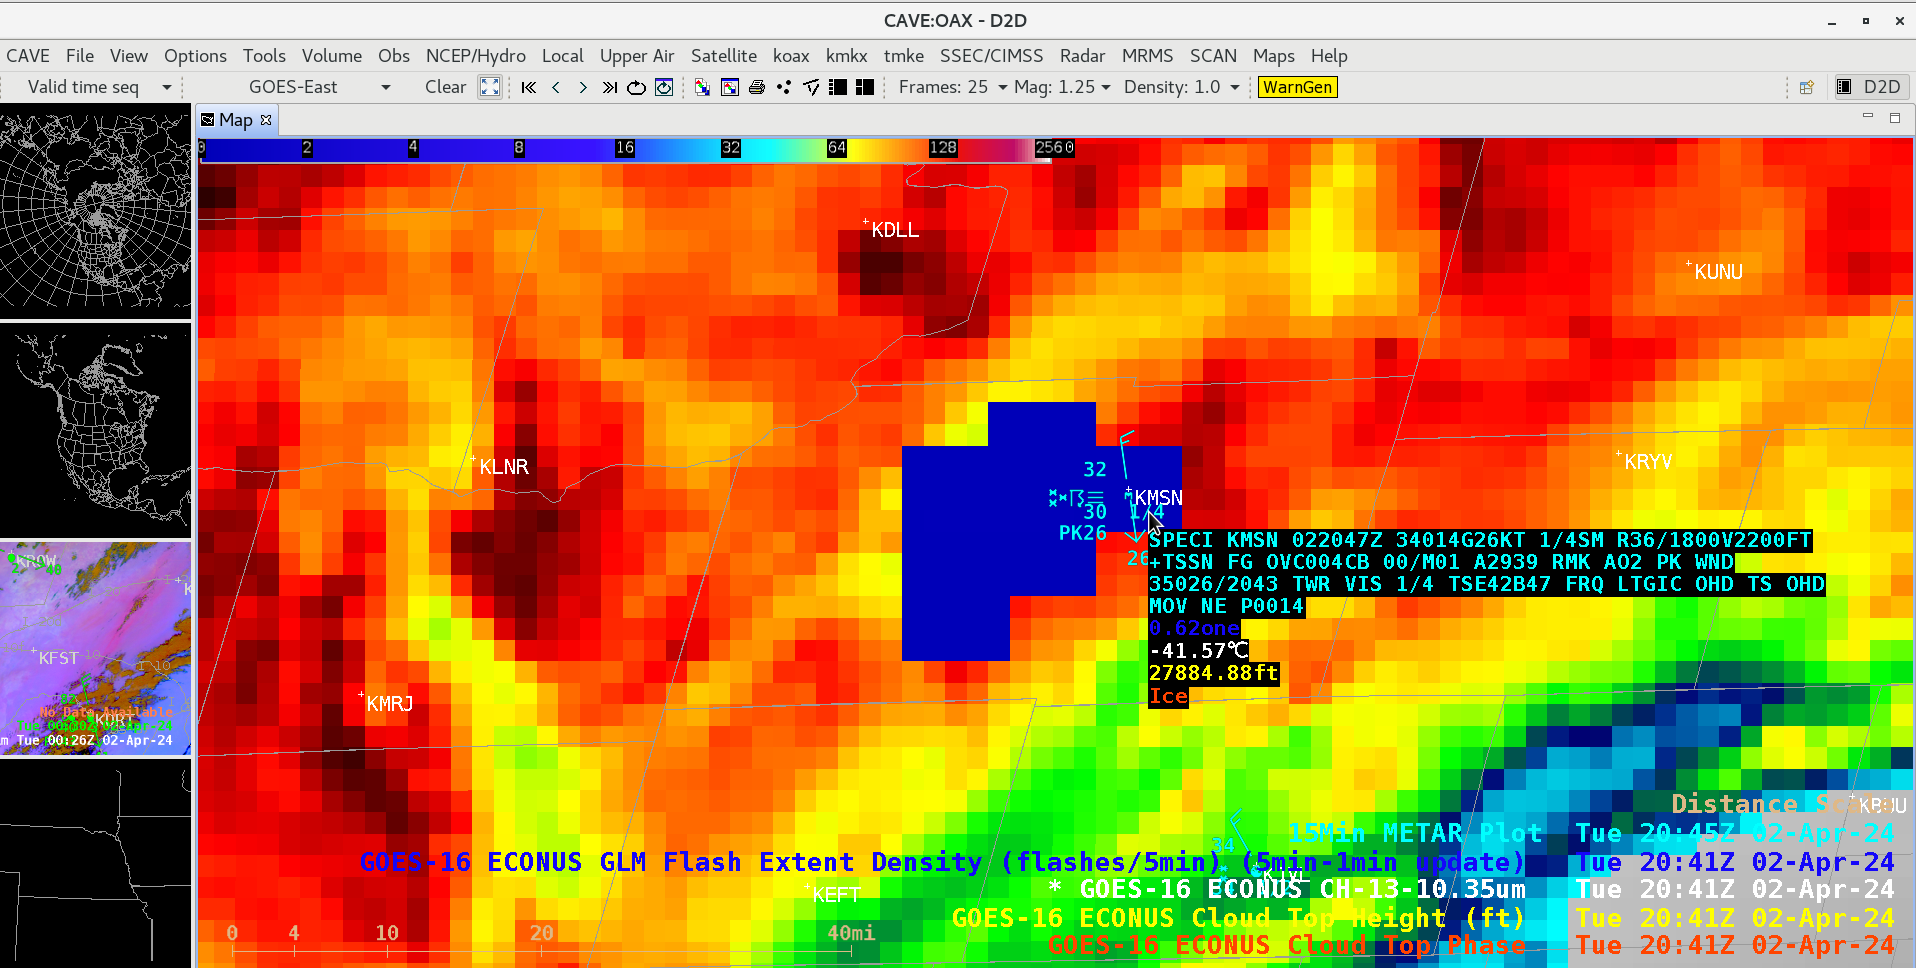
A cursor sample of the GOES-16 cloud-top infrared (10.3 µm) brightness temperature along with the associated Cloud Top Height and Cloud Top Phase derived products at 2041 UTC (below) showed that the Height was 27884.88 ft and the Phase was Ice (as would be expected with a 10.3 µm infrared brightness temperature of -41.57ºC).
Cursor sample of the GOES-16 “Clean” Infrared Window (10.3 µm) cloud-top brightness temperature along with the Cloud Top Height and Cloud Top Phase derived products at 2041 UTC on 02 April [click to enlarge]
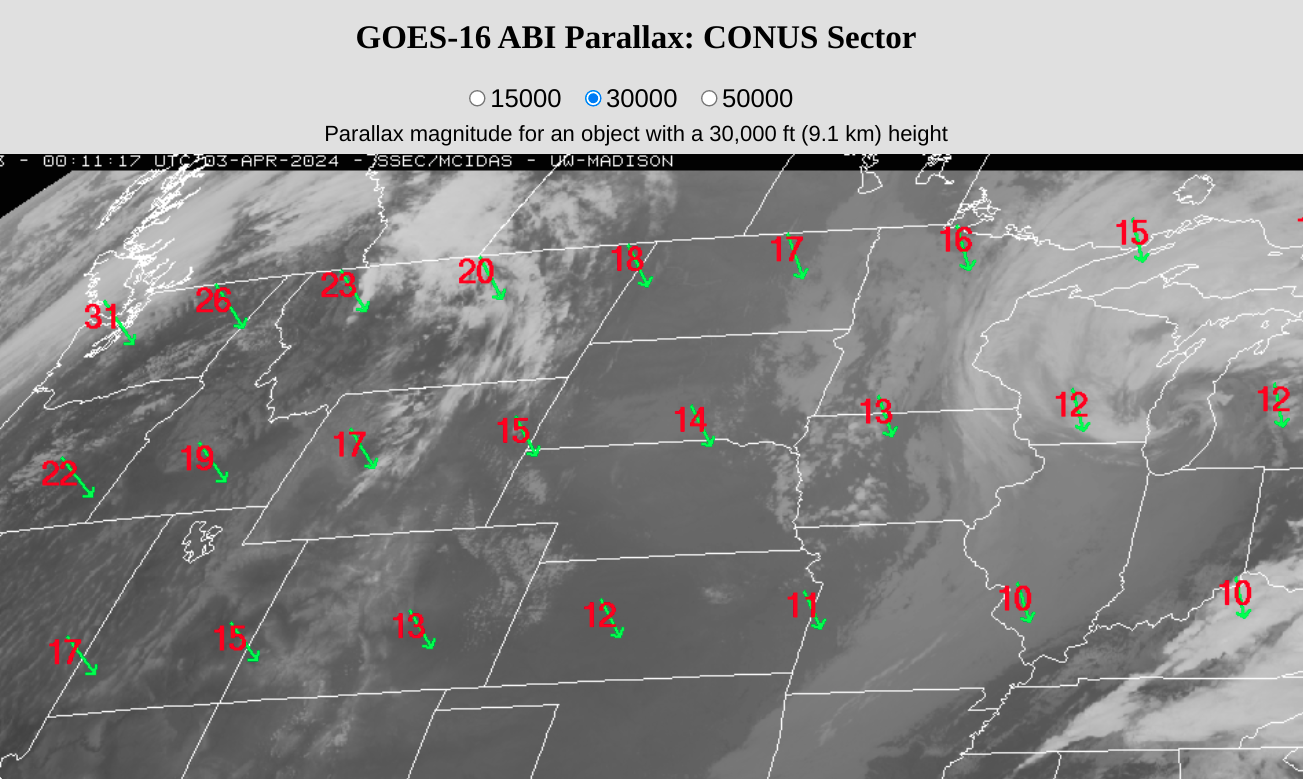
With cloud top heights less than 30000 ft, the parallax offset was fairly minimal — likely around 10 km or 6.2 miles (below).
GOES-16 parallax correction direction (green) and magnitude (km, red) for a cloud top of 30000 ft or 9.1 km [click to enlarge]
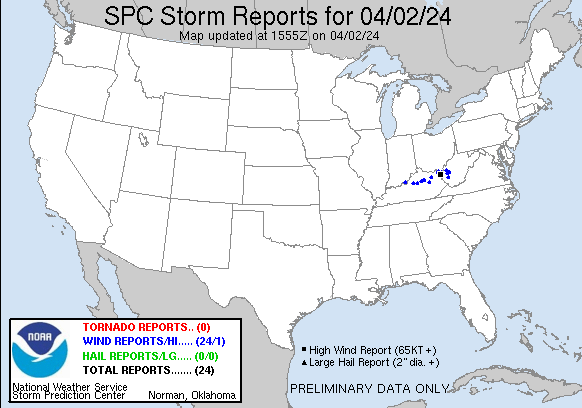
Morning convection on 2 April caused a swath of wind damage across (mostly northern) Kentucky, as shown in the Storm Reports below (from the SPC Website). The animation above shows the GOES-16 Clean Window Infrared (Band 13, 10.3 µm) imagery from to 1421. The strong convection shows includes cold cloud tops that last... Read More
GOES-16 Band 13 Infrared (10.3 µm) imagery with clear-sky estimates of Lifted Index (scaled from -5 to 5), 1222-1421 UTC on 2 April 2024 (Click to enlarge)
Morning convection on 2 April caused a swath of wind damage across (mostly northern) Kentucky, as shown in the Storm Reports below (from the SPC Website). The animation above shows the GOES-16 Clean Window Infrared (Band 13, 10.3 µm) imagery from to 1421. The strong convection shows includes cold cloud tops that last for a few minutes before collapsing; collapsing updrafts such as those are consistent with the occasional reports of strong winds at the surface. (Click here to see the same animation with warning polygons). The GOES-16 Derived Stability Index (Lifted Index in this case, scaled from -5 to 5) is also shown with the Clean Window infrared imagery, and a corridor of instability can be inferred, but because GOES-R Stabiity Indices are clear-sky only, a lot of information is missing.
SPC Storm Reports, 1200-1600 UTC 2 April 2024 (Click to enlarge)
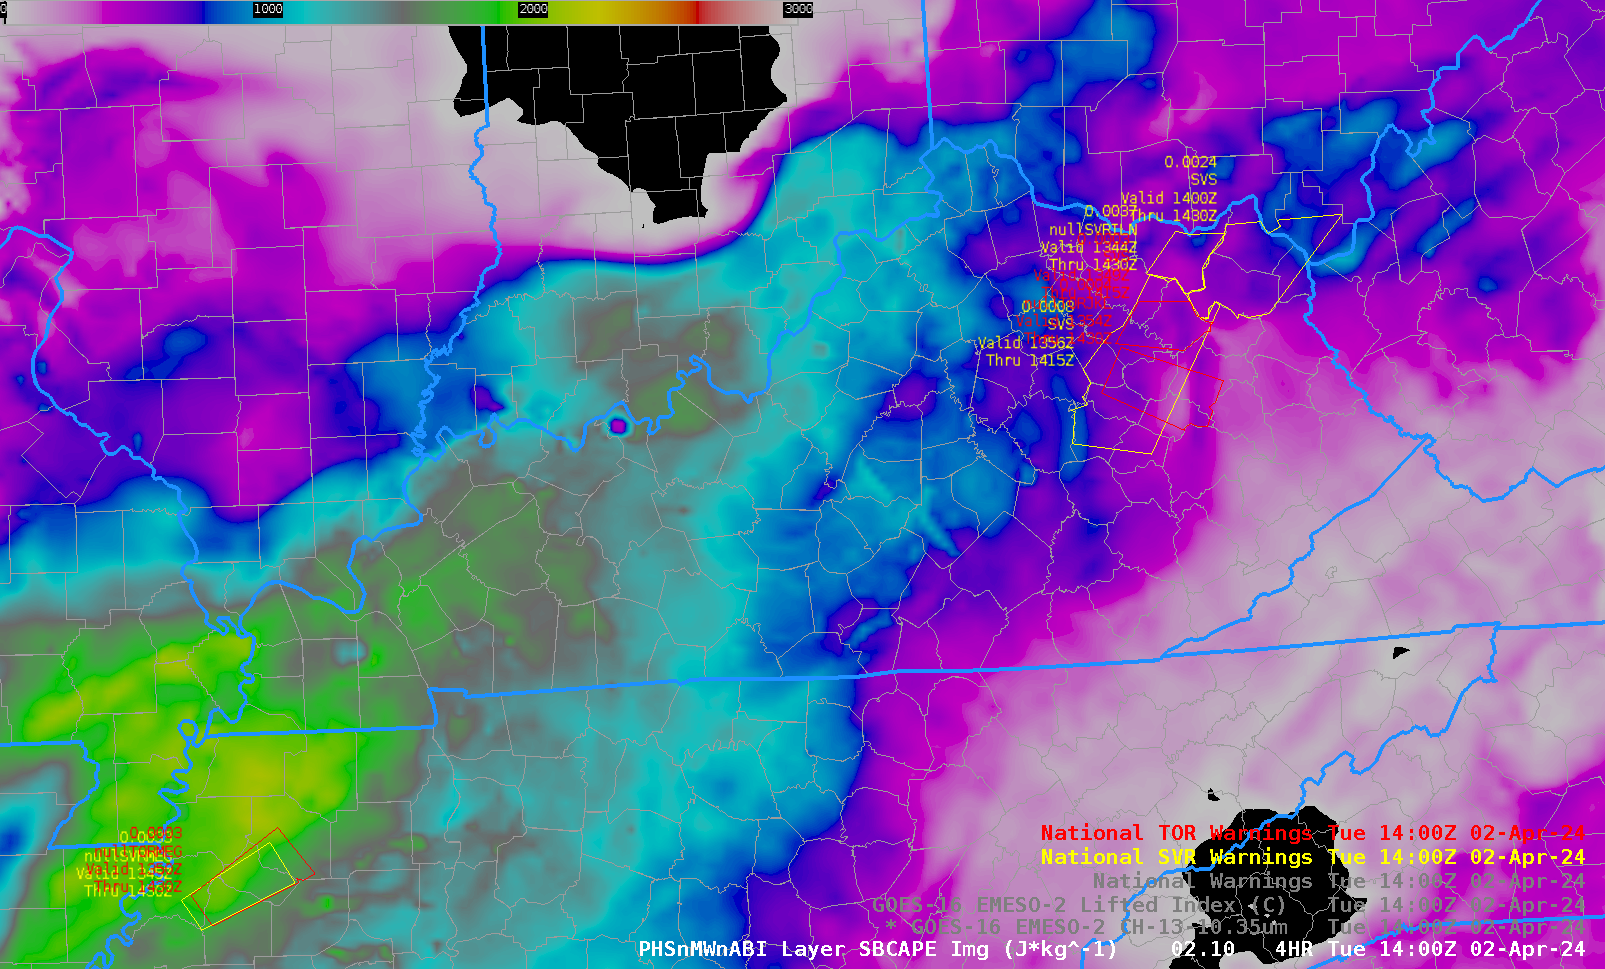
The toggle below shows the 3- and 4-h forecasts of SBCAPE from the 1000 UTC PHS model in addition to the warning polygons. The instability as measured by the SBCAPE is moving east-northeastward into southern Ohio, and the warning polygons are near the leading edge of the instability. The sounder data in the Polar Hyperspectral Soundings model (PHS) is adding information that helps define the region of hazardous weather.
PHS Model estimates of Surface-Based CAPE along with active Warnings, 1300 and 1400 UTC, 2 April 2024 (Click to enlarge)
The sliders below compare the 1300 UTC and 1400 UTC Band 13/Lifted Index imagery and the 3-h (and 4-h) forecast of Surface-based CAPE derived from PHS Model output (available at this website). Note how the nose of the SBCAPE is well-aligned with the deep convection in the ABI imagery.
The PHS model output is giving more information about instability than the GOES-R Level 2 products in this cloudy scene! The toggle below compares the 3-km HRRR with the 4-km WRF that includes PHS information. The PHS model has instability farther north into Kentucky, closer to where the severe weather was observed. SPC storm reports were mostly just north of 38oN latitude.
Surface-based CAPE from the 3-km HRRR and a 4-km WRF model with PHS data, 4-h forecasts valid at 1400 UTC on 2 April 2024 (Click to enlarge)
SBCAPE fields from the model that includes PHS data (top), shown in the animation below, depict greater instability at 1400 UTC when the plotted severe weather was occurring.
0-h to 6-h forecasts of Surface-Based CAPE from models initialized at 1000 UTC on 2 April, 2024. Top: 4-km WRF model with assimilated PHS data ; Bottom: 3-km HRRR model without PHS data. Note that Severe Weather Reports within 30 minutes of 1400 UTC are plotted as well.
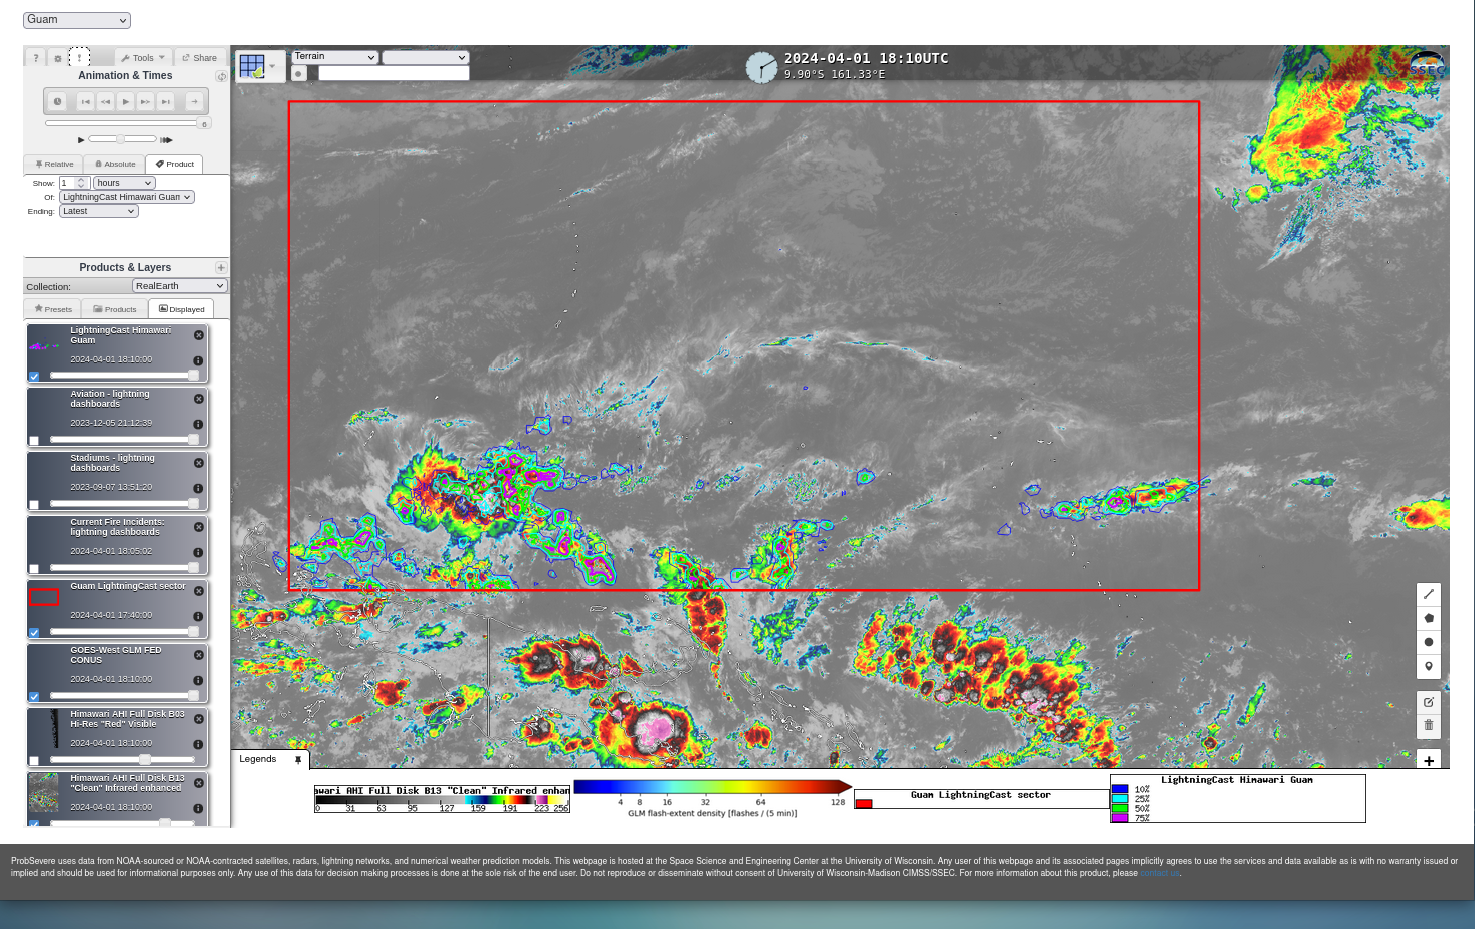
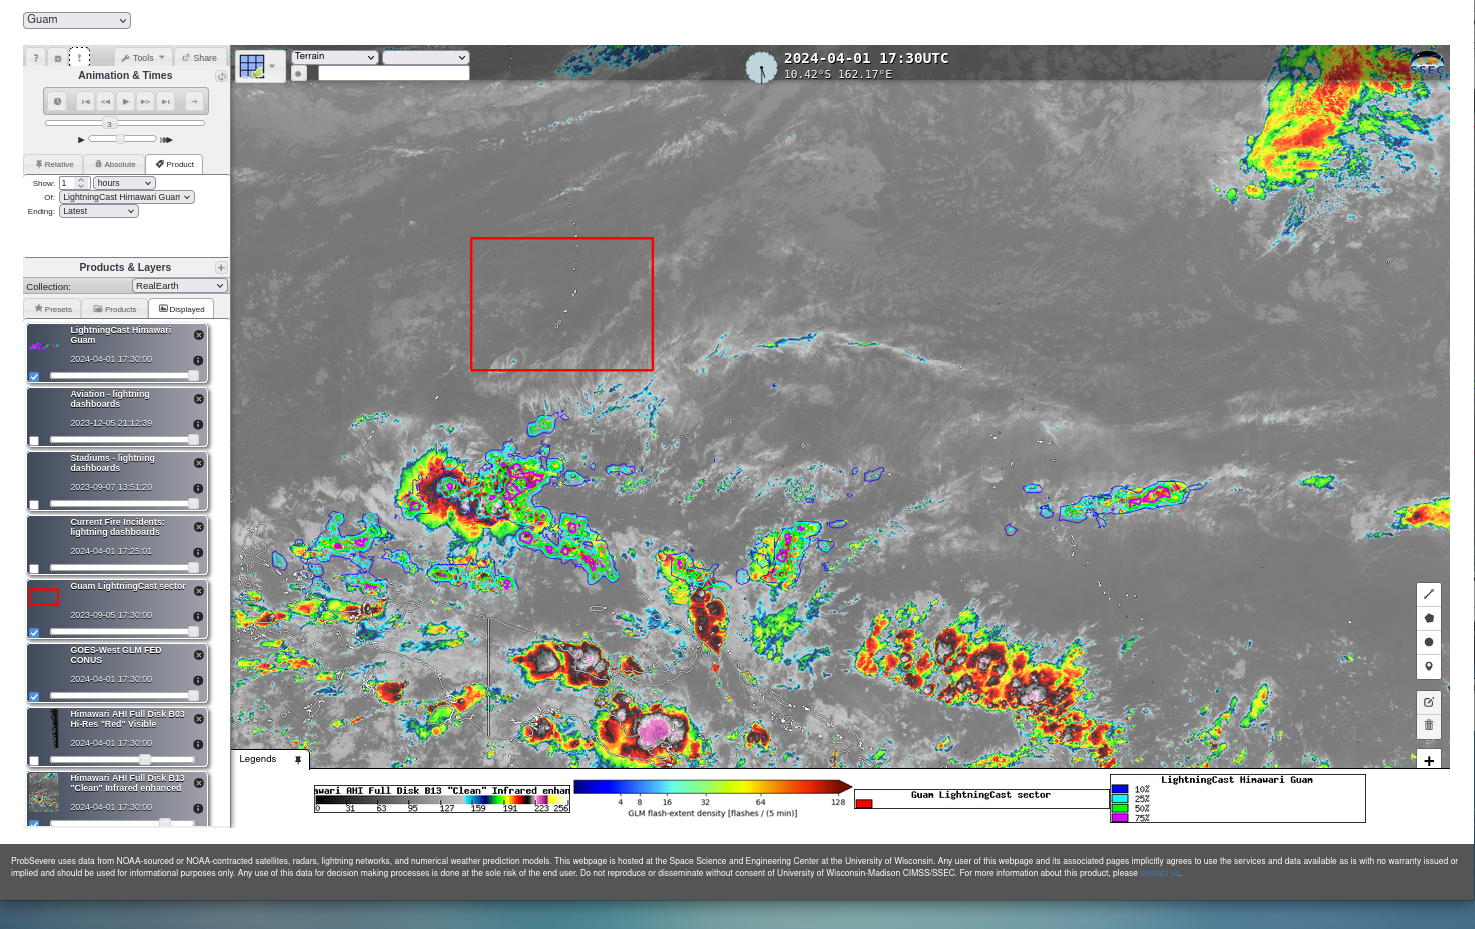
The National Weather Service forecast office on Guam (where the National Weather Service day begins!) has a very large Area Of Responsibility (AOR), as shown in this image; it stretches from the Equator northward to 25oN, and from the dateline west to 130oE. At ca. 1800 UTC on 1 April 2024 (no foolin’!) the... Read More
LightningCast over Guam in a small domain at 1730 UTC and a larger domain at 1810 UTC on 1 April 2024 (click to enlarge)
The National Weather Service forecast office on Guam (where the National Weather Service day begins!) has a very large Area Of Responsibility (AOR), as shown in this image; it stretches from the Equator northward to 25oN, and from the dateline west to 130oE. At ca. 1800 UTC on 1 April 2024 (no foolin’!) the RealEarth domain for LightningCast (at this website) was expanded from a relatively small footprint that covered the Marianas to one that covers the entire Guam AOR, including the Marshall and Marianas Islands, as shown by the red rectangle in the toggle above.
CIMSS is also providing AWIPS-ready tiles to the NWS Pacific Region for inclusion into AWIPS machines in Guam and Honolulu, and those AWIPS machines have been modified to accept the new data. The toggle below is courtesy Eric Jacobsen, Pacific Region Headquarters, and shows the domain change in AWIPS.
LightningCast Probability (loaded as images) at 1730 UTC and 1830 UTC on 1 April 2024 (Click to enlarge; image courtesy Eric Jacobsen, NWS PRH)
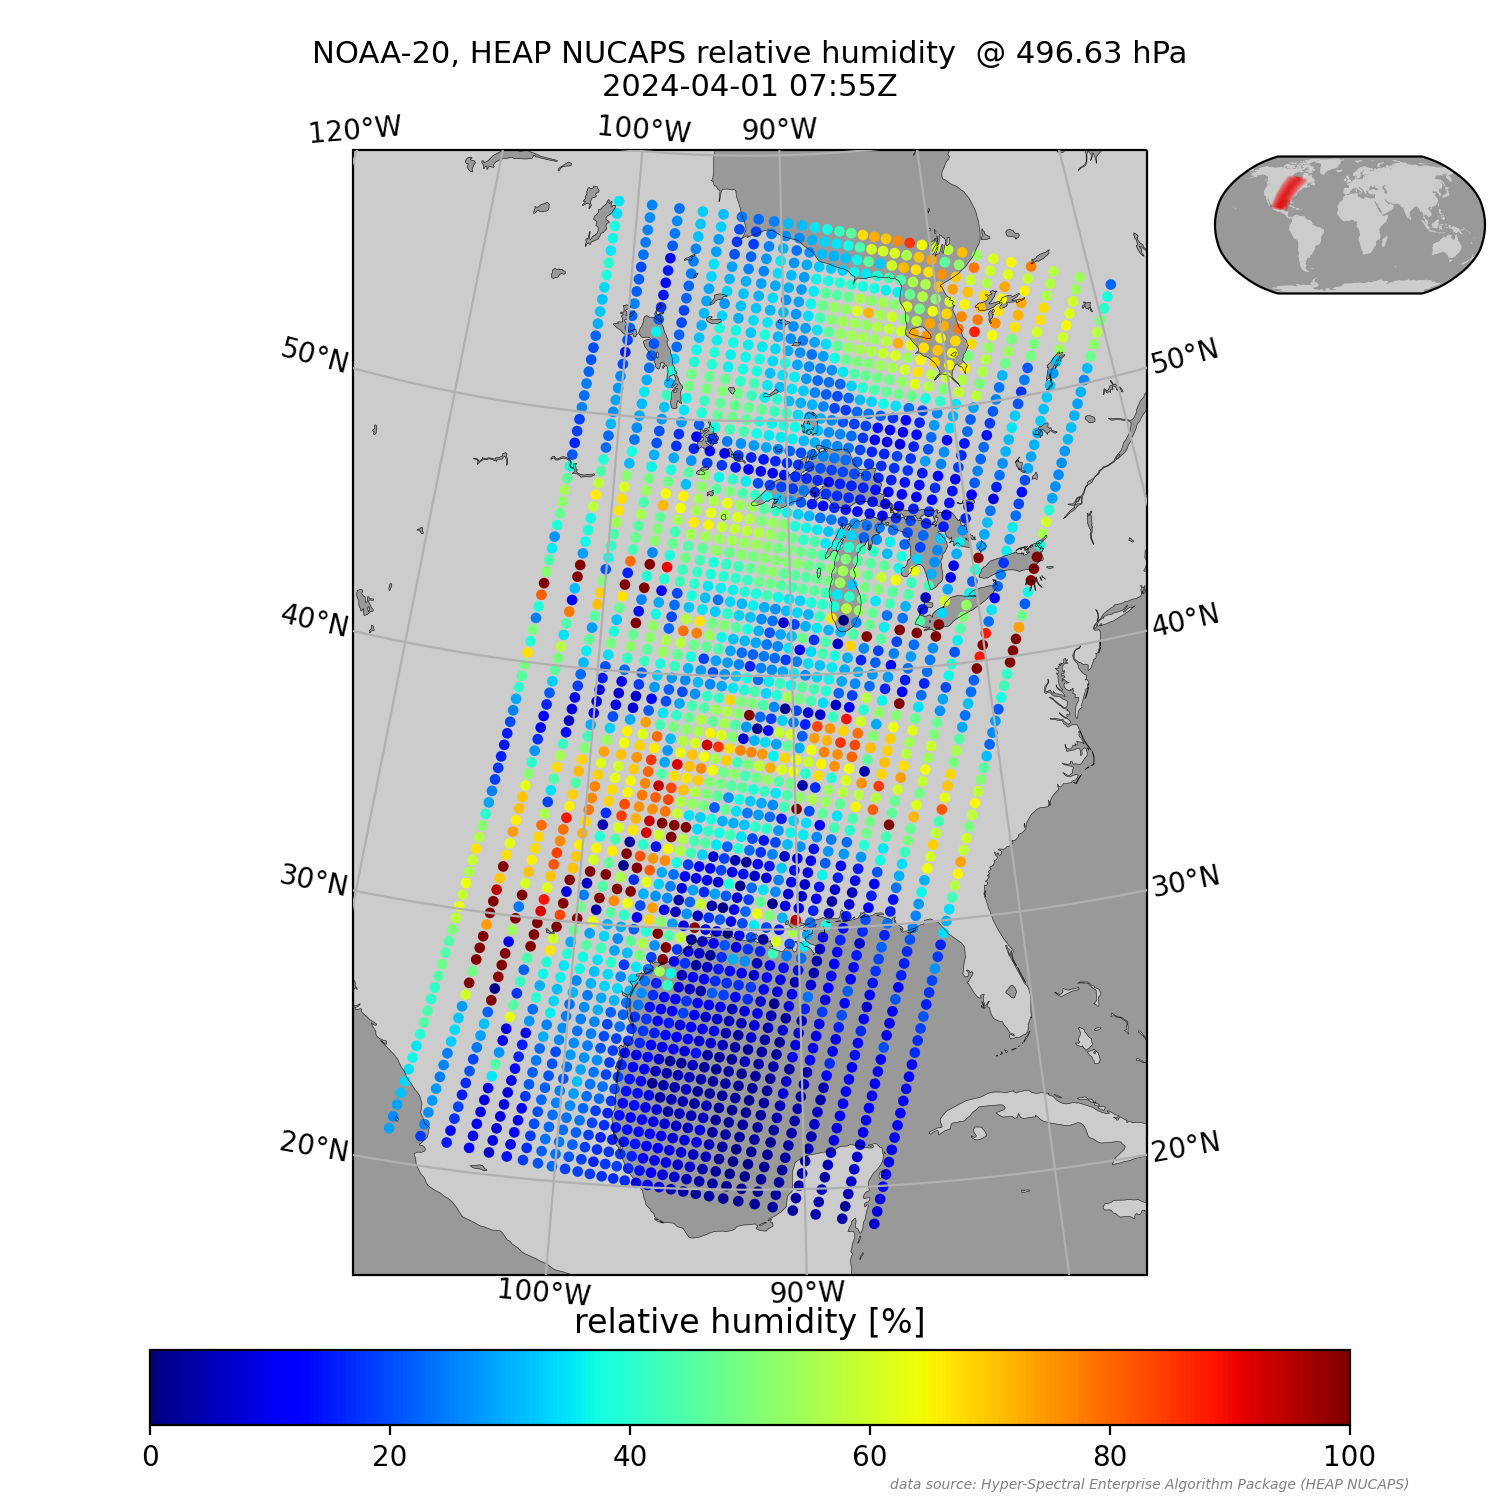
CIMSS Scientists have adjusted the presentation of individual thermodynamic variables produced from HEAP (NUCAPS) profiles for NOAA-20 overpasses that are available here in near-real time (at that website, chose j01 (that is, NOAA-20), crisfsr, and then images); HEAP software that supports NOAA-21 data is not yet available. Previously (above) values... Read More
HEAP analysis of 493mb Relative Humidity, 0755 UTC on 1 April 2024 (Click to enlarge)
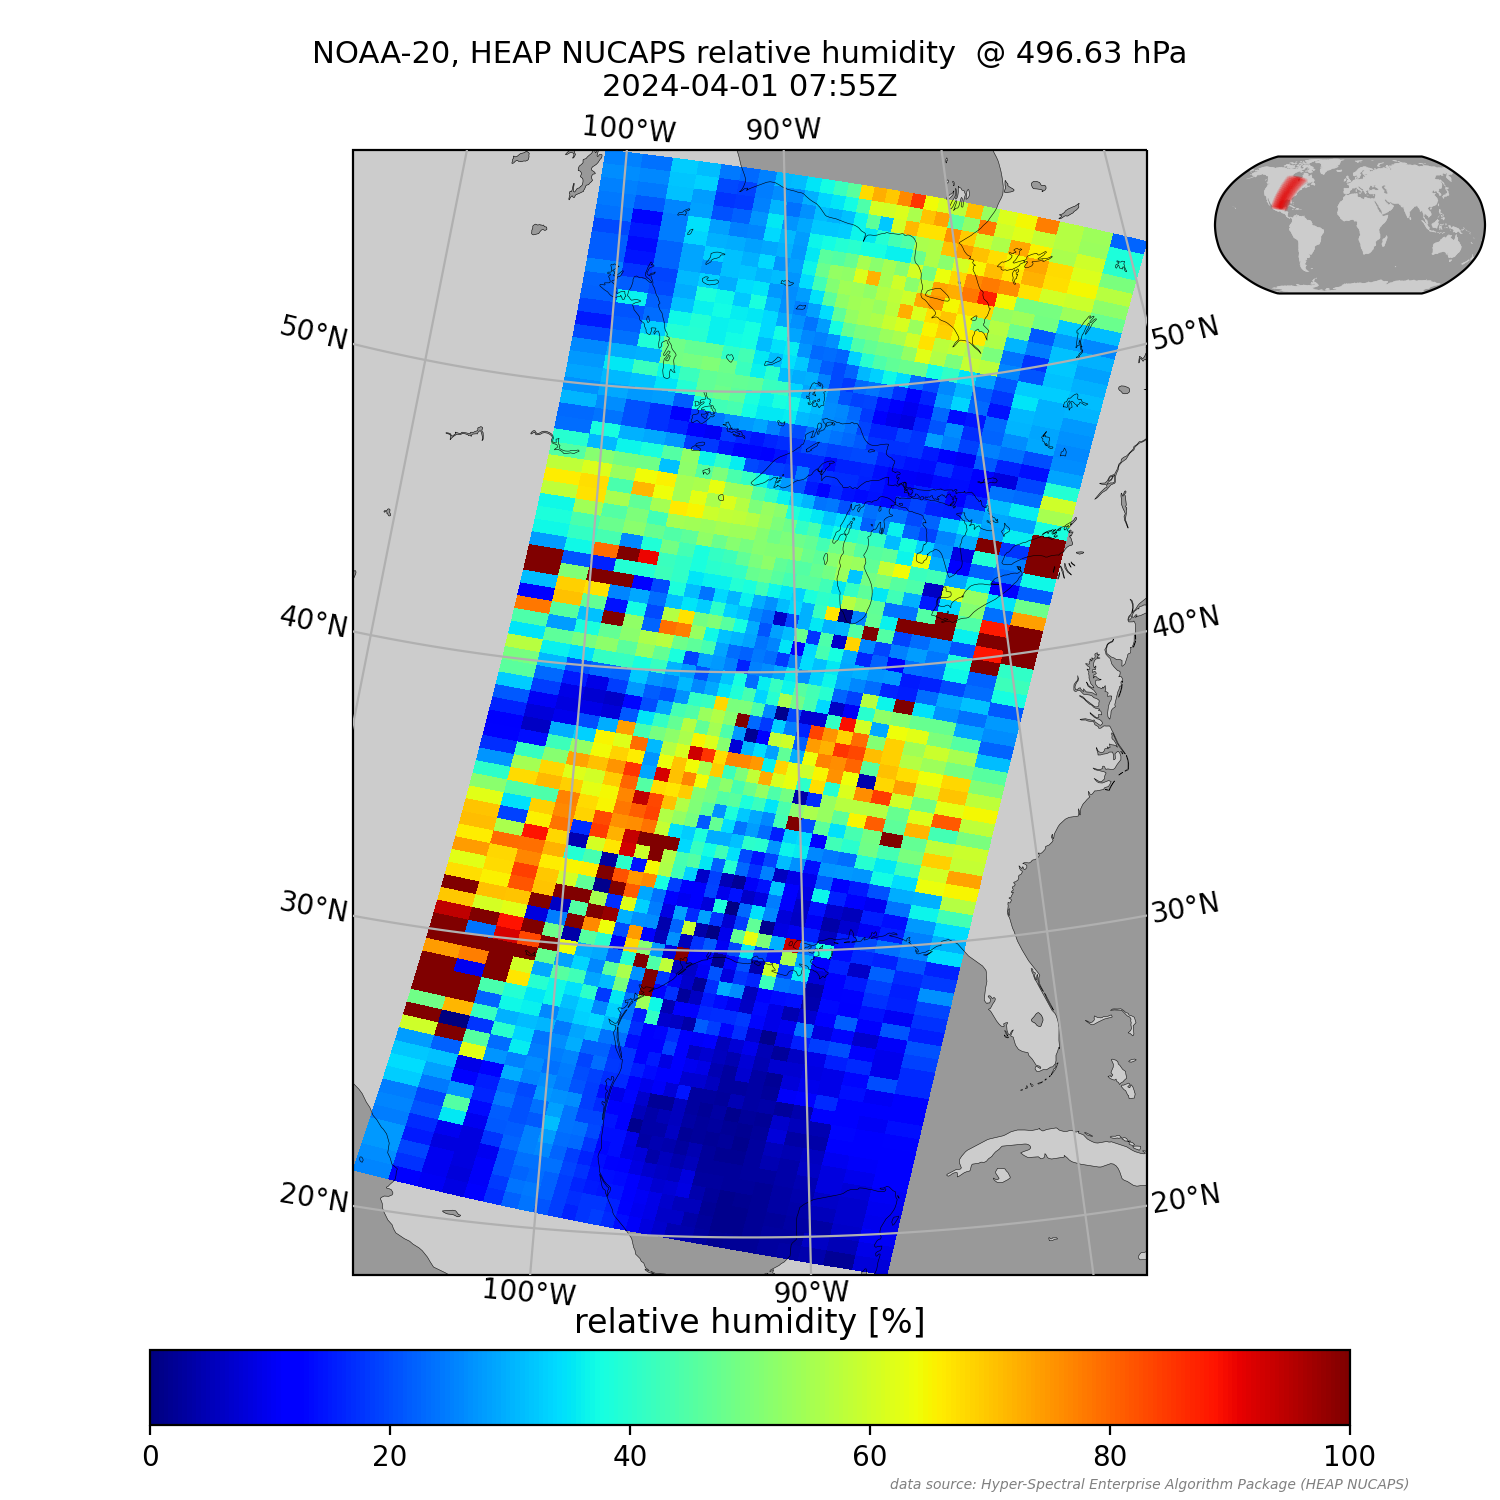
CIMSS Scientists have adjusted the presentation of individual thermodynamic variables produced from HEAP (NUCAPS) profiles for NOAA-20 overpasses that are available here in near-real time (at that website, chose j01 (that is, NOAA-20), crisfsr, and then images); HEAP software that supports NOAA-21 data is not yet available. Previously (above) values were color-coded for the entire size of the gridded CrIS/ATMS footprint. Now (below), values are color-coded for the centroid of the that same footprint. Analyses are provided via the CSPP Leo Direct Broadcast processing for thermodynamic (Temperature, Relative Humidity, Dewpoint and water vapor mixing ratio) at 247, 496, 753 and 904 mb.
HEAP point analysis of 493mb Relative Humidity, 0755 UTC on 1 April 2024 (Click to enlarge)

