This website works best with a newer web browser such as Chrome, Firefox, Safari or Microsoft
Edge. Internet Explorer is not supported by this website.
10-minute Full Disk scan GOES-18 (GOES-West) True Color RGB images created using Geo2Grid (above) showed a von Kármán vortex street — created by north-northwesterly winds interacting with the western tip of Nelson Island, Alaska — propagating south across the Bering Sea on 20 March 2025. In addition, through breaks in cloud cover the tidal... Read More
GOES-18 True Color RGB images, from 1730 UTC on 20 March to 0440 UTC on 21 March [click to play animated GIF | MP4]
10-minute Full Disk scan GOES-18 (GOES-West) True Color RGB images created using Geo2Grid(above) showed a von Kármán vortex street — created by north-northwesterly winds interacting with the western tip of Nelson Island, Alaska — propagating south across the Bering Sea on 20 March 2025. In addition, through breaks in cloud cover the tidal ebb and flow of sea ice was apparent.
The vortices were also evident in Suomi-NPP Visible images valid at 2202 UTC and 2342 UTC (below).
Suomi-NPP VIIRS Visible (0.64 µm) images, valid at 2202 UTC and 2342 UTC on 20 March [click to enlarge]
In a toggle between the 2202 UTC Suomi-NPP VIIRS Visible image and Topography (below), an arc of slightly elevated terrain along the far western tip of Nelson Island (abruptly rising to around 900 ft, darker shades of tan) likely perturbed the northerly flow enough to initiate formation of the von Kármán vortices.
Suomi-NPP VIIRS Visible (0.64 µm) image valid at 2202 UTC + Topography [click to enlarge]
Special thanks to Jason Ahsenmacher (NWS Fairbanks) for bringing this interesting feature to my attention.
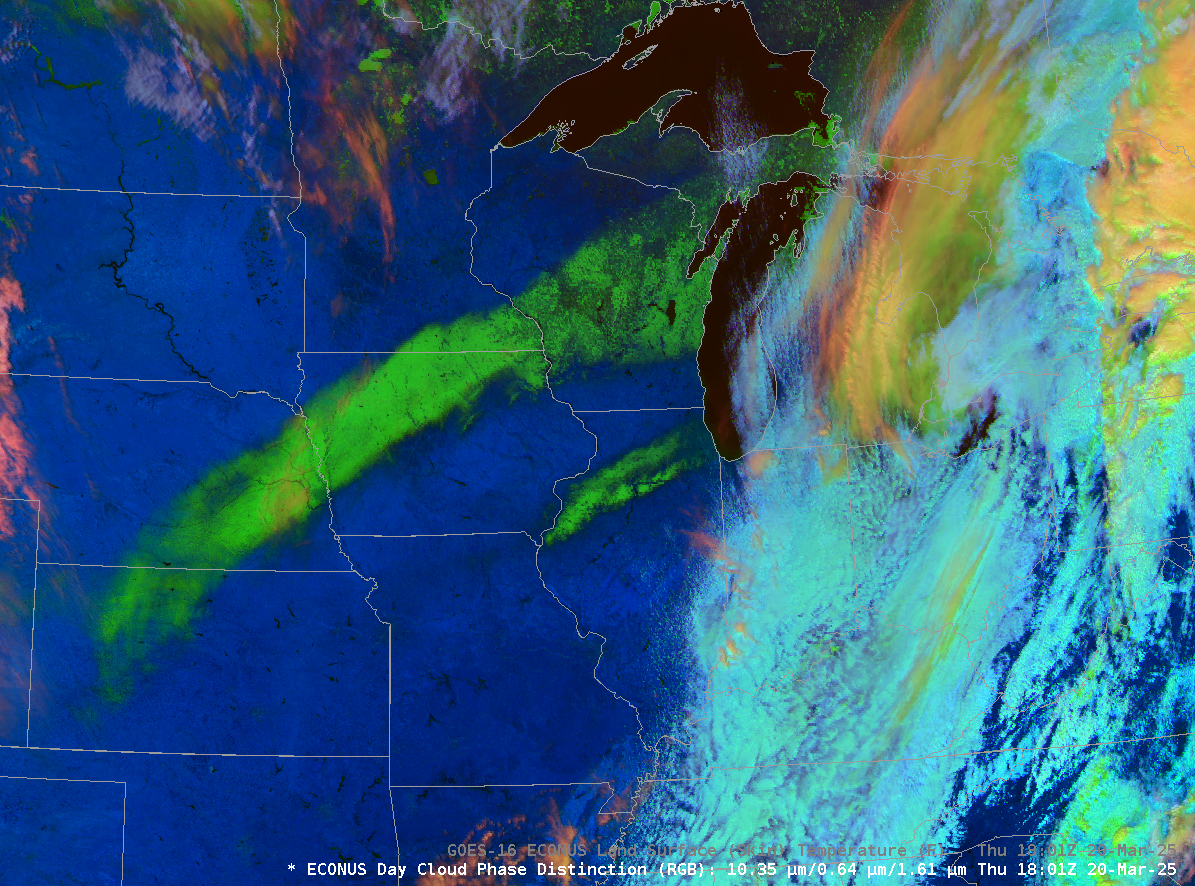
The Slider above compares the Day Cloud Phase Distinction RGB over the central United States with the derived Land Surface Temperature (LST), an hourly Level-2 product. Two snow bands over the central United States are a characteristic bright green in the RGB because there are minimal contributions there in the red and blue.... Read More
The Slider above compares the Day Cloud Phase Distinction RGB over the central United States with the derived Land Surface Temperature (LST), an hourly Level-2 product. Two snow bands over the central United States are a characteristic bright green in the RGB because there are minimal contributions there in the red and blue. The frozen lakes over northern Minnesota share the bright green color in the RGB. Land Surface Temperature over the snow (around 30oF in Iowa) is very different from the bare ground on either side (low/mid-60s F). LST values over the snow in Kansas are above freezing, so you might expect the snow there to melt more quickly. (This toggle compares 1701 and 2016 UTC imagery, and the erosion of snow over Kansas, Nebraska and Illinois is obvious).
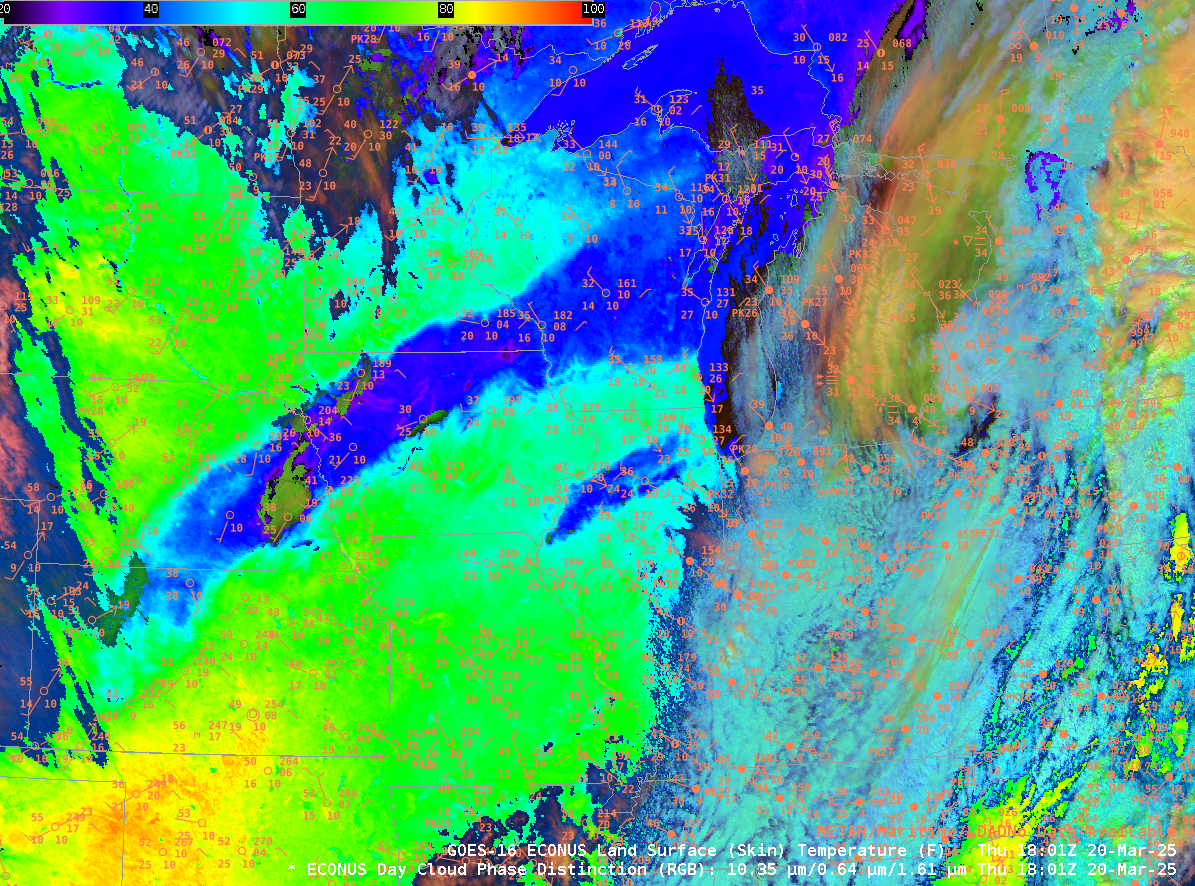
Surface observations plotted over the Land Surface Temperature plot, below, show that temperatures at thermometer level (typically about 1.5 m above the ground) are far cooler than the surface skin temperature under the strong March Sun on the Equinox.
GOES-16 Day Cloud Phase Distinction and Land Surface Temperature in clear air, 1801 UTC on 20 March 2025 (Click to enlarge)
An active weather pattern has produced another strong storm over the Great Plains of the United States on 18-19 March, and another dust storm. Dust RGB Imagery, above, shows the evolution of the dust plume (in magenta/pink in the RGB) from Mexico into the western Great Lakes. The pink occurs because of a strong... Read More
GOES-East Dust RGB imagery, 1801 UTC 18 March 2025 – 1346 UTC 19 March 2025 (Click to enlarge)
An active weather pattern has produced another strong storm over the Great Plains of the United States on 18-19 March, and another dust storm. Dust RGB Imagery, above, shows the evolution of the dust plume (in magenta/pink in the RGB) from Mexico into the western Great Lakes. The pink occurs because of a strong contribution from the Split Window Difference (10.3 µm – 12.3 µm) imagery (Quick Guide); an animation of that is here, the dust is brown in the animation. The Split Window Difference is also the Red component of the Night Microphysics RGB (Quick Guide), so that RGB can also give a view of Dust Plumes at night (as shown in this blog post).
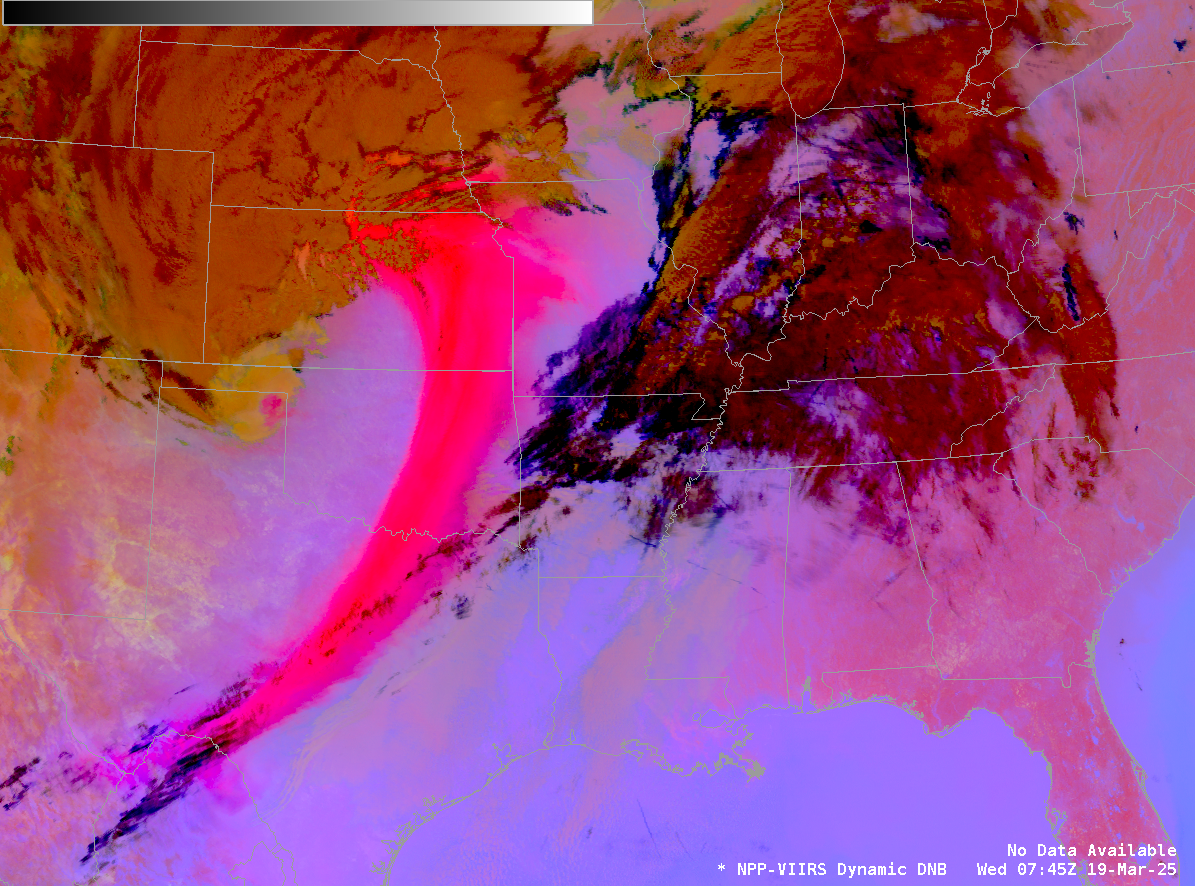
VIIRS has a Day Night Band that can be used to detect dust plumes (or smoke plumes) at night, given sufficient lunar illumination. In the 0745 UTC Day Night Band image below, toggled with the GOES-based Dust RGB (one could also compute a Dust RGB image from VIIRS data!), the dust cloud is a apparent from central Texas northward through eastern Oklahoma and eastern Kansas.
VIIRS Day Night Band visible (0.7 µm) imagery and GOES-16 Dust RGB, 0745 UTC on 19 March 2025 (click to enlarge)
True Color Imagery and GOES-16 Aerosol Optical Depth, 18 March 2025, 1501 – 1906 UTC.
________________
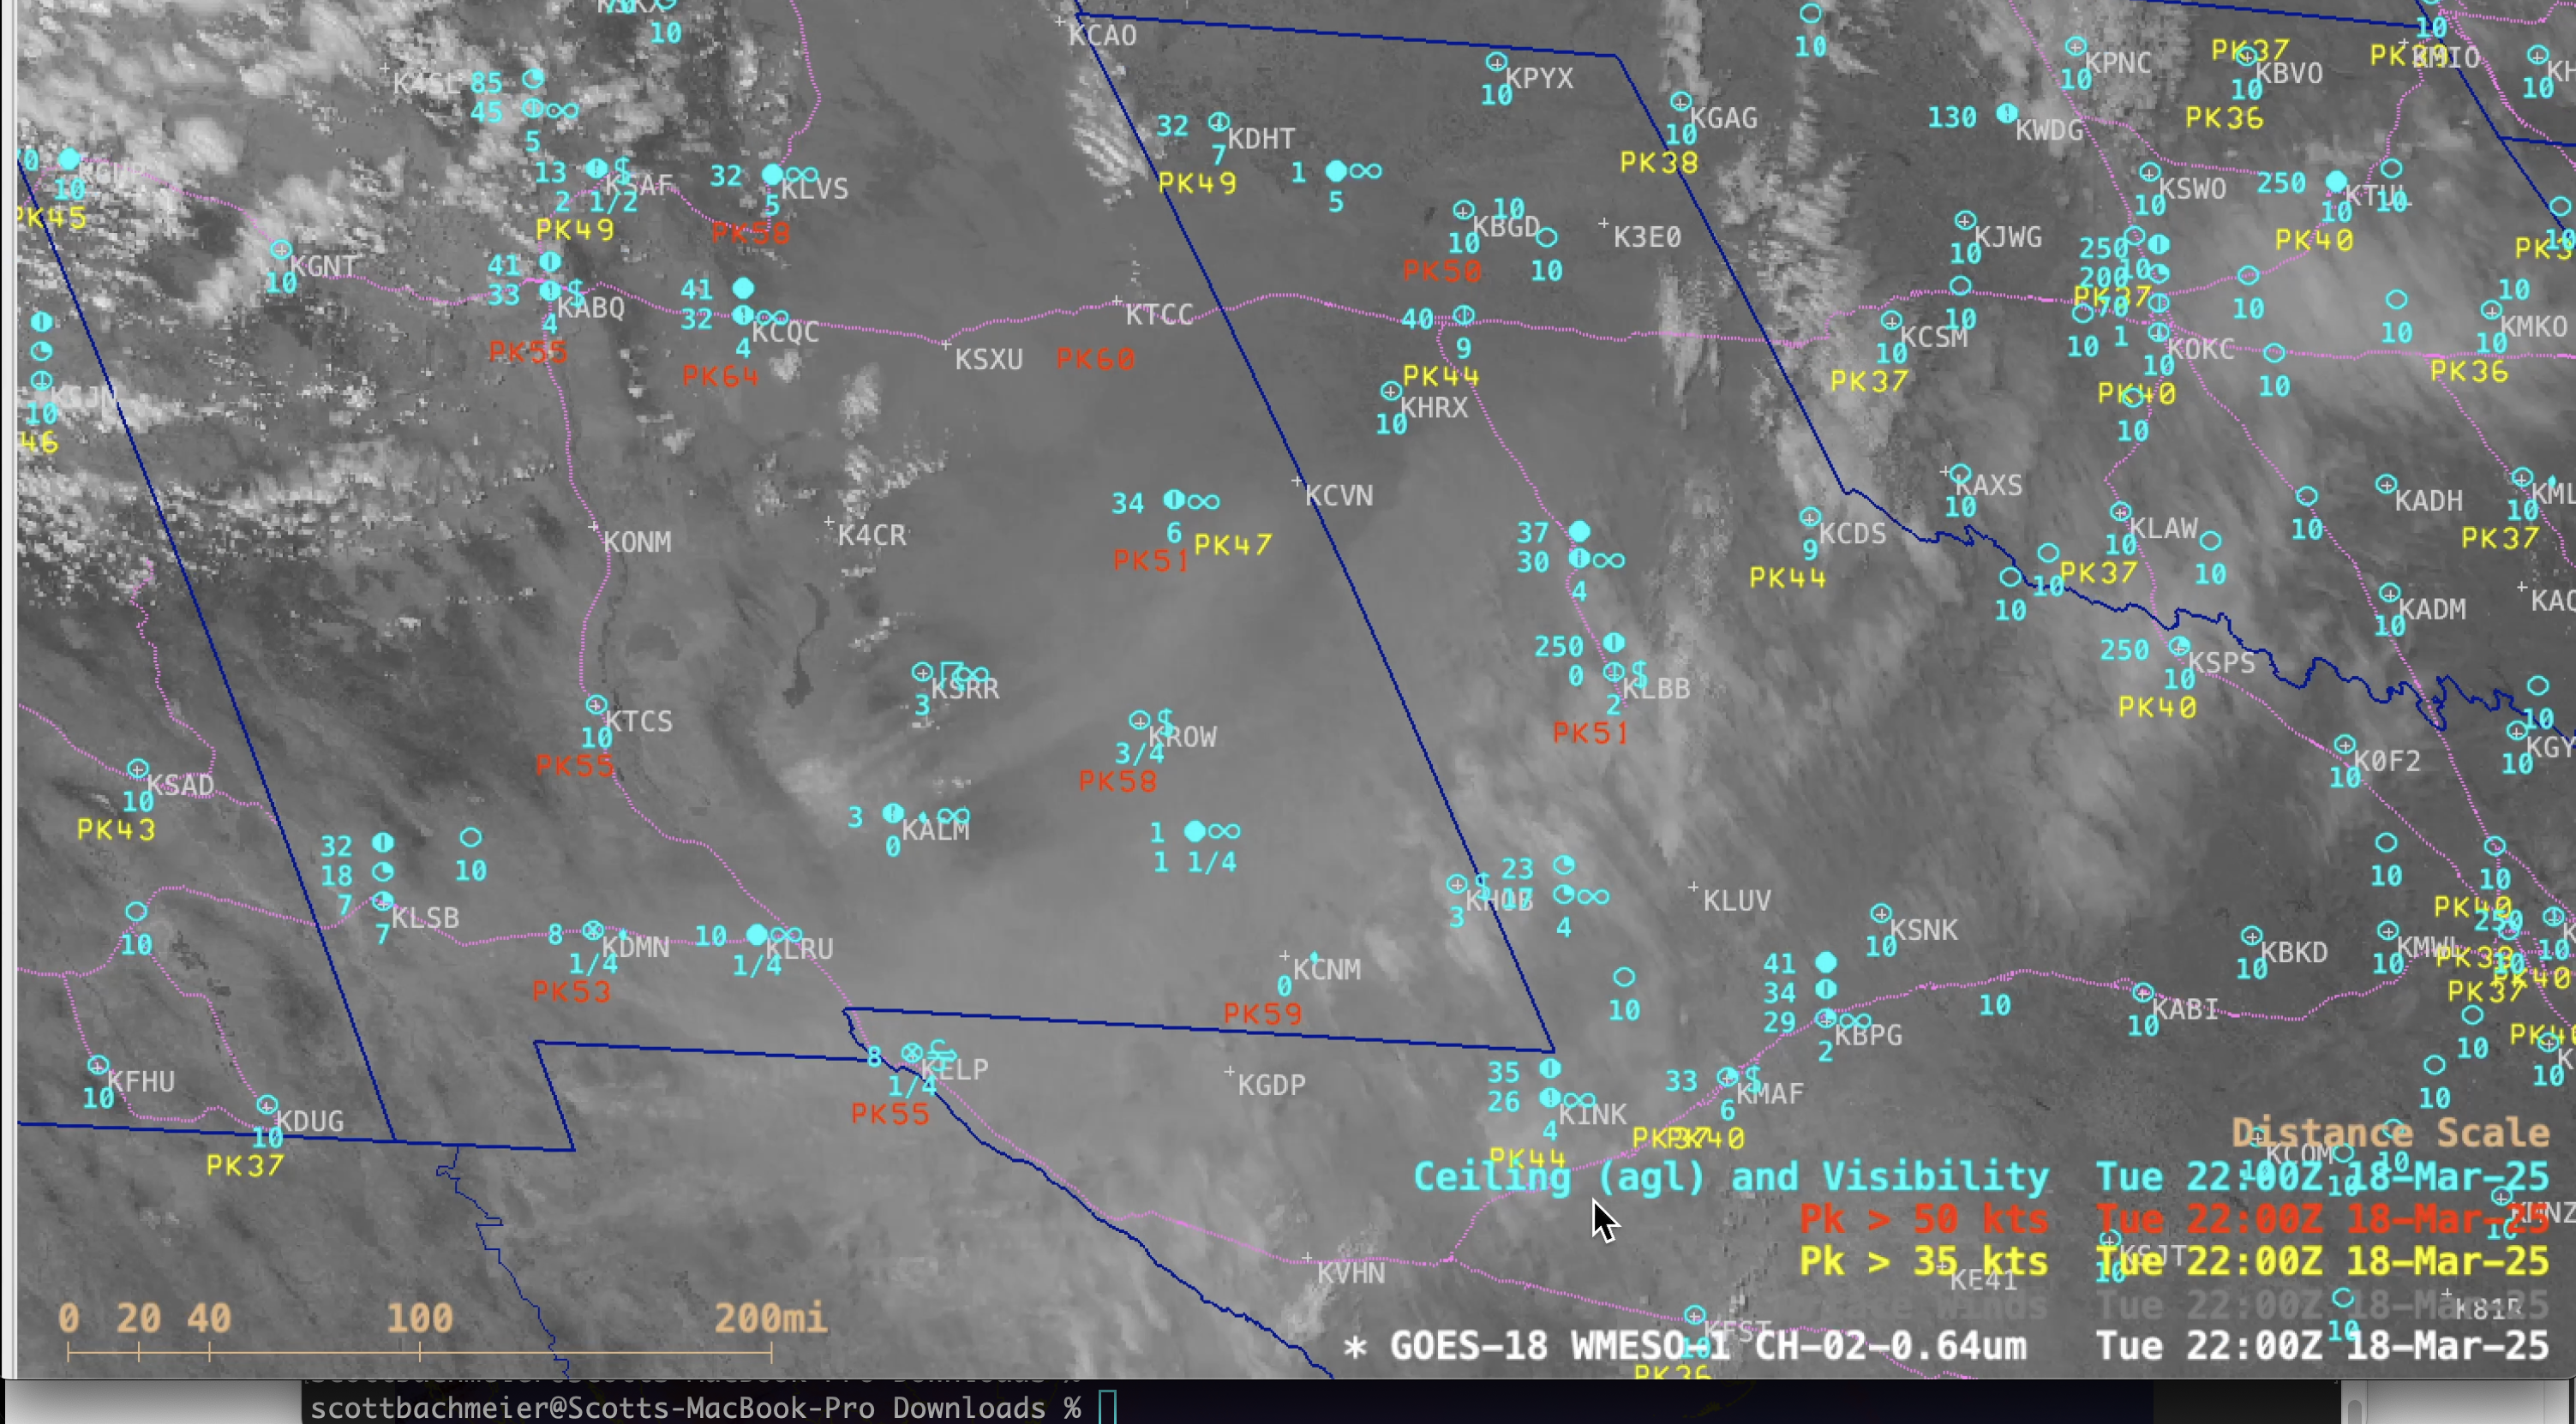
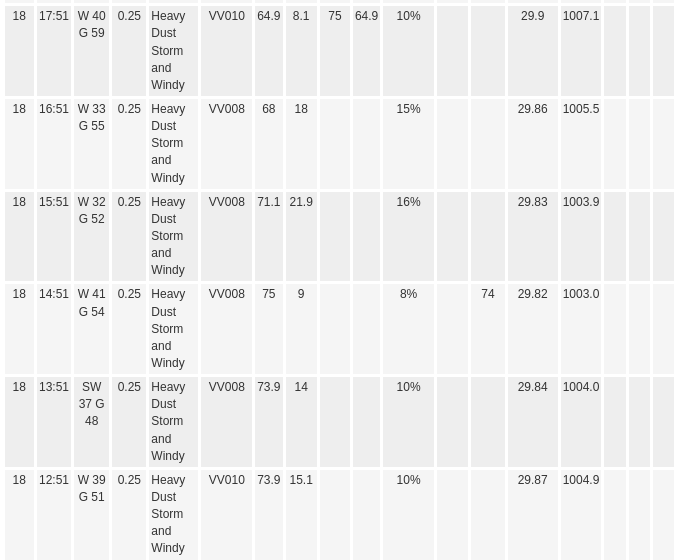
1-minute GOES-18 Visible images with 30-minute plots of Peak Wind Gusts (yellow/red) and hourly plots of Ceiling/Visibility (cyan), from 1501 UTC on 18 March to 0030 UTC on 19 March (courtesy Scott Bachmeier, CIMSS) [click to play MP4 animation]
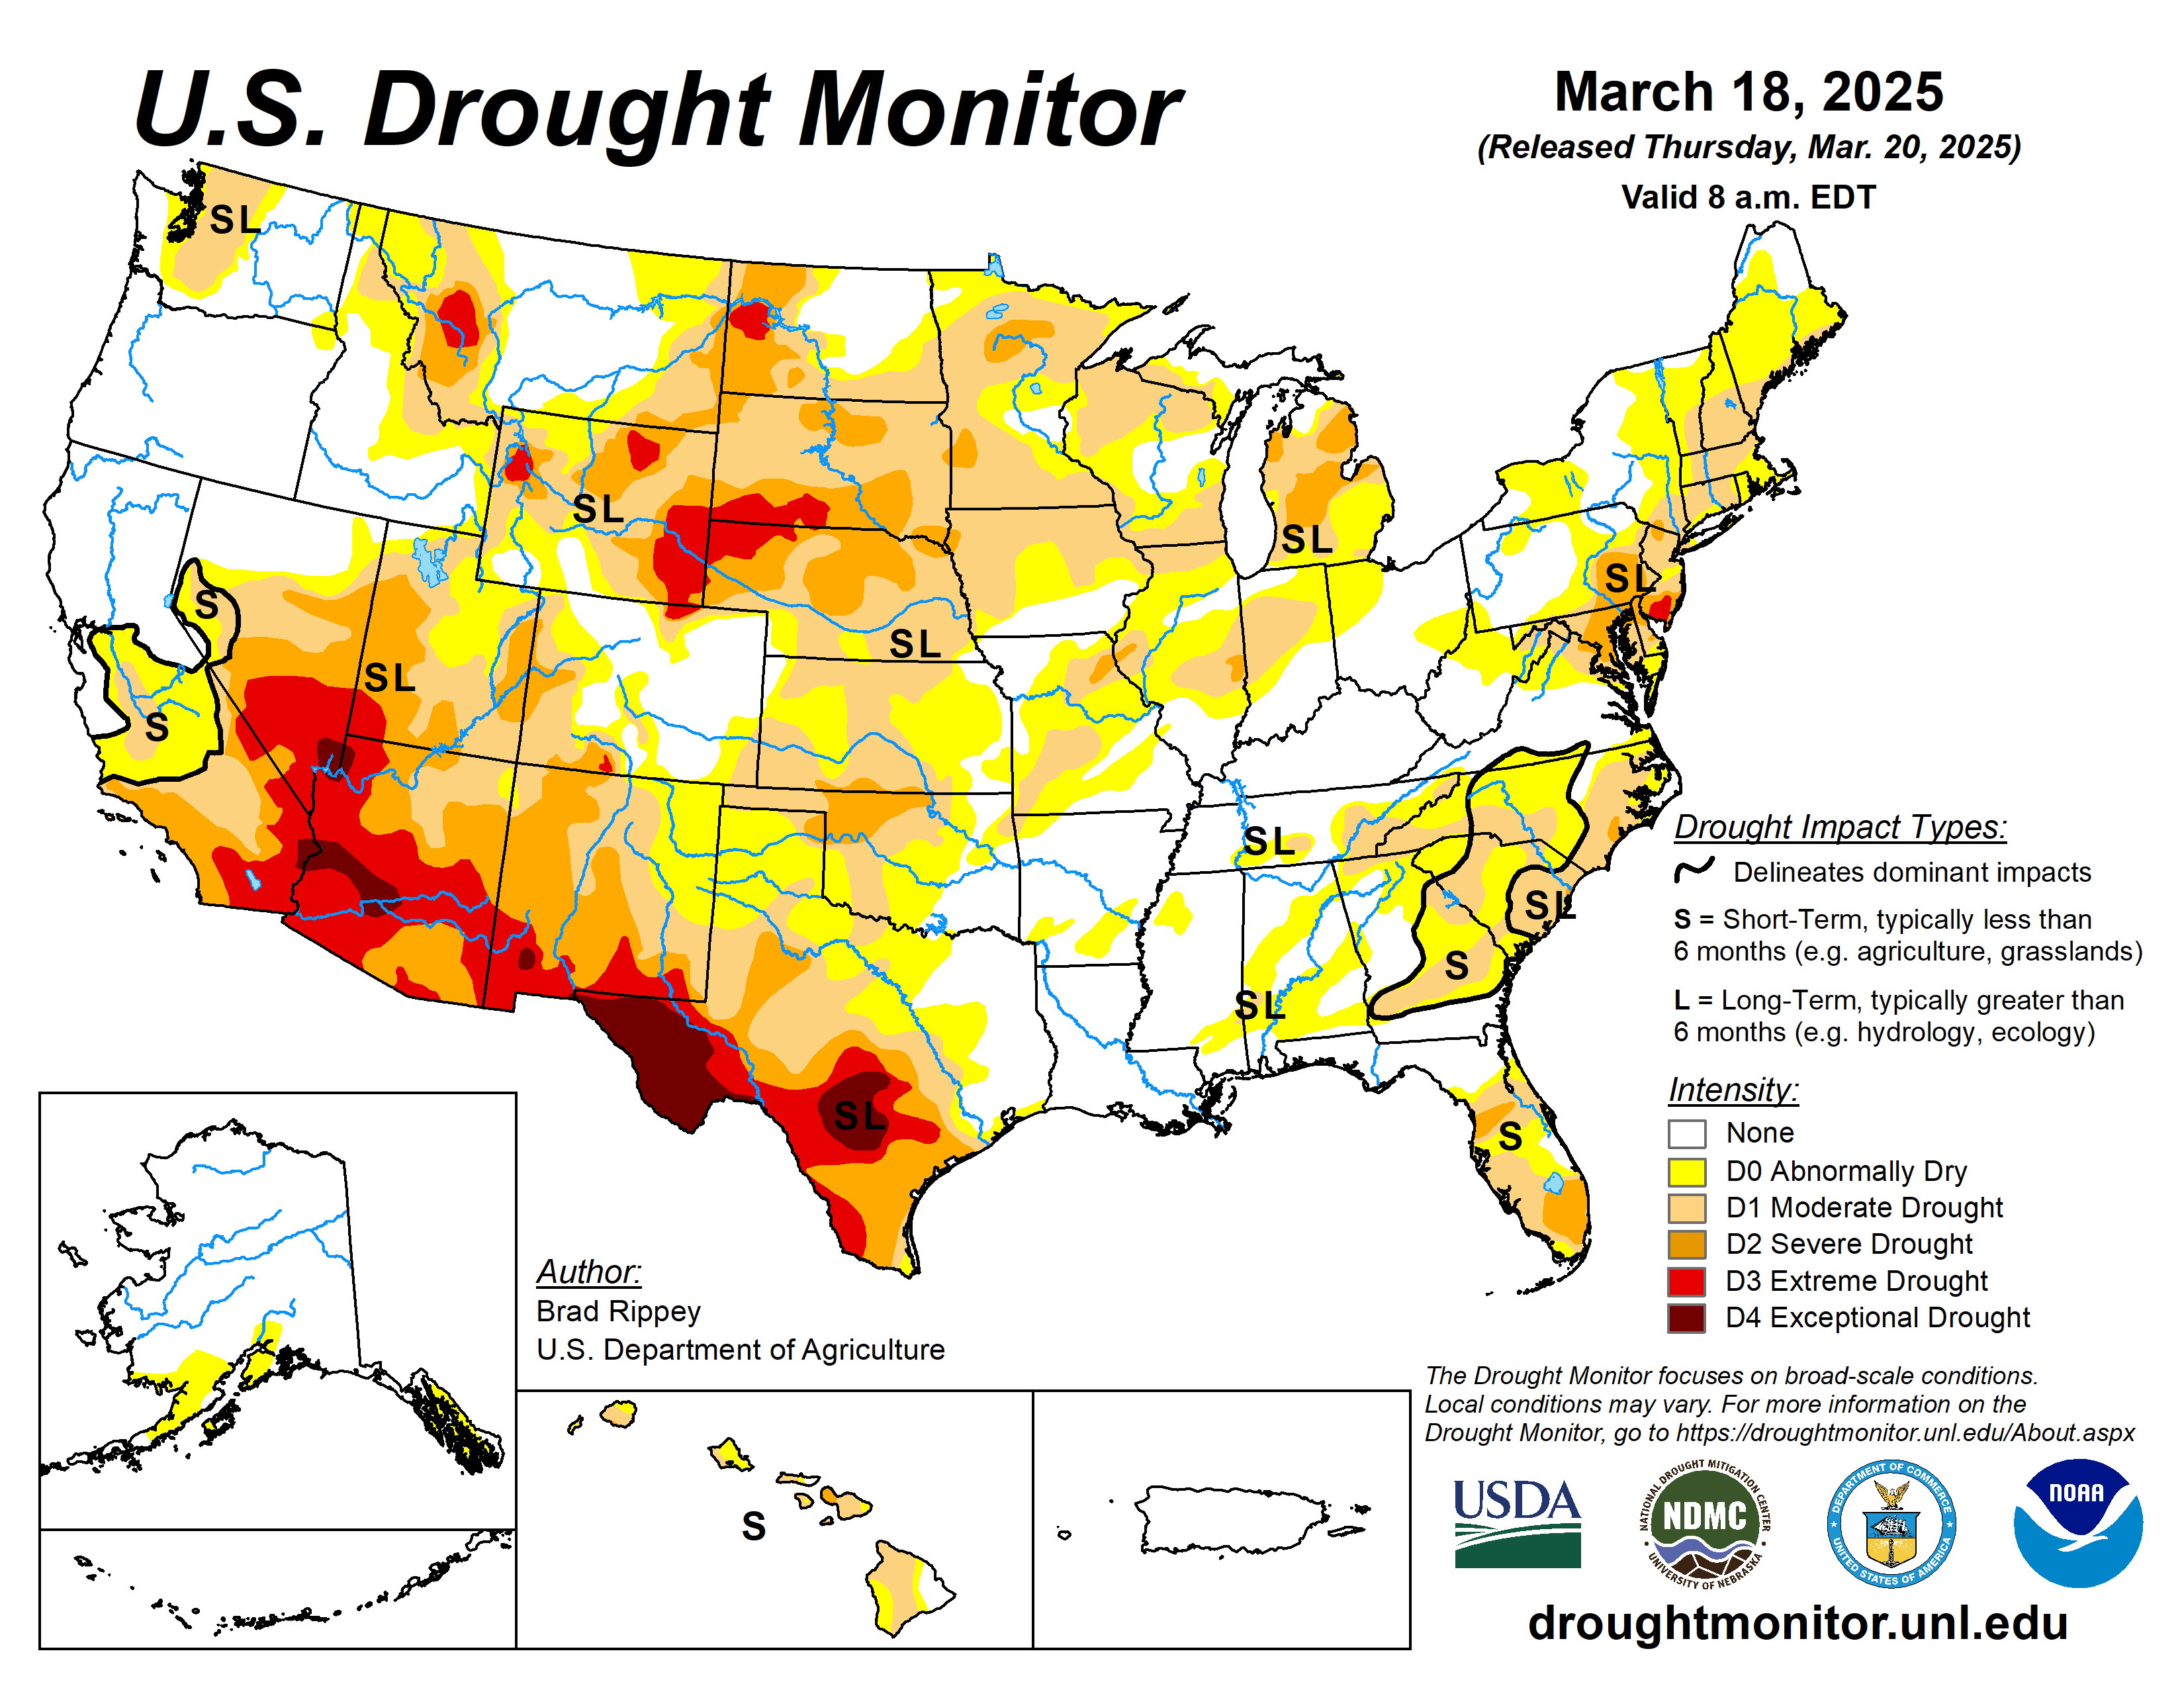
1-minute Mesoscale Domain Sector GOES-18 (GOES-West) Visible images (above) included plots of 30-minute Peak Wind Gusts and hourly Ceiling/Visibility — which showed Peak Wind Gusts as high as 65 kts (75 mph) at METAR sites Roswell, New Mexico (KROW) and El Paso, Texas (KELP), although there were wind gusts to 101 mph at higher elevations (these strong winds in tandem with severe to exceptional drought conditions were conducive to create such a pronounced blowing dust event). The surface visibility was reduced to 1/4 mile (or even near zero) at several sites from El Paso to southern New Mexico.
10-minute Full Disk scan True Color RGB and nighttime Dust RGB images from GOES-18 (GOES-West), GOES-19 (Preliminary/Non-operational) and GOES-16 (GOES-East) created using Geo2Grid(below) displayed distinct signatures of the dense blowing dust that originated over parts of northern Mexico and southern New Mexico — and was subsequently transported northeastward across parts of Texas, Oklahoma and Kansas during the 15-hour period shown. There was also a notable plume of blowing dust/sand whose source was White Sands National Park in southern New Mexico. In addition, of interest was a small circular pocket of dust that became entrained into the center of low pressure that was located near the Colorado/Kansas/Oklahoma border at 0600 UTC.
True Color RGB and nighttime Dust RGB images from GOES-18 (left), GOES-19 (Preliminary/Non-operational, center) and GOES-16 (right), from 1500 UTC on 18 March to 0600 UTC on 19 March (courtesy Scott Bachmeier, CIMSS) [click to play animated GIF | MP4]
Blizzards, dust storms, fires, floods, thunderstorms and tornadoes were the result of very strong back-to-back negatively tilted shortwave troughs through the eastern half of the U.S. From Texas to Wisconsin, New York to Florida, severe wind gusts, large hail, and deadly tornadoes were recorded. The hardest hit states during the... Read More
Blizzards, dust storms, fires, floods, thunderstorms and tornadoes were the result of very strong back-to-back negatively tilted shortwave troughs through the eastern half of the U.S. From Texas to Wisconsin, New York to Florida, severe wind gusts, large hail, and deadly tornadoes were recorded. The hardest hit states during the three-day severe weather outbreak (as far as thunderstorm hazards are concerned) were Missouri, Arkansas, Mississippi, and Alabama.
The GOES-16 ABI water vapor RGB animation below (courtesy of College of Dupage) shows the development and occlusion of the low-pressure system on 3/14-15, evidenced by the beautiful spiral vortex in the middle of the country. On its heels, another shortwave trough further south spawned several rounds of intense thunderstorms, tapping into the rich Gulf moisture on 3/15. This latter system would then menace the eastern U.S. on 3/16, particularly Ohio, West Virginia, Pennsylvania, and New York.
Simple water vapor RGB imagery from GOES-16, from the College of Dupage NEXLAB. This combines the water vapor channels of the 6.2 µm, 7 µm, and 7.3 µm bands.
The NOAA/CIMSS ProbSevere system of models are used to provide forecasters automated guidance to convective weather threats in the short term, generally 0-60 minutes. While there are plenty of examples to look at, I will focus on some strong tornadic supercells in southern Mississippi.
LightningCast, a trained AI/ML model, uses solely GOES-R ABI data to predict next-hour lightning. It is intended to aid forecasters in providing impact-based decision support (IDSS) to partners, but also to provide general convective initiation guidance. In the line of quickly developing storms from far southwest Mississippi, zipping down into eastern Louisiana, LightningCast was able to give anywhere from 15 to 30 minutes of lead time to lightning initiation (measured from the yellow 30% contour in the animation below). Considering the rapid evolution of these cells, and the overall busy situation of the day, this could really help provide forecasters with some advanced notice of sustained convection in a dangerous environment.
Above: The background is the GOES-16 day-cloud-phase-distinction RGB. The foreground blue-to-red pixels is the GOES-16 GLM flash-extent density. The labeled contours are predictions made by LightningCast.
Once these supercells in Louisiana and southern Mississippi matured, the ProbSevere IntenseStormNet provides an estimate of “intensity” using an image-based AI/ML model. Specifically, it uses images of the 0.64 µm reflectance, 10.3 µm brightness temperature, and GLM flash-extent density to make predictions. While the IntenseStormNet could be used as a satellite-only model for severe weather guidance, it has been incorporated into ProbSevere v3, providing better satellite information at the mature phase of storm development.
Below, in south-central Mississippi, the poor village of Tylertown was hit twice by tornadic supercells in the span of 40 minutes, causing devastating damage. We can see > 90% probabilities from the IntenseStormNet and a string of tornado reports following the line of recent tornado reports. The robust overshooting tops, cold-U/above-anvil cirrus plume signatures, and strong GLM flash cores all contributed to the high probabilities.
Storm chaser Tanner Charles shows the velocity couplets from the Jackson, MS radar passing over very nearly the same location.
ProbSevere version 3 is an upgrade to the operational version 2, and uses more radar, satellite, lightning, and short-term NWP data to better predict severe weather hazards such as wind, hail, and tornadoes.
ProbSevere v3 contours (inner contours are colored by probability of any severe hazards; outer contours are colored by probability of tornado), MRMS Merged Reflectivity, and NWS severe weather warnings.
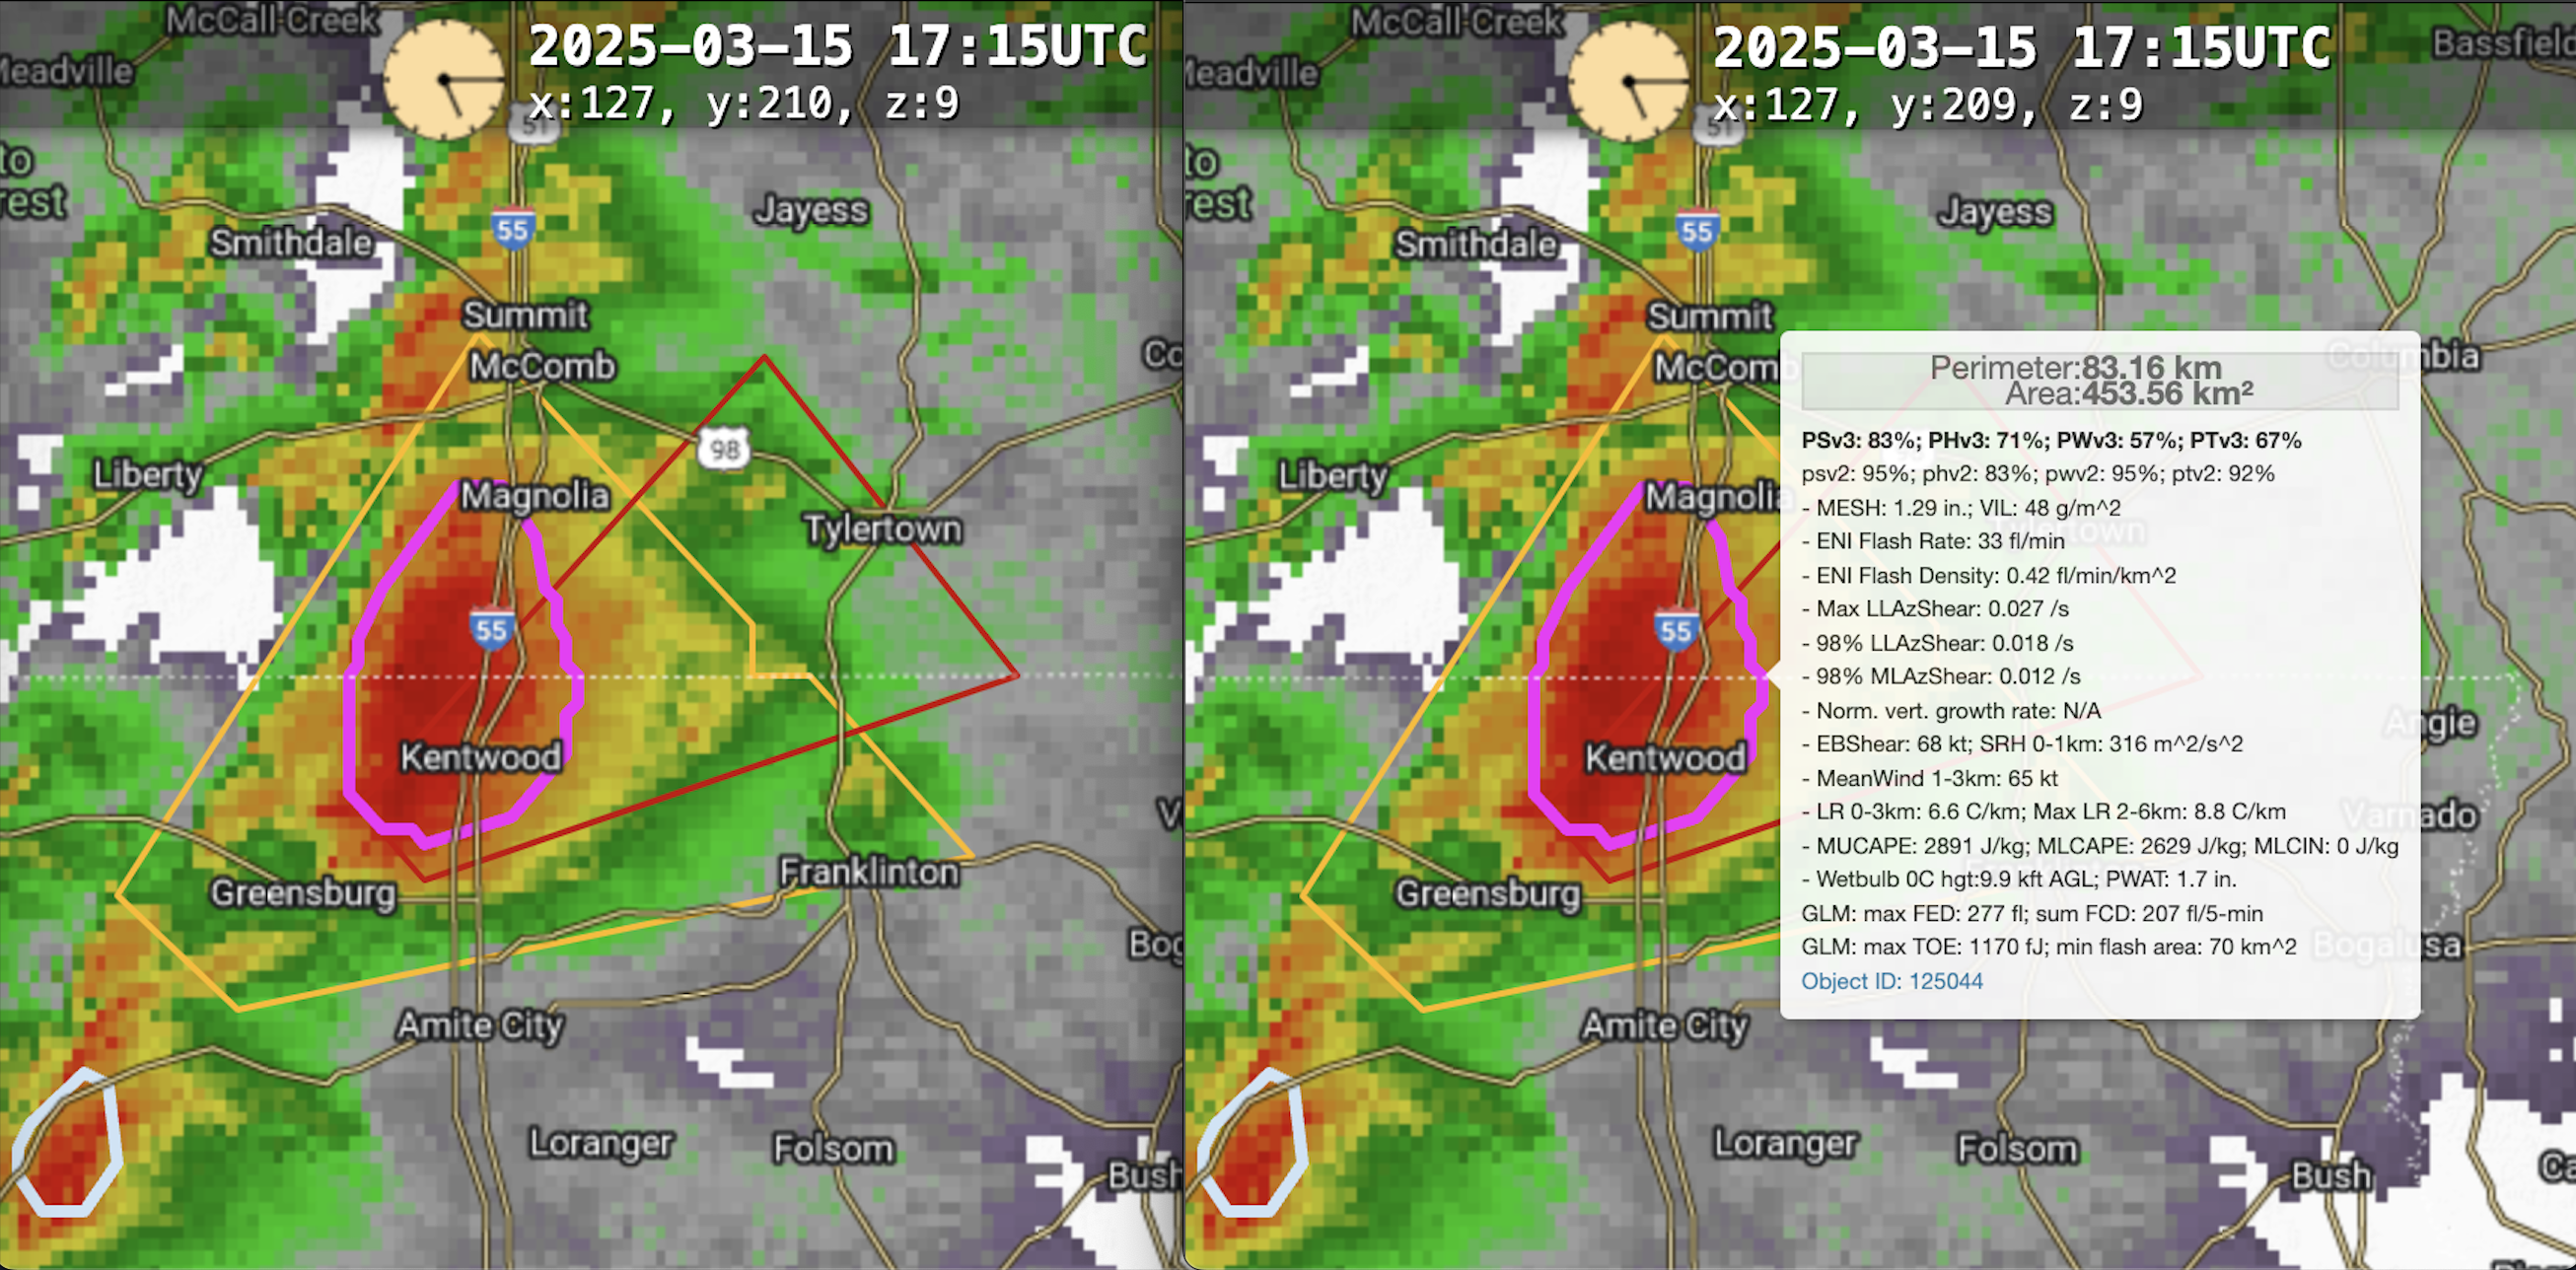
In the first supercell that hit Tylertown, the probability of tornado was 68% at the time of the first NWS tornado warning. This is an extreme value for ProbTor v3. Unsurprisingly, the low-level MRMS AzShear (i.e., low-level rotation) was the top contributor, with the environmental shear, low-level mean wind (closely correlated with 0-1 km shear), and mid-level rotation the next top-contributing predictors. The storm’s flash rate, IntenseStormNet probability, and MLCAPE from the HRRR model provided additional boosts to the probability.
The first supercell to hit Tylertown, MS, shortly after the first tornado warning was issued by NWS (select predictors annotated on the right).
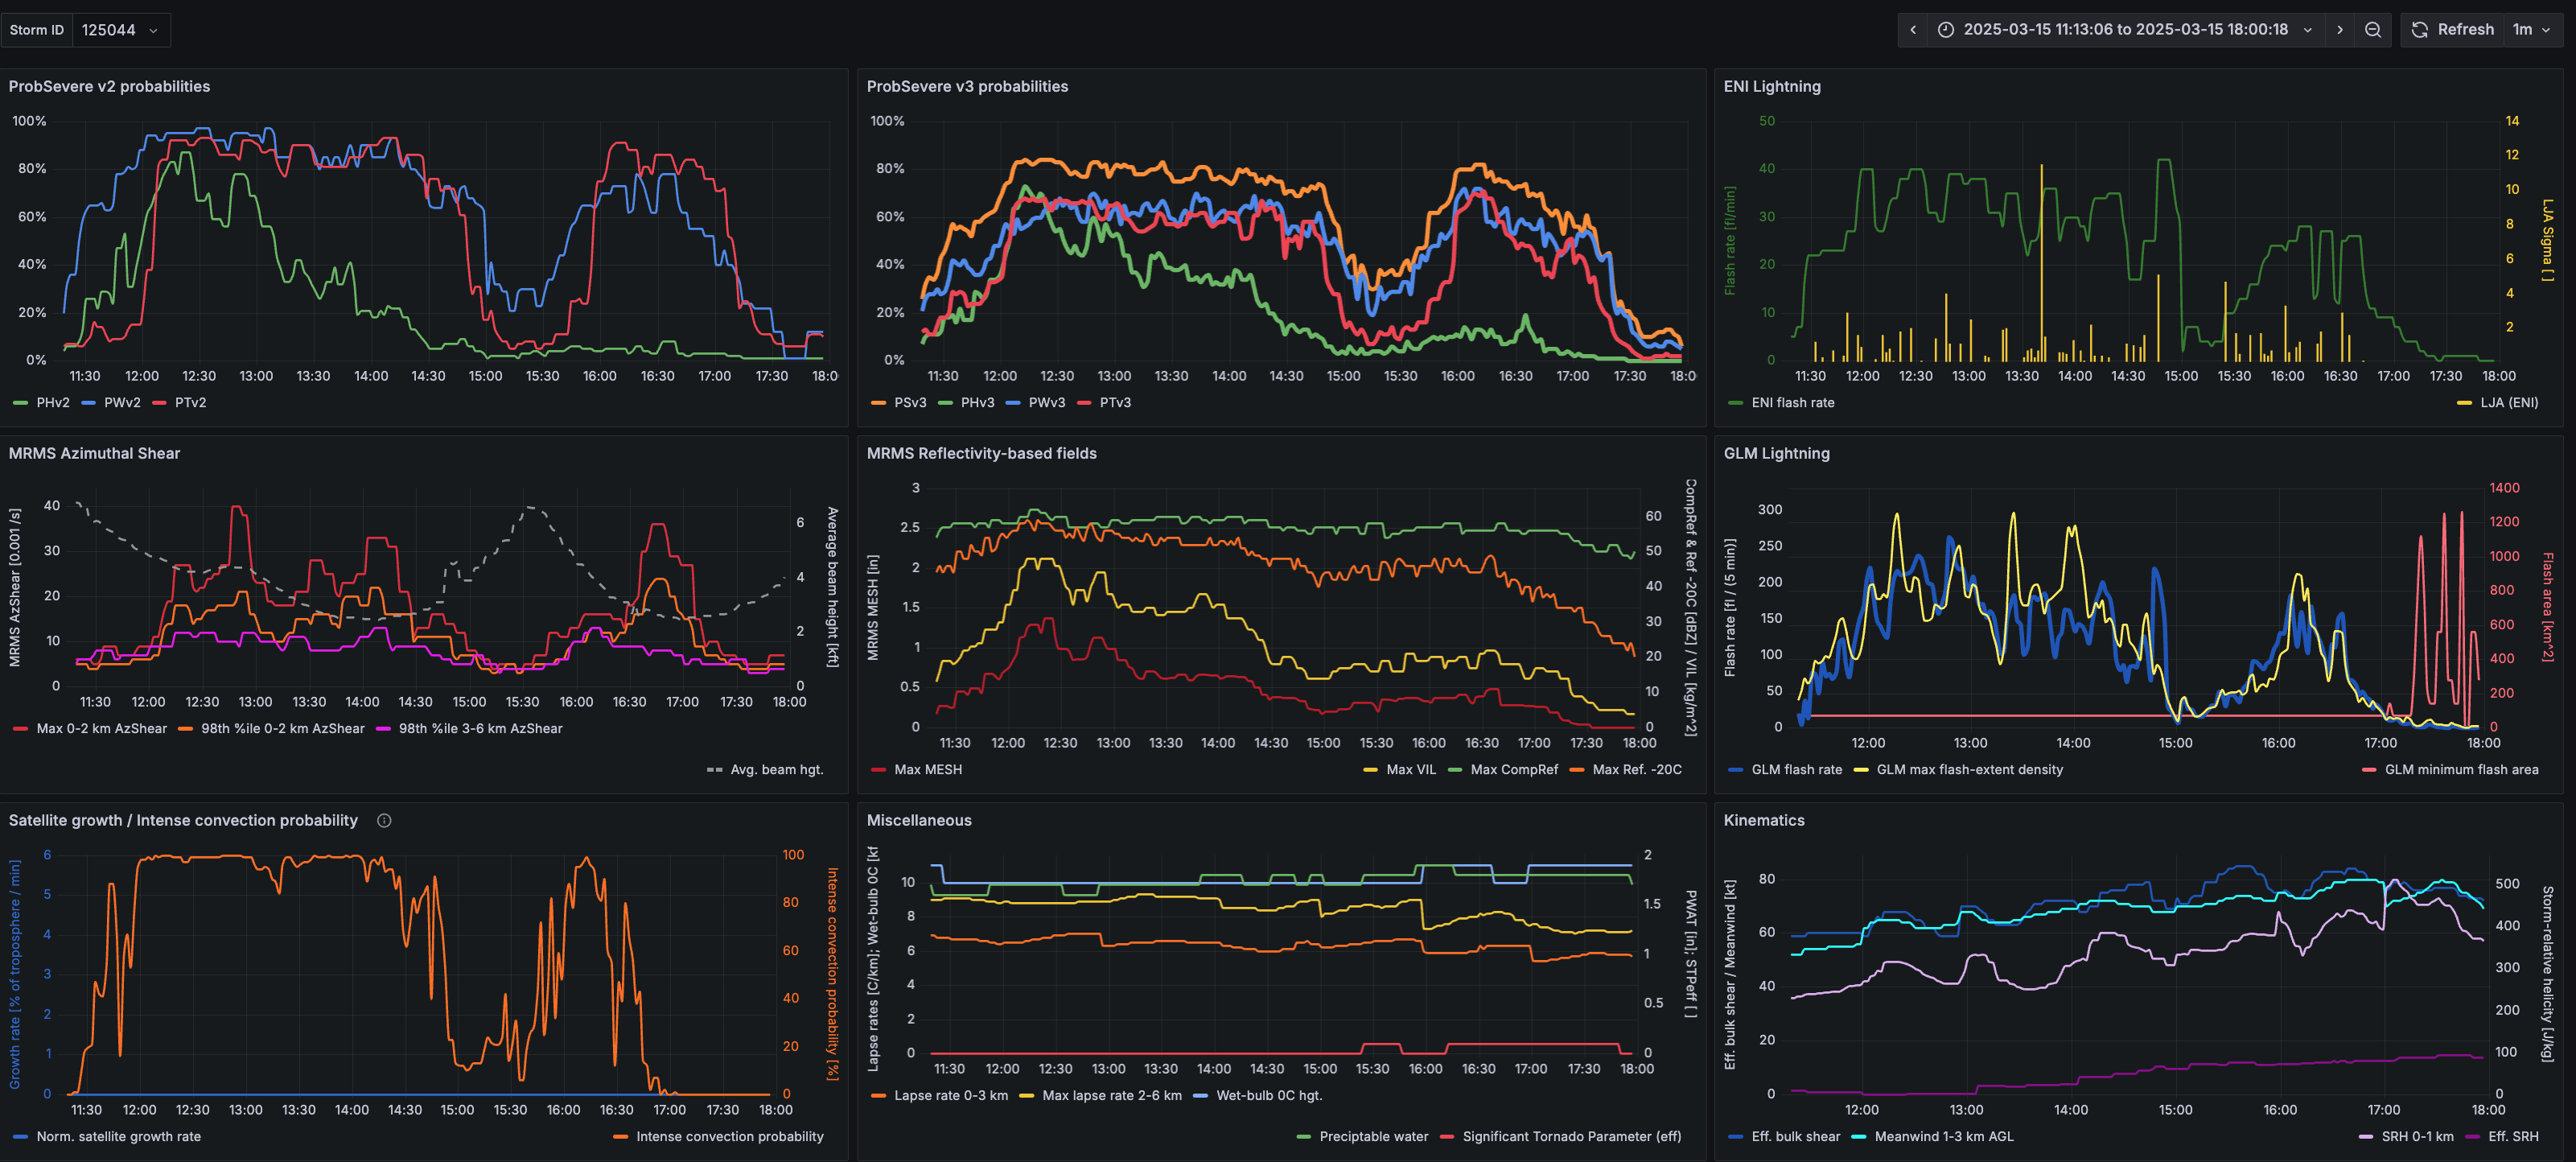
After this first tornadic supercell hit Tylertown, it would produce major tornadoes in Taylorsville, MS, and would go on to produce tornadoes in western Alabama, nearly 200 miles away from Tylertown! The secondary maximum in the ProbTor v3 probability (top center panel, red line) occurred before and during the tornado in western Alabama. Note also how the PTv3 increased before PTv2 as the storm was developing (compare red lines in top left and top center panels), a trend we’ve observed in a number of tornadic storms. ProbSevere v3 is slated to be operational in NOAA this summer (see paper here for more details on the models).
Select time series of data from the first Tylertown supercell.


