This website works best with a newer web browser such as Chrome, Firefox, Safari or Microsoft
Edge. Internet Explorer is not supported by this website.
NOAA was formed on October 3, 1970. To commemorate this date, a few GOES related figures. GOES has been around since 1975, although there were earlier non-operational versions operated by NASA, such as ATS.H/TThese GOES-19 ABI are early images (preliminary and non-operational), beta stage. Both McIDAS-X and geo2grid software was used in... Read More
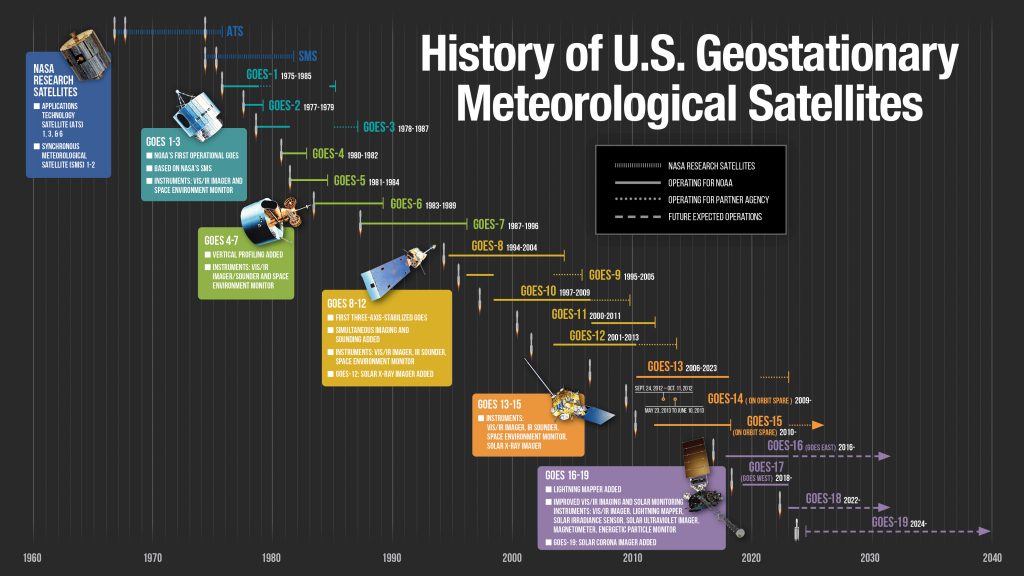
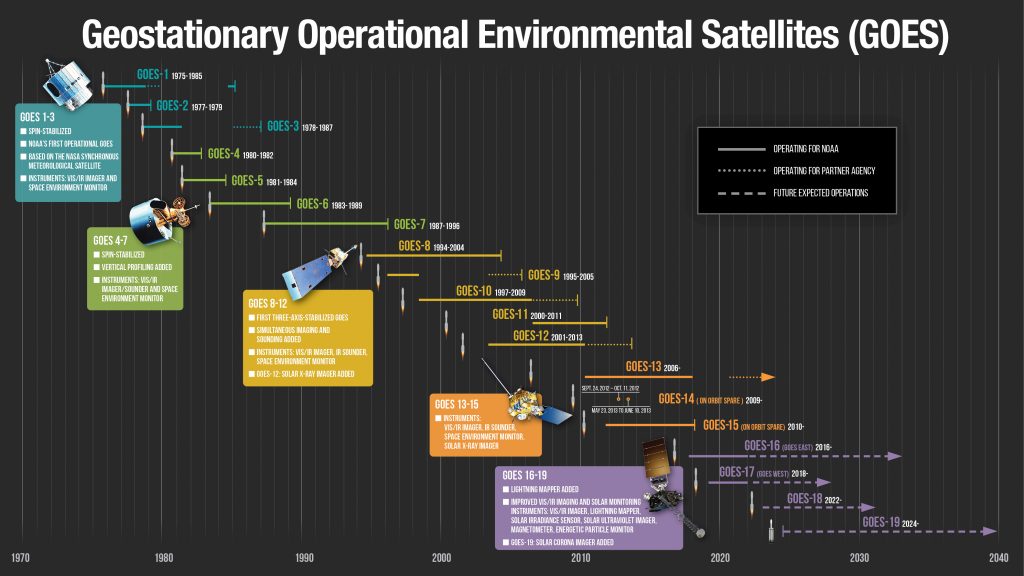
NOAA was formed on October 3, 1970. To commemorate this date, a few GOES related figures. GOES has been around since 1975, although there were earlier non-operational versions operated by NASA, such as ATS.
The continuity of GOES. Note that at the time of this posting, GOES-19 is Preliminary, Non-operationalTimeline of U.S. geostationary weather satellites. Credit: NOAA.Timeline of the GOES over the decades. Credit: NOAA.
H/T
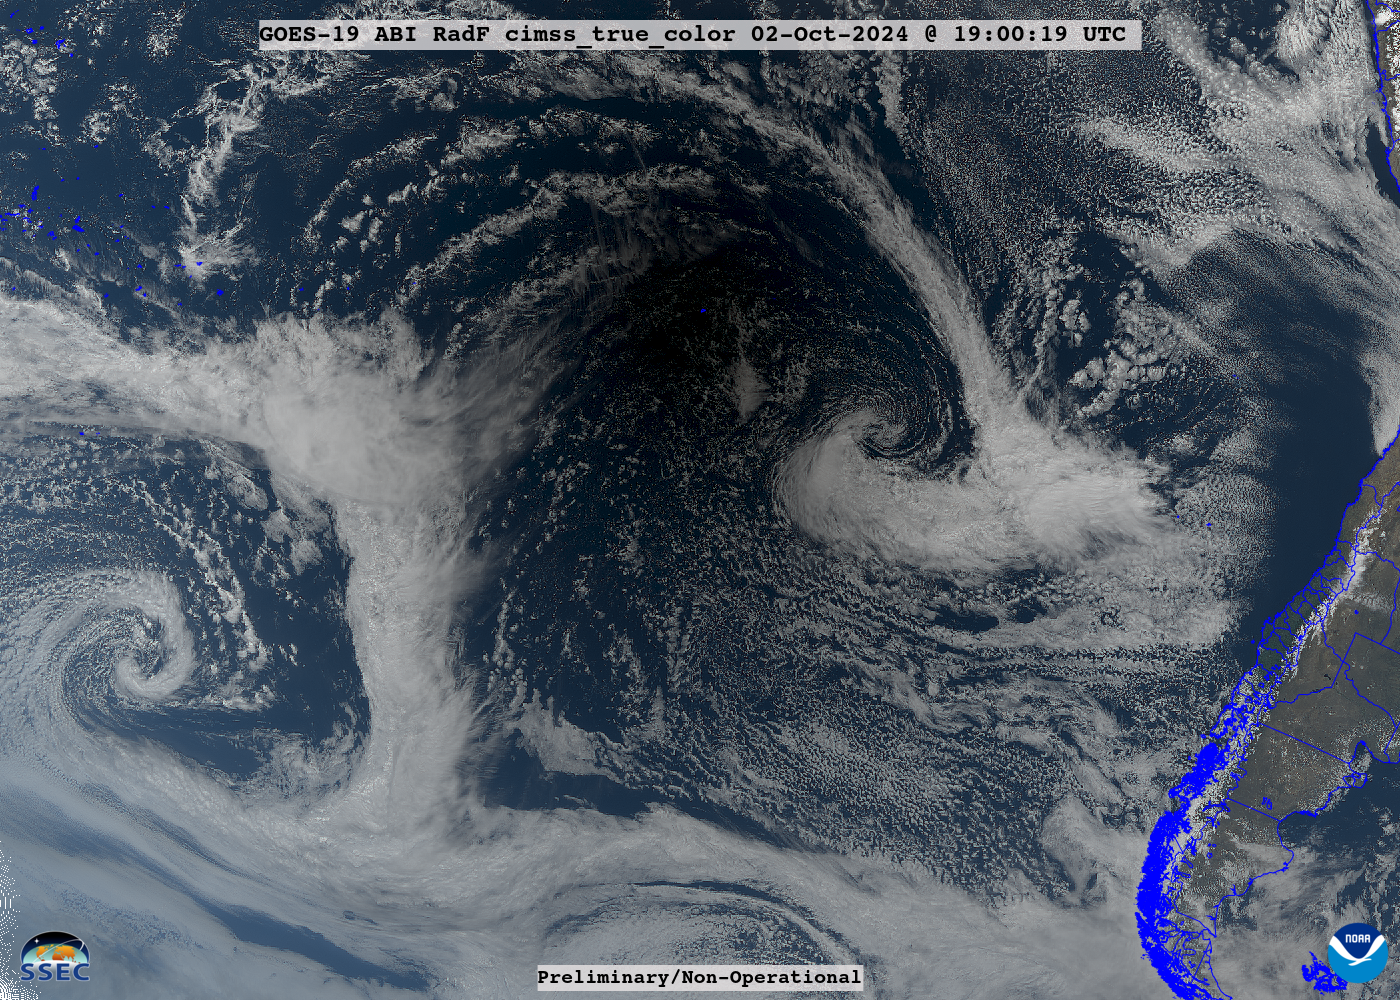
These GOES-19 ABI are early images (preliminary and non-operational), beta stage. Both McIDAS-X and geo2grid software was used in generating these images, using data via the UW/SSEC Data Services. More about GOES-16 and GOES-18. T. Schmit works for NOAA/NESDIS/STAR, from Madison, Wisconsin.
GOES-19 Full Disk CIMSS true color animation from October 2, 2024.GOES-19 CIMSS true color animation from October 2, 2024. (Click to Play)GOES-19 ABI Band 3 (0.86 um) animation from October 2, 2024. (Click to Play.)
In general, images that have been Raleigh-corrected can make the region of the shadow appear larger. Two examples are below (SSEC GOES-West and East) and the CIRA geoColor.
Animation of the true_color composite from GOES-West using geo2grid software. (Click to Play.)Animation of the true_color composite from GOES-East using geo2grid software. (Click to Play.)GOES-18 16-panel full disk over part of October 2, 2024. (Click to Play.)GOES-16 16-panel full disk over part of October 2, 2024. (Click to Play.)
SUVI
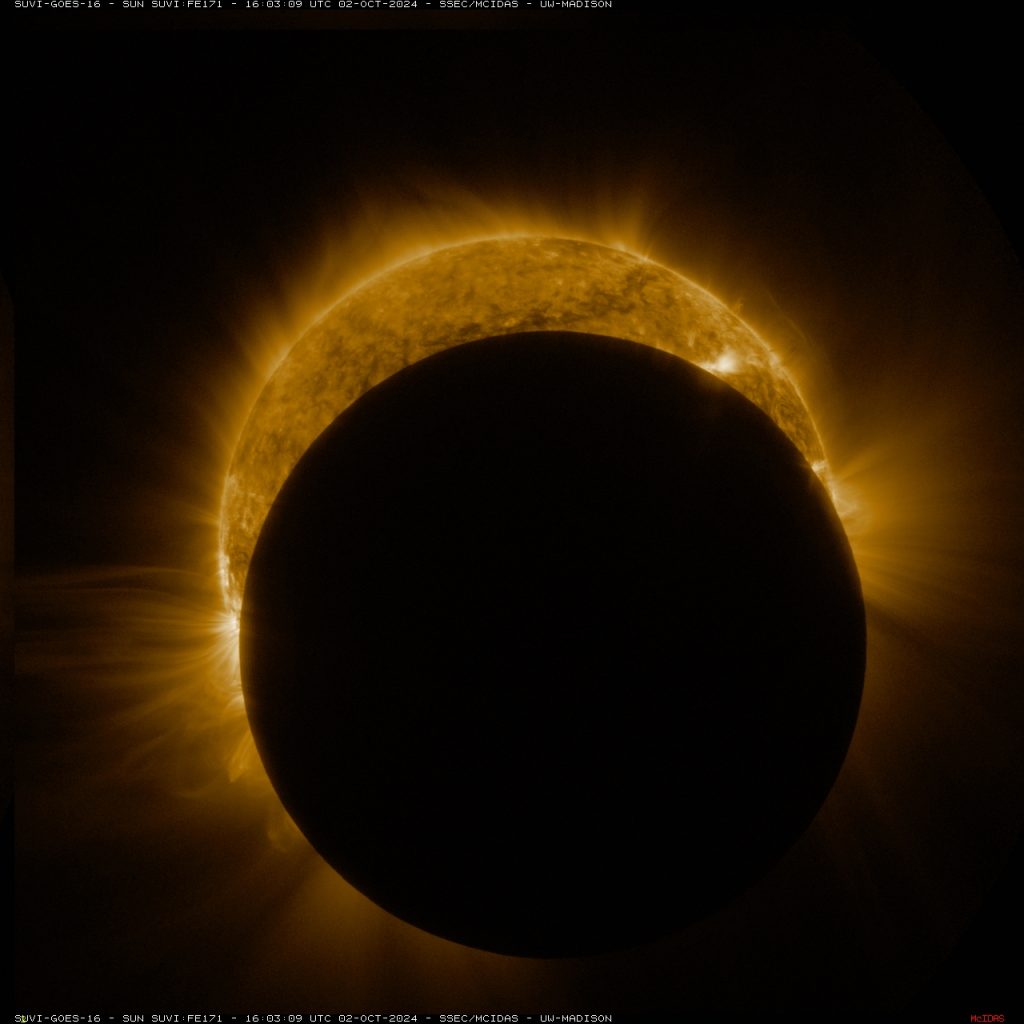
The SUVI also saw the Moon, as it passed in front of the Sun.
One of the spectral bands on the GOES-16 SUVI. GOES-16 SUVI Loop from October 2, 2024.
A 6-panel SUVI image from near 16 UTC.
GOES-16 SUVI 6-panel from October 2, 2024, while the Sun is being eclipsed by the Moon.
More SUVI imagery are available from the SWPC and the UW/SSEC (including RGBs and daily 6-panels).
H/T
These GOES-19 ABI are early images (preliminary and non-operational), beta stage. Both McIDAS-X and geo2grid software was used in generating these images, using data via the UW/SSEC Data Services. More about GOES-16 and GOES-18. T. Schmit works for NOAA/NESDIS/STAR, from Madison, Wisconsin.
As first hinted at in this blog post, the Community Satellite Processing Package for Geostationary Data (CSPP-Geo) (https://cimss.ssec.wisc.edu/csppgeo/ ) group at CIMSS has released a beta version of a unix-based package that computes LightningCast probabilities. LightningCast (available online in real time for select regions) diagnoses the probability of a Geostationary Lightning Mapper (GLM) observation of lightning within... Read More
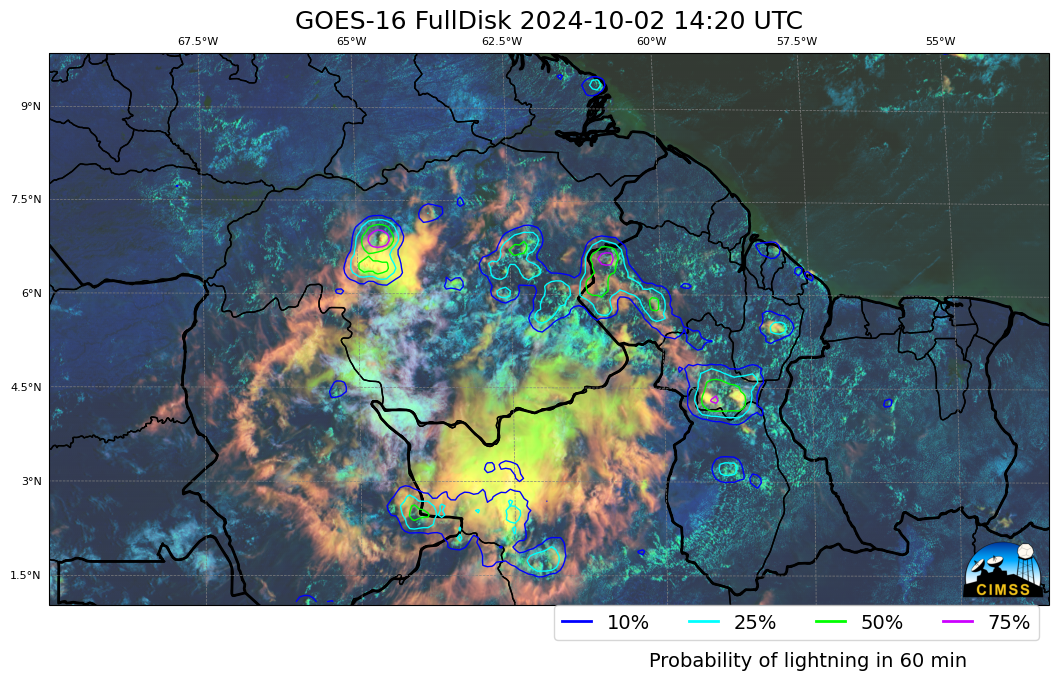
LightningCast Probability over northern South America, plotted over Day Cloud Phase Distinction imagery, 1420 UTC on 2 October 2024 (Click to enlarge)
As first hinted at in this blog post, the Community Satellite Processing Package for Geostationary Data (CSPP-Geo) (https://cimss.ssec.wisc.edu/csppgeo/ ) group at CIMSS has released a beta version of a unix-based package that computes LightningCast probabilities. LightningCast (available online in real time for select regions) diagnoses the probability of a Geostationary Lightning Mapper (GLM) observation of lightning within the next hour, given a suite of ABI Channels (Bands 2, 5, 13, 15, that is: 0.64 µm, 1.61 µm, 10.3 µm, 12.3 µm) or AHI Channels (Bands 3, 5, 13, 15; 0.64 µm, 1.61 µm, 10.4 µm, 12.3 µm). Output is in the form of GeoJSON files, GR Placefiles, netCDF files (including AWIPS-compatible netCDFs), and imagery with lightning probability contours overlain on top (as shown above). The software will also plot GLM Flash Extent Density fields if you have access to the gridded GLM fields (and CSPP Geo has a package that will create those if you don’t). The package works on GOES-R CONUS/PACUS domains, or mesoscale domains, or within subsected regions of the Full Disk (provided the subsected region is smaller than about twice the size of the CONUS/PACUS domain). The generated contours can also be parallax-corrected.
Access to the software does require a free log-in that supplies your email to the CSPP Geo team. This email is used for follow-on support for things like updates and patches that might occur. Download the package (from here) to a clean directory on your machine, un-tar it, and you’re ready to go.
The following (simple!) command, run in the directory created when the downloaded software package is un-tarred, created the image shown up top. Refer to the users’ manual for a complete set of commands. Note that the domain created — from 53oW to 70oW and 1oN to 10oN — is not available at the RealEarth instance.
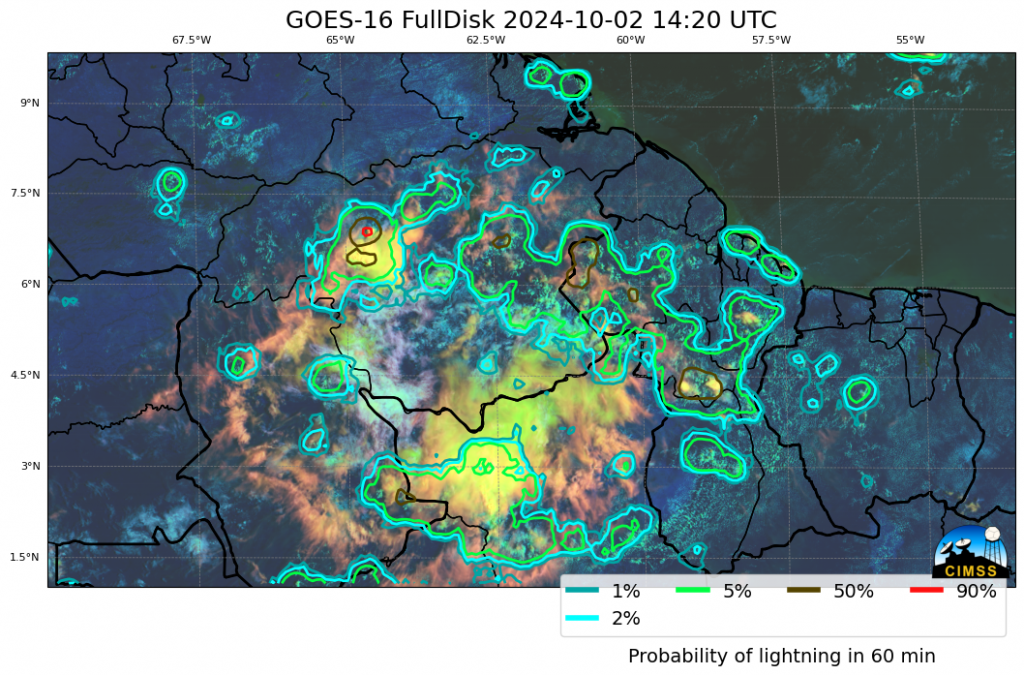
The software allows you (if you wish) to change the contour values from the defaults of 10/25/50/75. That is shown in the invocation that created the imagery beneath the code.
LightningCast Probability over northern South America, 1420 UTC on 2 October 2024, plotted over Day Cloud Phase Distinction imagery, with specific probabilities contoured (Click to enlarge)
CSPP Geosphere imagery subsequent to the LightningCast Probabilities shown above is below. Where do you think lightning has occurred?
GOES-16 True Color imagery, 1420 – 1610 UTC on 2 October 2024
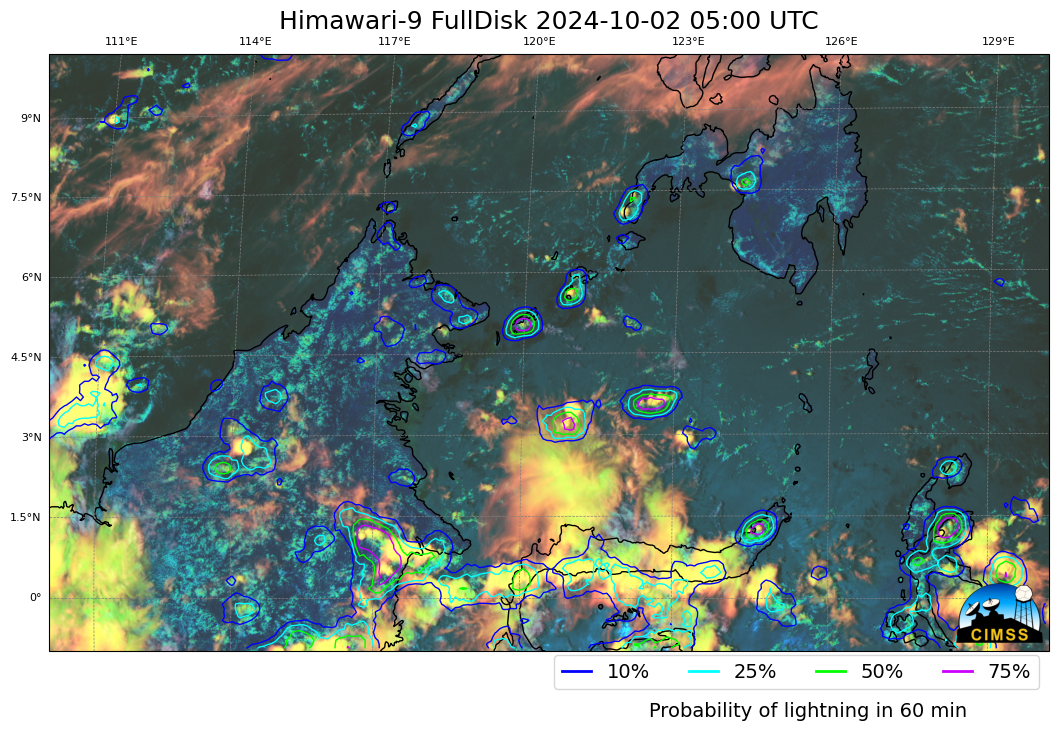
As noted above, the software package creates LightningCast probabilities with Himawari data as well, as along as you have access to Himawari HSD data. The following command created the imagery at the bottom. Note in all the invocations in the blog post that the file name specified resolves to one unique file. The software package will be able to resolve the other data needed from this one file name.
Default LightningCast probabilities over/near Borneo at 0500 UTC on 2 October 2024, plotted over Day Cloud Phase Distinction imagery (Click to enlarge)
LightningCast software released is a beta version of the code. If you encounter unexpected behavior, please report it!
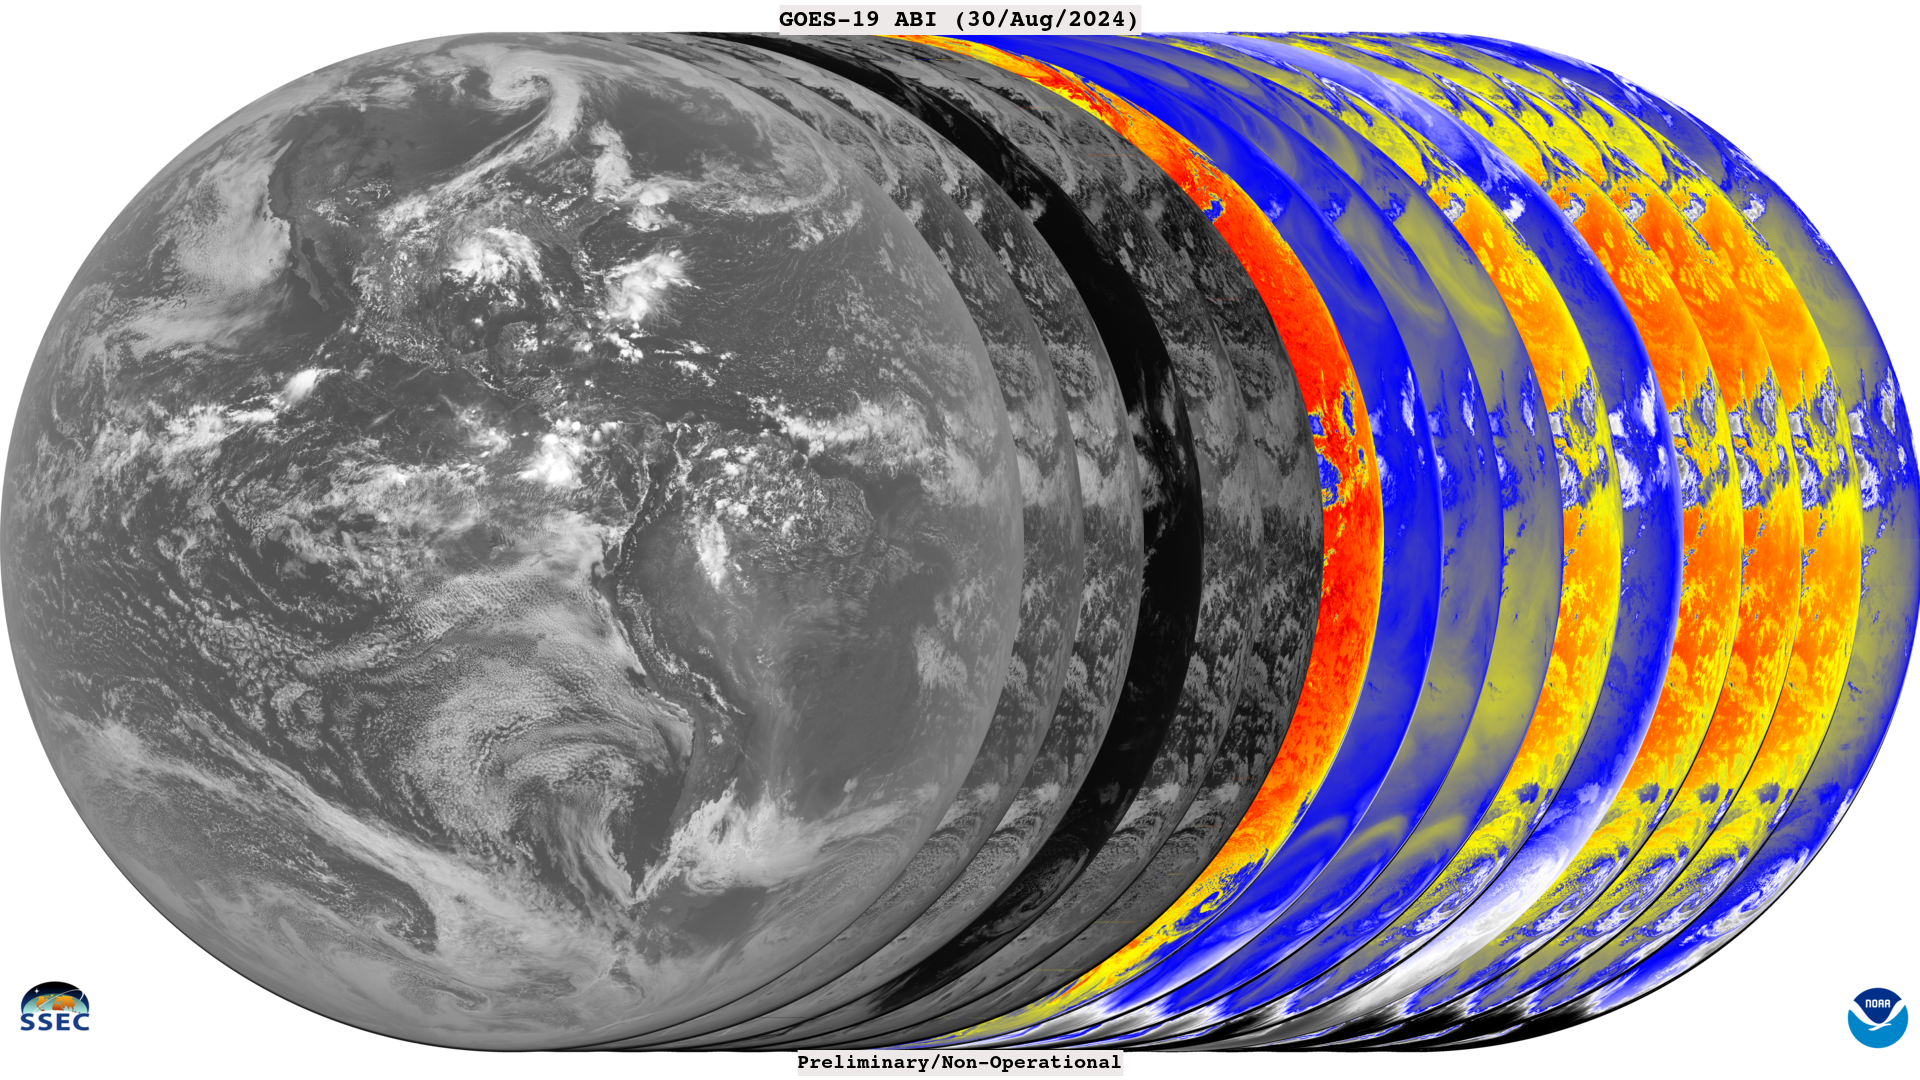
A true color composite full disk image, along with all 16 spectral bands and several other RGBs of the preliminary, non-operational GOES-19 ABI on August 30, 2024.
The above loop as an mp4. The ABI has 16 spectral bands, 2 in the visible, 4 in the near-infrared (or “near-visible”) and 10 in the infrared part of the electromagnetic spectrum. There are also ABI band “fact sheets” in Spanish and French. Also included in the animation are several band combinations shown as RGBs. A similar loop as above, but only showing the ABI channels.
Another Full Disk view of the 16 spectral bands on August 30, 2024 of the ABI, as an mp4.
The 16 spectral bands of the GOES-19 (Preliminary / Non-operational) ABI on August 30, 2024 at 18 UTC.
The “low-level” water vapor band (10) is very important. A loop showing a low over northern North America. The loop is from 18 UTC on August 30, 2024 to 01:50 UTC on August 31, 2024. (The loop at a slower speed.)
GOES-19 ABI “water vapor” band 10 (7.3 micrometers) loop from August 30, 2024 to August 31, 2024. (click to play)
Fog in the river valleys in Pennsylvania and New York can be seen in the ABI “red” visible band (2).
Fog on September 3, 2024 from GOES-19 ABI (Preliminary / Non-operational). (click to play)
A GOES-19 Band 3 loop from August 30, 2024. (Click to Play.)
Northern South America on September 4, 2024 showing the CIMSS true color RGB.
True color imagery showihttps://cimss.ssec.wisc.edu/satellite-blog/images/2024/09/nSA_GOES-19_RadF_cimss_true_color_2024248_083019_2024248_171020.mp4ng the suspended sediment of the South American coast on May 5, 2022. (click to play)
A full disk loop over 24 hours.
A full disk GOES-19 loop over a day (true color) on August 30/31, 2024.
Pacific NorthWest and Smoke and Fog.
A GOES-19 CIMSS true color composite loop from September 4, 2024. (Click to Play.)
ABI 16-Panel
The 16 spectral bands of the (Preliminary/Non-operational) GOES-19 ABI from September 27 to October 1, 2024.
The ABI has 16 spectral bands, 2 in the visible, 4 in the near-infrared (or “near-visible”) and 10 in the infrared part of the electromagnetic spectrum. GOES-19 image covering the contiguous United States collected by the Advanced Baseline Imager (ABI) in 16 spectral bands on September 30, 2024. This 16-panel image shows the two visible, four near-infrared and 10 infrared channels on the ABI. The visible near-IR bands are gray-colored, while the infrared bands have the warmer brightness temperatures mapped to warmer colors. The different appearance of each band is due to how each band reflects or absorbs radiation.
The ABI scans two smaller meso-scale regions every 60 seconds, which provides 30-sec imagery if the regions overlap. These channels help forecasters and others distinguish phenomena such as clouds, water vapor, fires, smoke, dust, ice, land/sea surface temperatures and volcanic ash. The loop below shows fog/low clouds and smoke in southern California.
A visible GOES-19 (Preliminary / Non-operational) animation on September 13, 2024. Images 30 seconds. (Click to play)
Also meso-scale sector of Hurricane Francine near the Gulf of Mexico. Note the imagery is every 30-seconds.
A visible GOES-19 (Preliminary / Non-operational) animation on September 11, 2024. Images 30 seconds. (Click to play)30-sec imagery of the Elk fire in northern WY on October 1, 2024. (Click to Play.)
H/T
Thanks to the many (thousands) who made the GOES-19 ABI possible, including the instrument and spacecraft vendors. These GOES-19 ABI are early images (preliminary and non-operational, calibration improvements are possible. Both McIDAS-X and geo2grid software was used in generating these images, using data via the UW/SSEC Data Services. More about GOES-16 and GOES-18. T. Schmit works for NOAA/NESDIS/STAR, from Madison, Wisconsin.

