This website works best with a newer web browser such as Chrome, Firefox, Safari or Microsoft
Edge. Internet Explorer is not supported by this website.
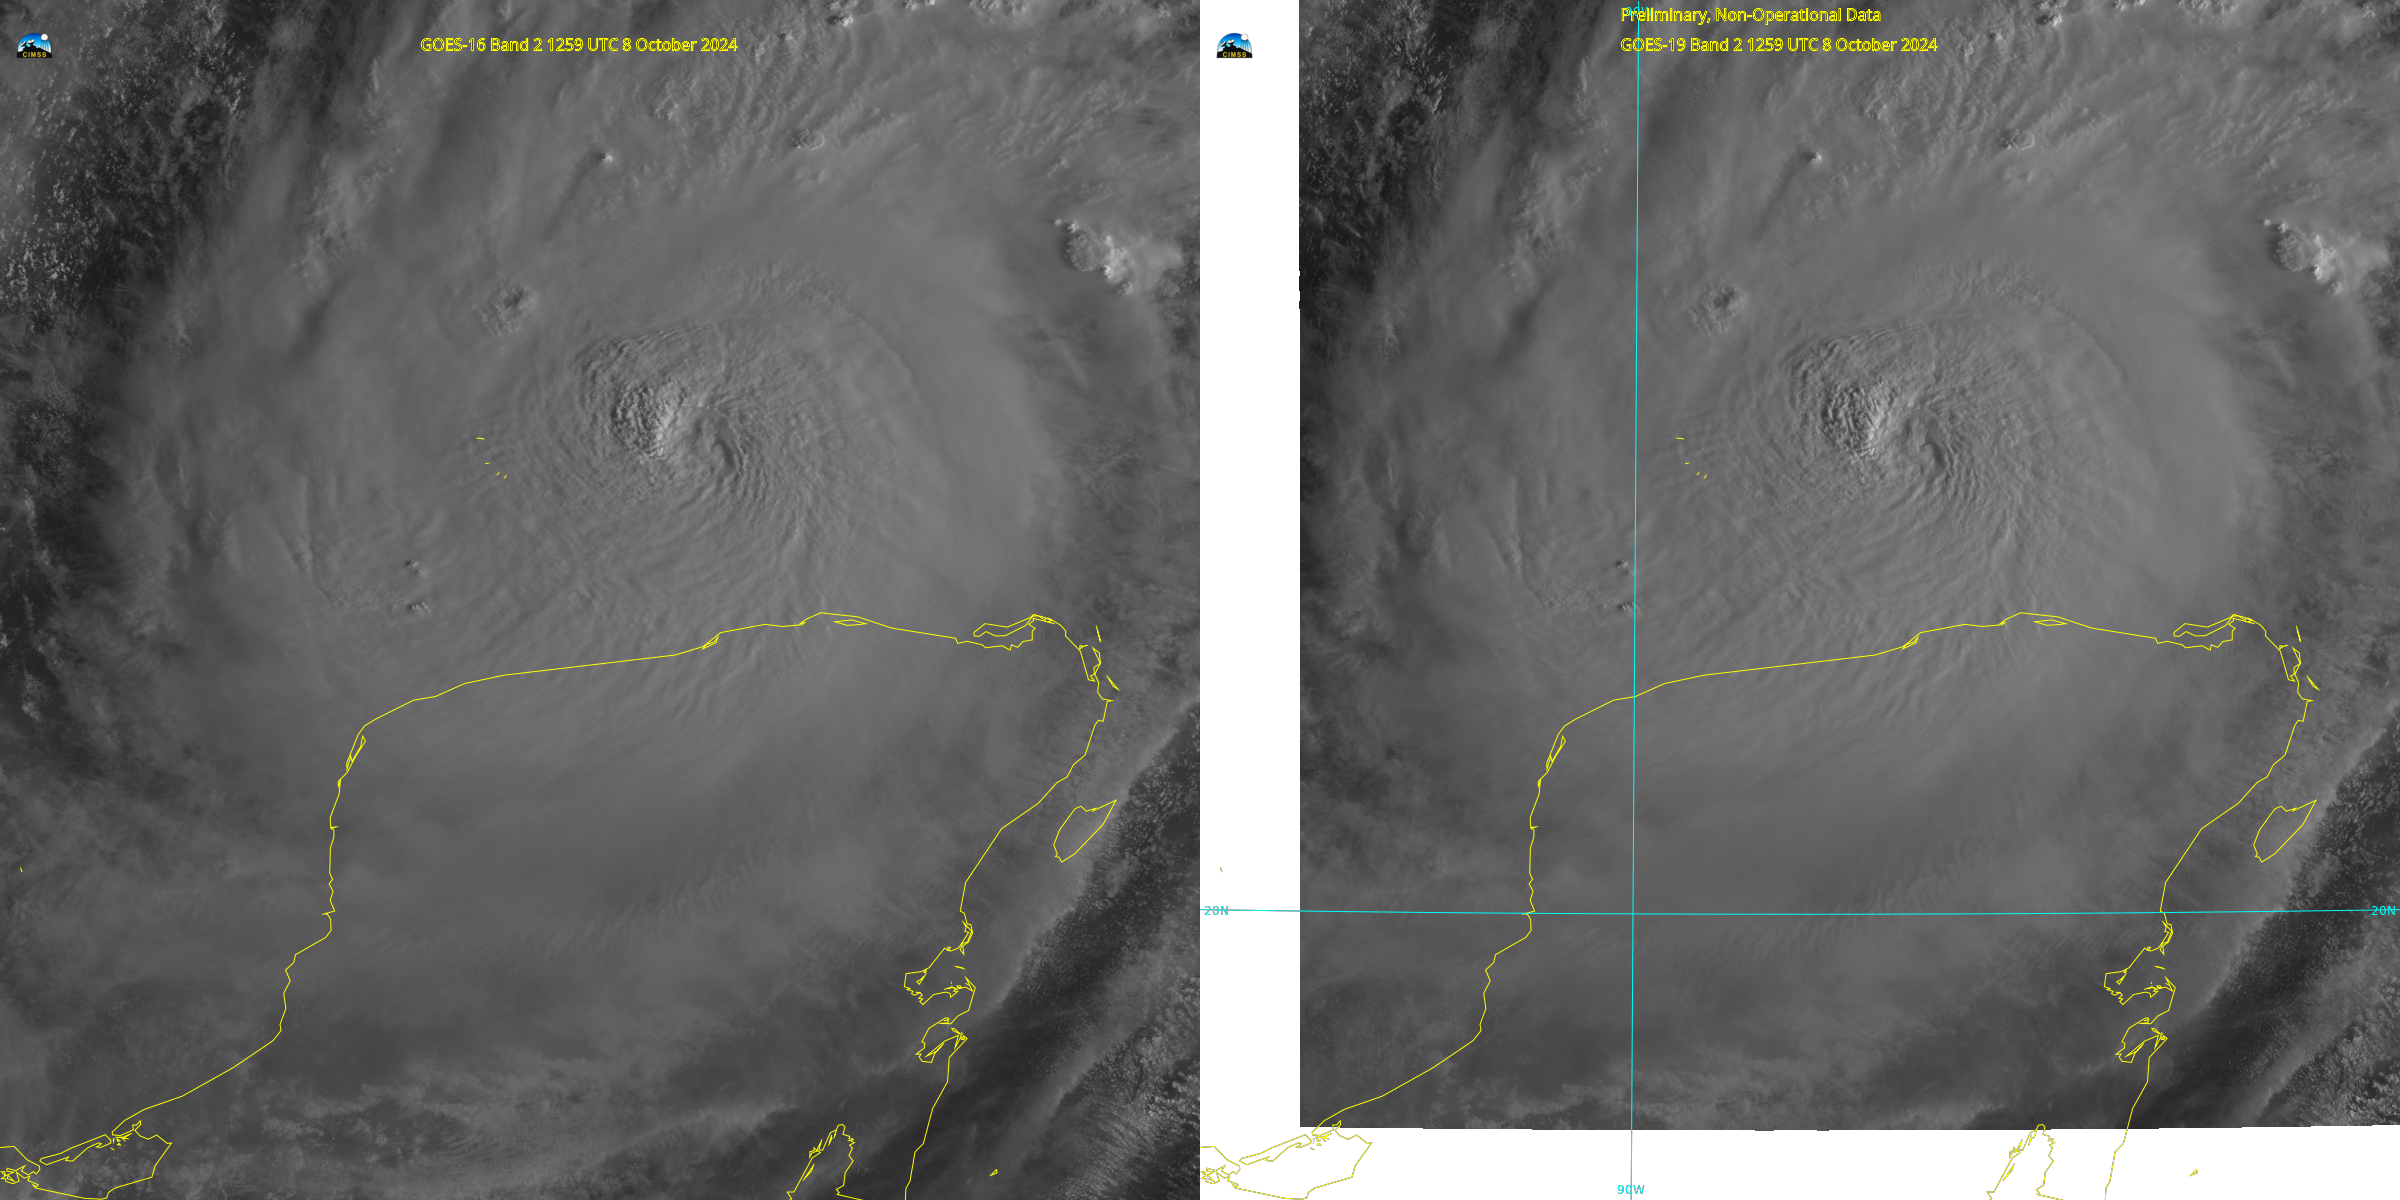
GOES-19 is at its post-launch check-out location over the Equator at 89.5oW and GOES-16, as GOES-East is over the Equator at 75.2oW. Mesoscale sectors from both satellites were positioned over the eye of Milton up until about 1330 UTC; subsequent to that time, GOES-19 calibration exercises meant that mesoscale scanning... Read More
GOES-16 (left) and GOES-19 (right) visible (Band 2, 0.64 µm) imagery, 1201 – 1328 UTC on 8 October 2024 (Click to enlarge)
GOES-19 is at its post-launch check-out location over the Equator at 89.5oW and GOES-16, as GOES-East is over the Equator at 75.2oW. Mesoscale sectors from both satellites were positioned over the eye of Milton up until about 1330 UTC; subsequent to that time, GOES-19 calibration exercises meant that mesoscale scanning could not happen. The side-by-side images, above, can be viewed so that a three-dimensional image appears. To do that, cross your eyes and focus on the image that appears in between the two images.
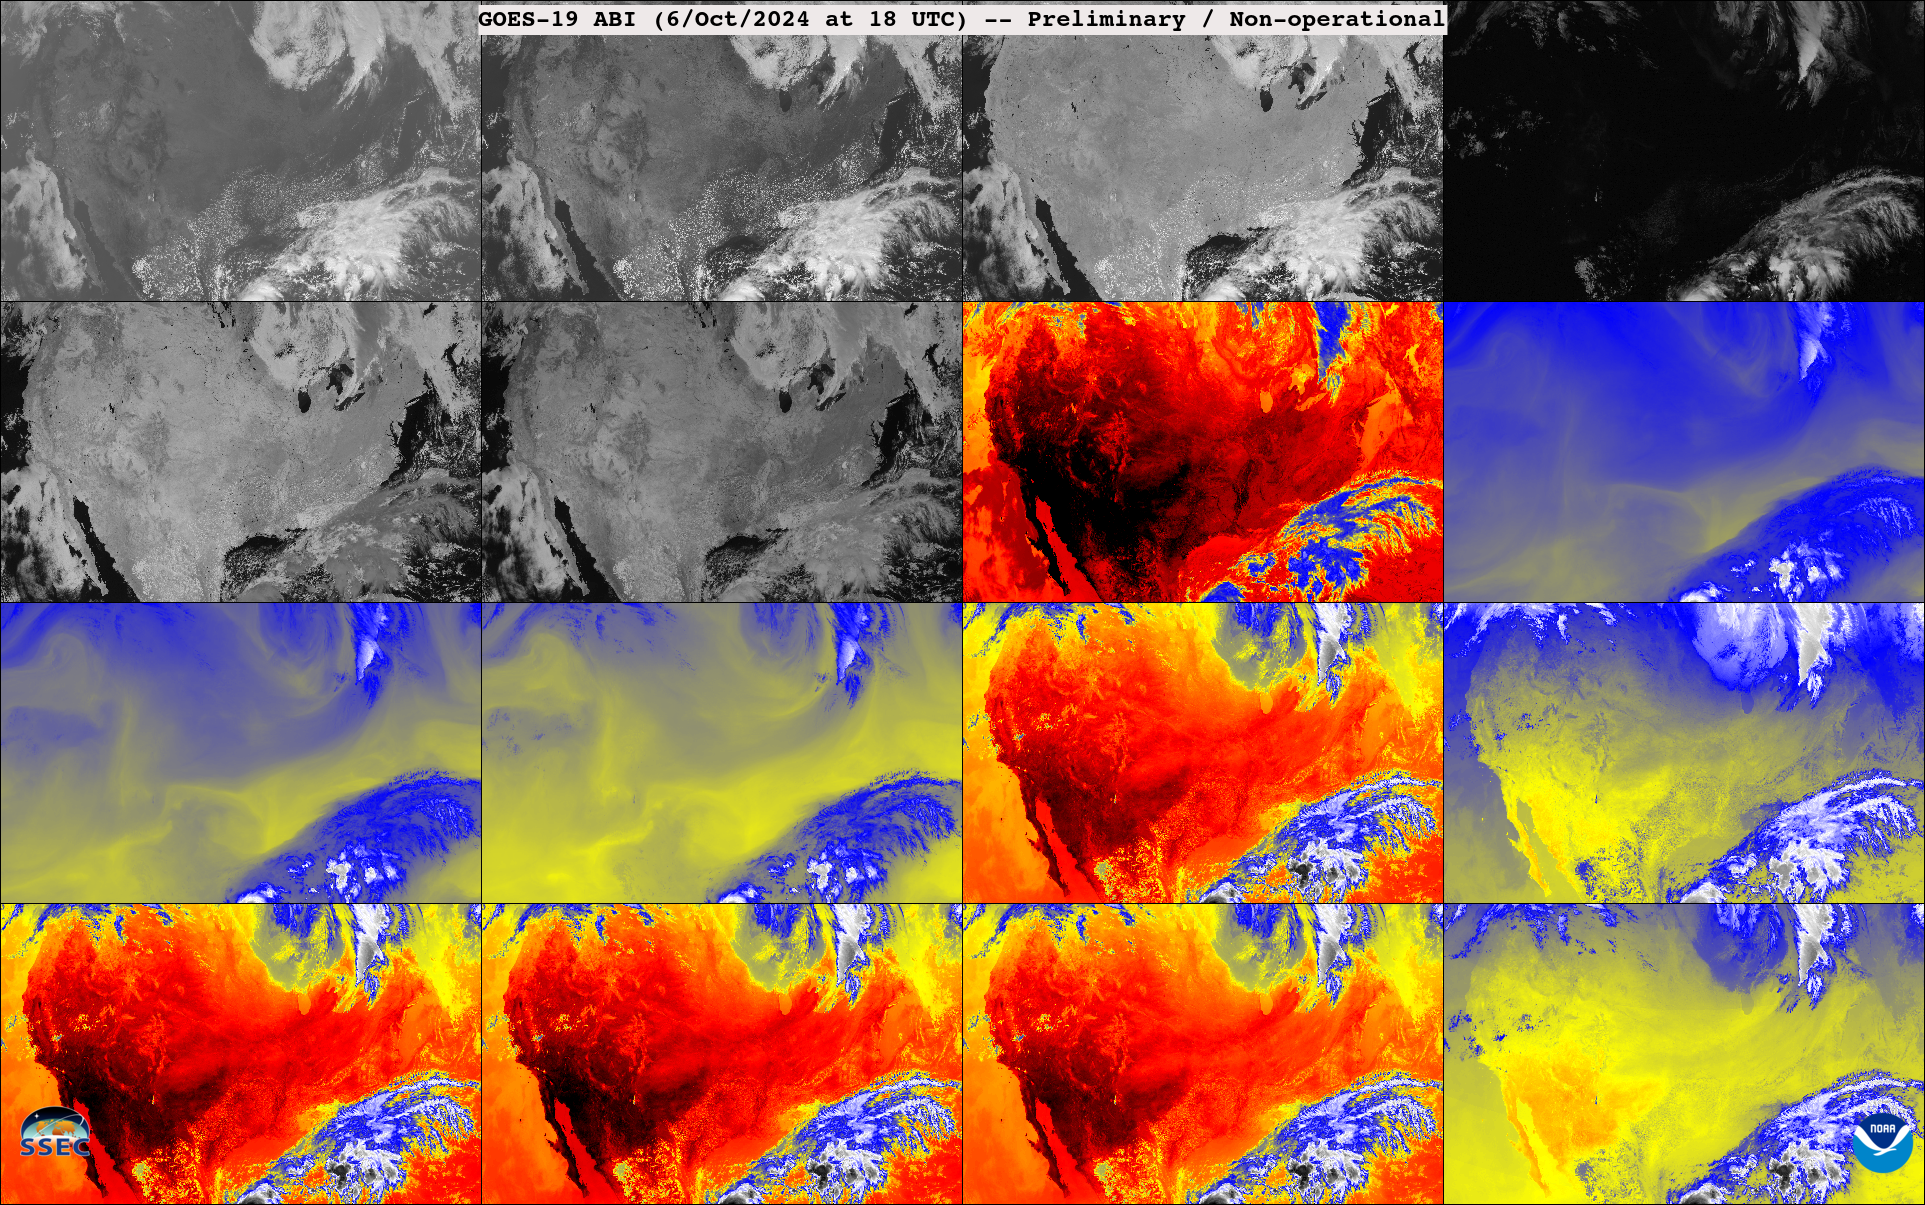
Remapped GOES-16, -18 and -19 ABI data from 18 UTC on October 6, 2024 at 18 UTC.
While it is still early in the post-launch test period, good qualitative agreement has been shown to other GOES imagers. Of course, due to parallax and other reasons, there are expected to be differences, especially at larger view angles. The above loop as a mp4. Or versions that toggle between GOES-19 and GOES-16 only (mp4)
More 16-panel imagery (from GOES-16, GOES-18 and GOES-19), including time difference images (which can be very useful in assessing image quality). More GOES-19 data can be found on UW/SSEC’s geo-browser and CIRA’s Slider.
GOES-19 and GOES-16 images for each spectral band over Florida at 18 UTC on October 6, 2024. (Click to Play.)GOES-19 and GOES-16 images for each spectral band over Pennsylvania at 18 UTC on October 6, 2024. (Click to Play.)GOES-19 and GOES-16 images for each spectral band over Wisconsin at 18 UTC on October 6, 2024. (Click to Play.)
And comparisons between GOES-18 (West) and GOES-19 ABI.
GOES-18 and GOES-19 images for each spectral band over California at 18 UTC on October 6, 2024. (Click to Play.)GOES-18 and GOES-19 images for each spectral band over the inter-mountain west at 18 UTC on October 6, 2024. (Click to Play.)
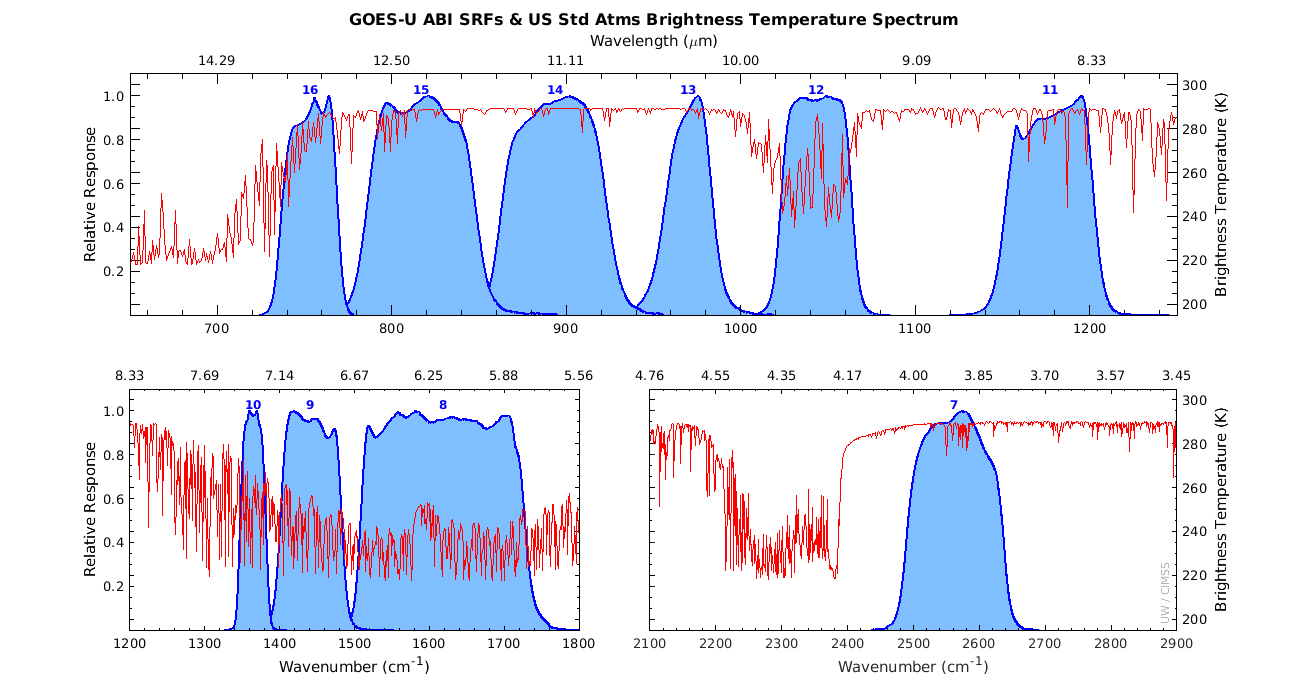
ABI Instrument Response Functions
GOES-U (19) ABI Spectral Response Functions for the 10 infrared bands.
The ABI has 16 spectral bands, 2 in the visible, 4 in the near-infrared (or “near-visible”) and 10 in the infrared part of the electromagnetic spectrum. The instrument response functions can be found both on CIMSS and Calibration Working Group sites.
A similar page showing ABI comparisons, but from GOES-18.
H/T
Thanks to the many (thousands) who made the GOES-19 ABI possible. These are GOES-19 ABI are early images (preliminary and non-operational, future calibration improvements are possible. geo2grid and McIDAS-X software was used in generating these images. More about GOES. T. Schmit works for NOAA/NESDIS/STAR.
There was another exceptional Auroral display over the upper Midwest during the early morning on 8 October 2024. Day Night Band imagery, above, from Suomi NPP (at 0800 UTC) and from — despite the label — NOAA-20 (at 0823 UTC), shows the big change in areal coverage of the northern... Read More
VIIRS Day Night Band visible (0.7 µm) imagery, ca. 0800 UTC (Suomi NPP) and ca. 0830 UTC (NOAA-20), 8 October 2024 (Click to enlarge)
There was another exceptional Auroral display over the upper Midwest during the early morning on 8 October 2024. Day Night Band imagery, above, from Suomi NPP (at 0800 UTC) and from — despite the label — NOAA-20 (at 0823 UTC), shows the big change in areal coverage of the northern lights in less than half an hour! An Aurora also occurred early on the 7th, as shown in the images here.
Visible imagery over Hurricane Milton after sunrise on 7 October, above, shows a compact system about 100 miles northwest of the Yucatan Peninsula. The predicted track of the storm center is superimposed on the imagery. Note that Milton’s sustained winds at 1500 UTC, 135 knots, represents an 80-knot increase over... Read More
GOES-16 Mesoscale Sector imagery (Band 2, visible, 0.64 µm) over Milton, 1322-1521 UTC, 7 October 2024 (Click to enlarge)
Visible imagery over Hurricane Milton after sunrise on 7 October, above, shows a compact system about 100 miles northwest of the Yucatan Peninsula. The predicted track of the storm center is superimposed on the imagery. Note that Milton’s sustained winds at 1500 UTC, 135 knots, represents an 80-knot increase over the previous 24 hours. Only 2 Atlantic Basin storms have strengthened more rapidly (source). Milton is forecast to move just south of due east, before turning northeastward towards Florida (where preparations for the storm should be completing). Milton on Monday morning is in a region of very warm water, and in an atmosphere with little shear, as shown below (analyses from this website). Much stronger shear is present over the northern Gulf, however.
Deep Layer Shear analysis (850-200mb), 1300 UTC, and SST values at 0600 UTC, 7 October 2024 (Click to enlarge)
The animation below shows upper-level water vapor infrared imagery (Band 8, 6.19) along with GLM observations of Flash Extent Density and GOES-16 Derived Motion Wind vectors. Lightning is observed within the eye of Milton, a hallmark of rapidly-developing tropical cyclones. In addition, the very strong shear over the northern Gulf is apparent: east-northeast winds at low levels with very strong west-southwest winds aloft. The satellite-derived winds also show the characteristic anticyclone over the hurricane. Note, however, that the Day Night Band imagery over Milton (from NOAA-21, at 0802 UTC, downloaded from this site) shows no evidence of lightning near the eye at that time.
GOES-16 Upper Level water vapor infrared (Band 8, 6.19 µm) imagery, 1251-1511 UTC, 7 October 2024 (Click to enlarge)
Dry air can weaken hurricanes. Is there any evidence of dry air in the vicinity of Milton? The Band 8 imagery above shows dry air over the northern Gulf, far from Milton. MIMIC Total Precipitable water fields, below (source), for the 24 hours ending a 1400 UTC show abundant moisture surrounding the storm. Also apparent in that animation: the front moving south into the Deep South. The circulation with this system will have a bearing on the future path and strength of Milton.
MIMIC TPW fields, 1500 UTC 6 October – 1400 UTC on 7 October 2024 (Click to enlarge)
Interest on Florida, on both west coasts from north of Tampa to the Keys, and on the east coast from Jacksonville to north of Miami, should closely monitor the progress of this storm. For the latest information refer to the National Hurricane Center, and the NWS Forecast offices in Tampa, Jacksonville, Melbourne, Miami and Key West.
Preliminary/Non-Operational GOES-19 CIMSS Natural Color 30-second mesoscale animation of Hurricane Milton on October 7, 2024
GOES-19 is undergoing post-launch testing and is considered to be preliminary/non-operational by NOAA. Satellite operators were able to capture several hours of 30-second mesoscale imagery of Hurricane Milton on October 7, 2024. There are some missing times in the animation because of missing data and some poorly navigated images, which is not unexpected during post-launch testing.


