This website works best with a newer web browser such as Chrome, Firefox, Safari or Microsoft
Edge. Internet Explorer is not supported by this website.
Data from the Flexible Combined Imager (FCI) on board MTG-I1 (Meteosat Third Generation), operating in parallel with Meteosat-10, with a sub-satellite point at 0oN, 0oE, shows the different cloud types associated with Kirk (which was deemed a hurricane at 2100 UTC on 1 October) in the tropical Atlantic. The Cloud Phase RGB (details), among other... Read More
Cloud Phase RGB imagery from FCI data, 1000 – 1700 UTC on 1 October 2024
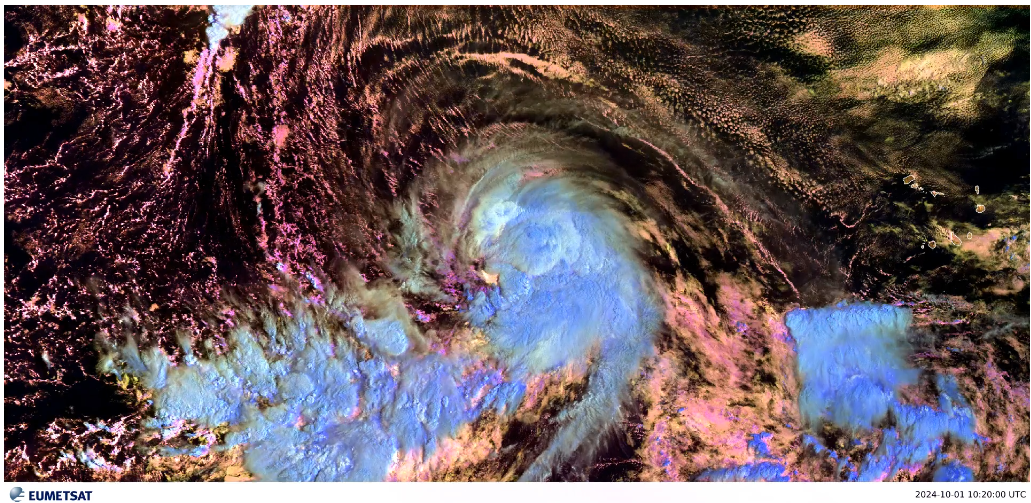
Data from the Flexible Combined Imager (FCI) on board MTG-I1 (Meteosat Third Generation), operating in parallel with Meteosat-10, with a sub-satellite point at 0oN, 0oE, shows the different cloud types associated with Kirk (which was deemed a hurricane at 2100 UTC on 1 October) in the tropical Atlantic. The Cloud Phase RGB (details), among other things, helps distinguish between ice/water clouds, and clouds with large/small particles. In the example above, blue clouds have large particle sizes (likely ice in this case) and cyan clouds have smaller ice particle sizes. The pink-hued clouds over the southeastern quadrant of the scene above are likely clouds with large water droplets. A zoomed-in view of that quadrant is shown below.
Cloud Phase RGB imagery from FCI data, 1000 – 1700 UTC on 1 October 2024
Many thanks to Jochen Kerkman, EUMETSAT, for forwarding along these animations. So beautiful!!
CSPP Geosphere imagery, above, centered on LaCrosse, WI (the bluish thermal signal of the Mississippi River is also apparent) shows the development of brighter purple pixels starting at 0636 UTC. That change is perhaps easier to view in the slow stepped animation below. The changes in the RGB shows the... Read More
GOES-16 Night Microsphysics RGB over Lacrosse, WI, 0601 – 0826 UTC on 1 October 2024
CSPP Geosphere imagery, above, centered on LaCrosse, WI (the bluish thermal signal of the Mississippi River is also apparent) shows the development of brighter purple pixels starting at 0636 UTC. That change is perhaps easier to view in the slow stepped animation below. The changes in the RGB shows the initiation of a fire at a facility that recycles railroad ties (news link) in La Crosse. The initial small fire was in a shed before spreading to an adjacent mass of railroad ties.
Night Microphysics RGB, 0626, 0631, 0636, 0641 UTC on 1 October 2024 (Click to enlarge)
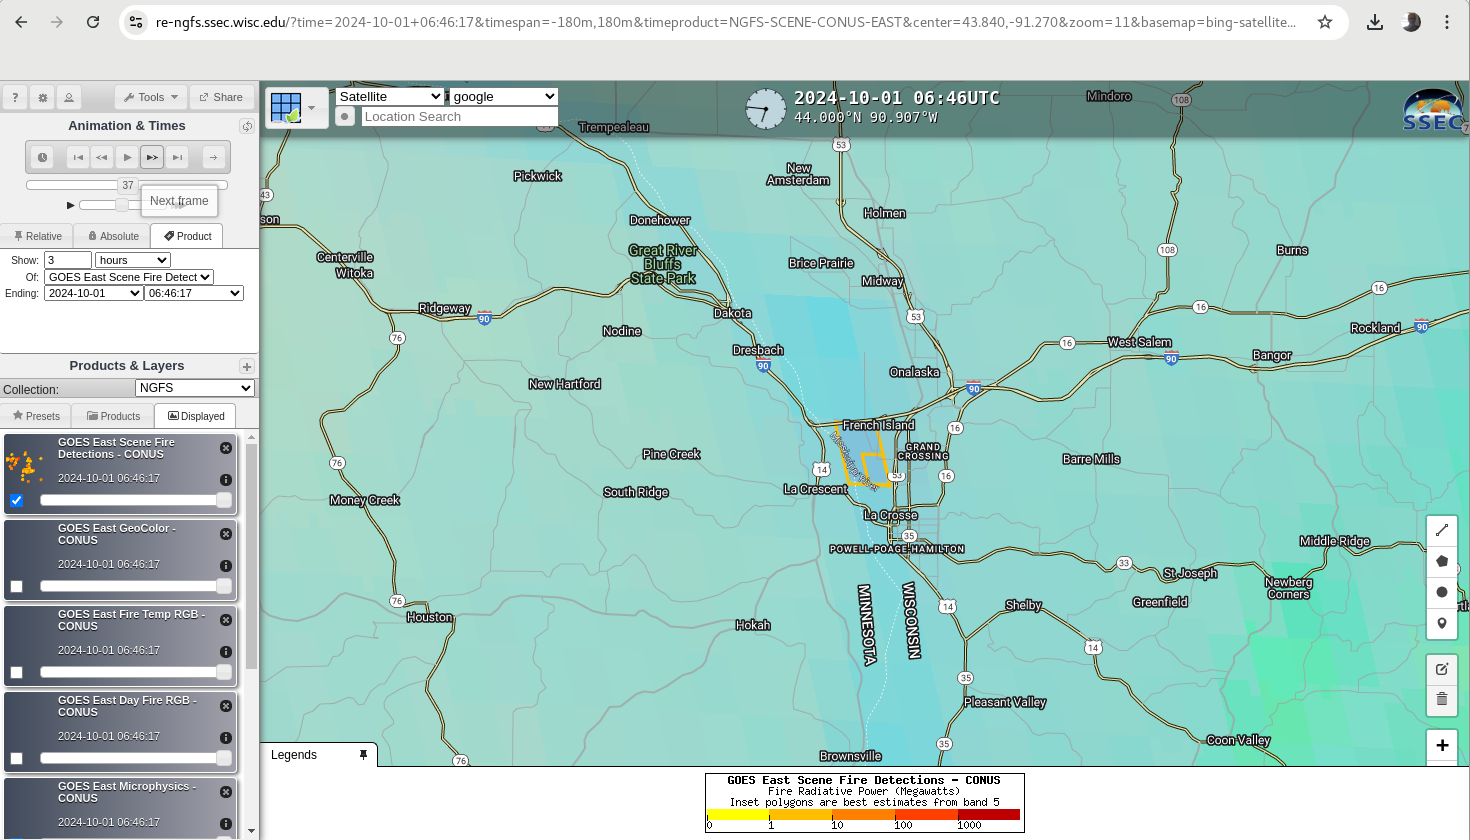
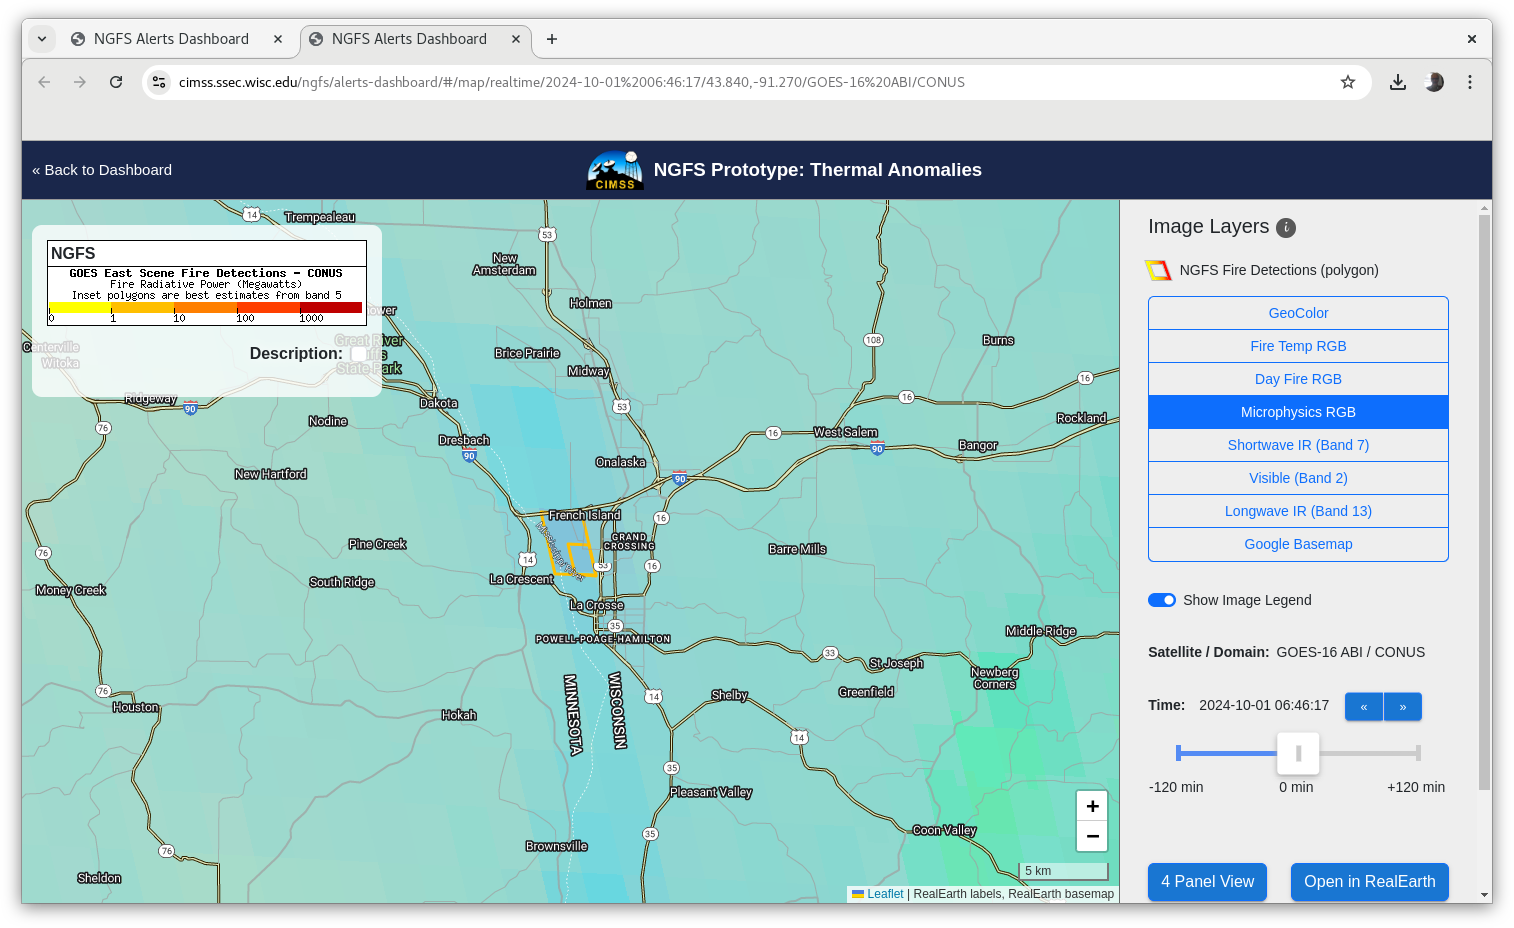
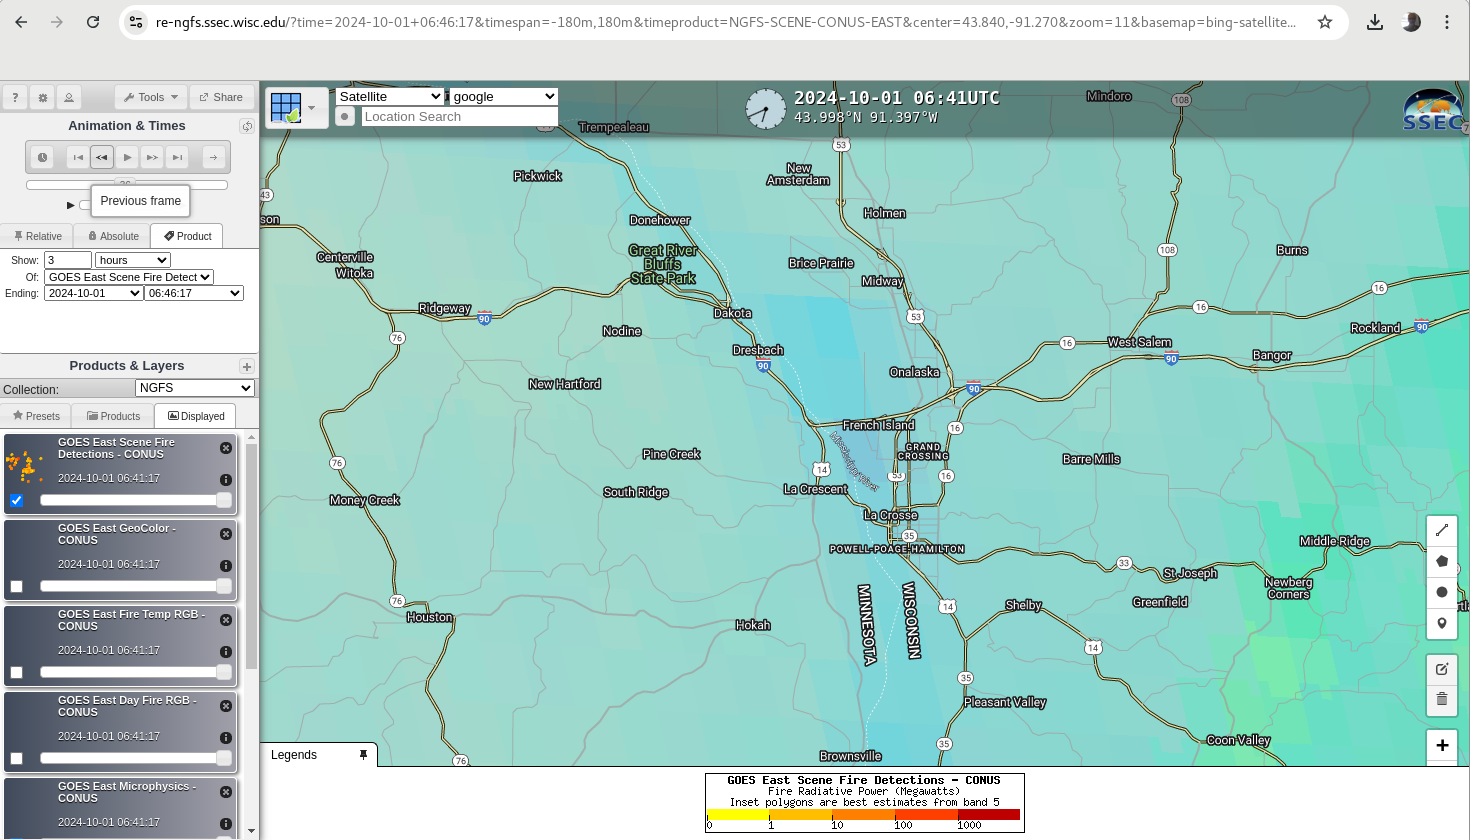
How did the Next Generation Fire System do with this event? That is shown below. The first detection — at 0646 UTC — appeared shortly before 0650 UTC. Once that alert has occurred, you can click on the triangle to have access to the created imagery, showing the first NGFS detection, and from there you can open a RealEarth instance (here, for this example) that includes all imagery.
NGFS Alerts Dashboard (including only those alerts for WFO ARX), details on the specific alert, created imagery, and Real Earth instance including all created imagery (Click to enlarge)
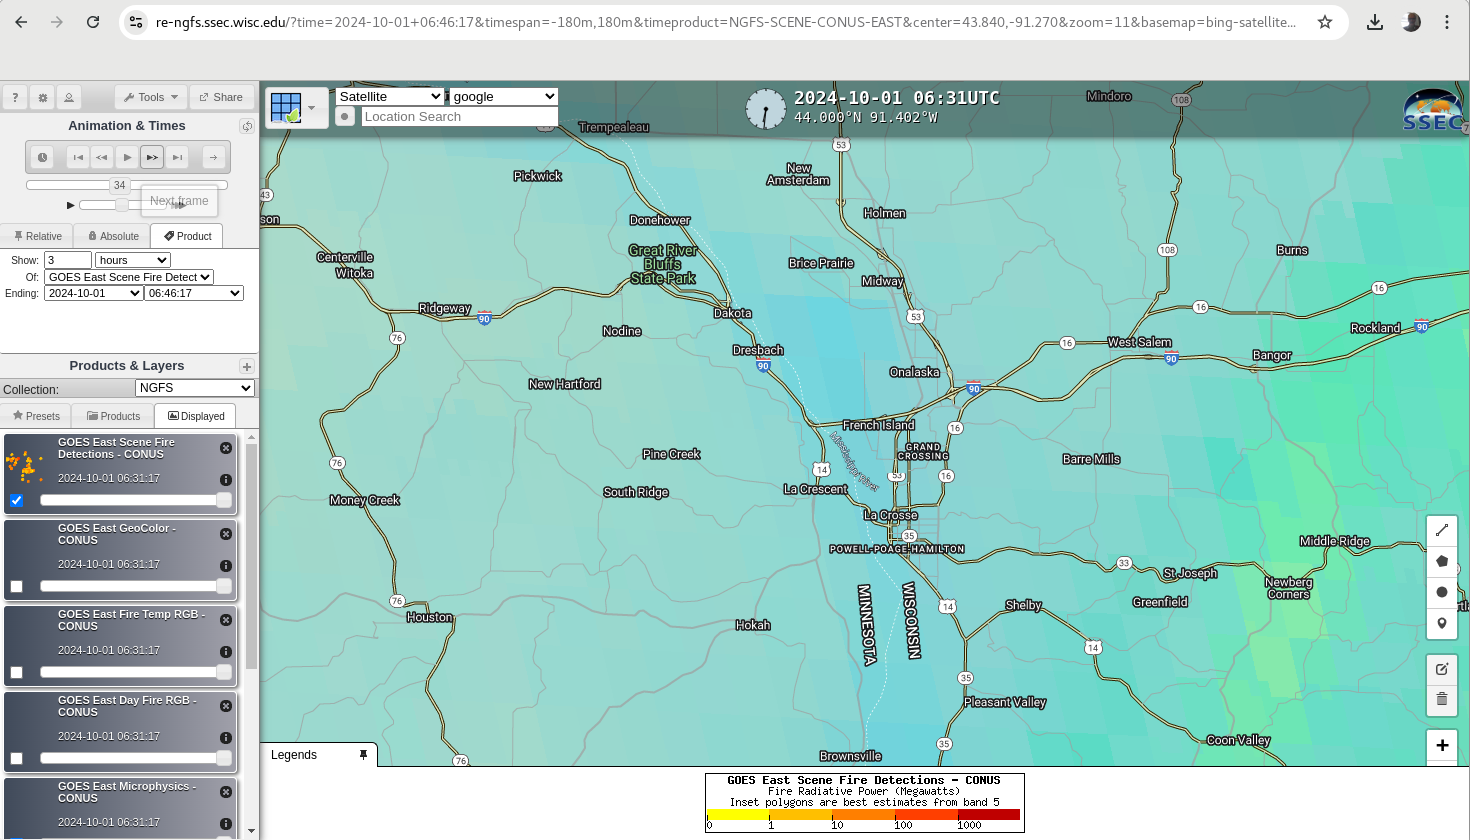
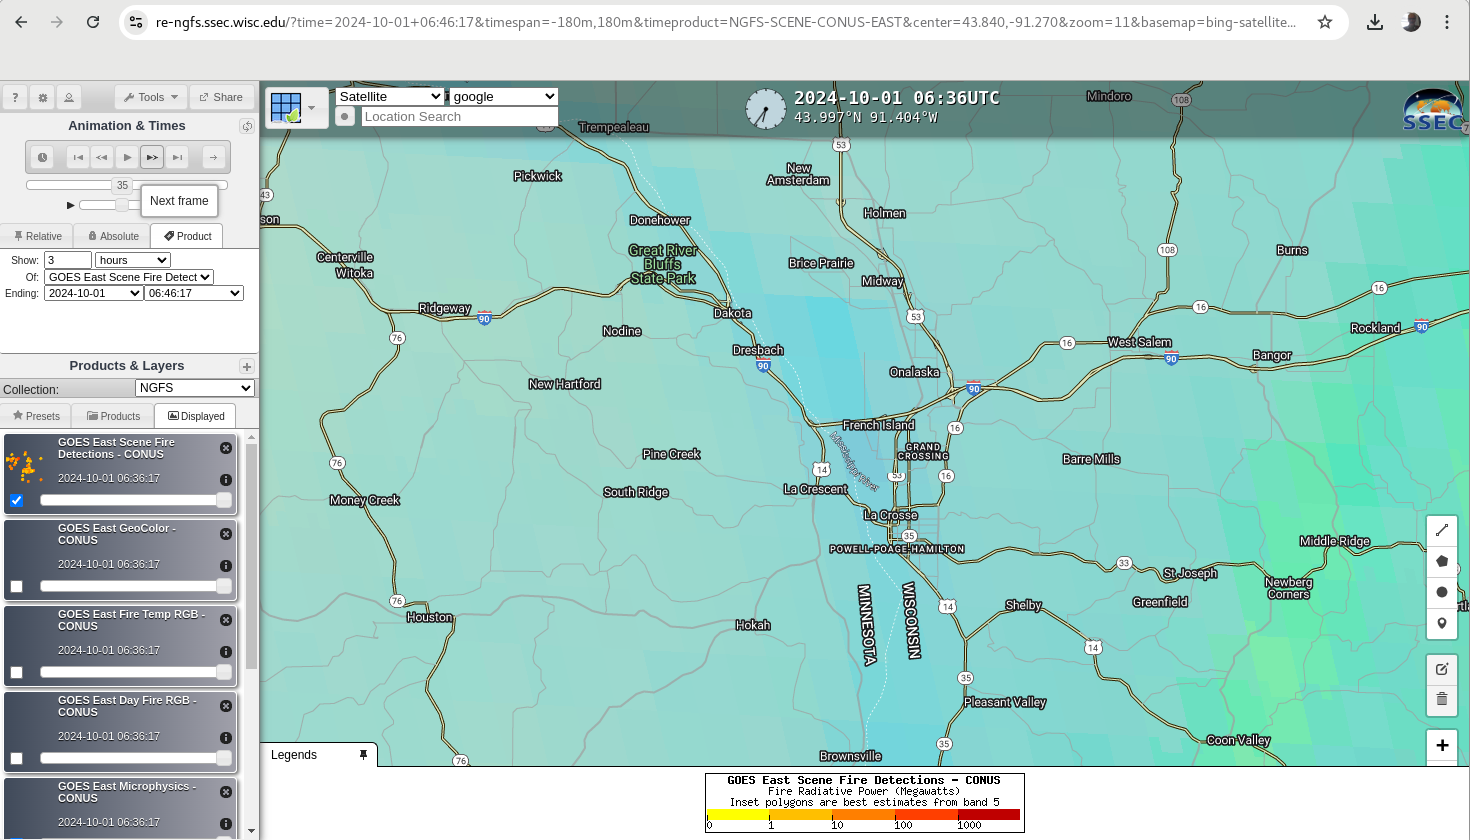
NGFS microphysics imagery, below, shows very subtle color changes between 0631 and 0636 and 0641 UTC before the NGFS identification of a fire pixel at 0646 UTC.
NGFS microphysics centered on La Crosse, WI, 0626, 0631, 0636, 0641 and 0646 UTC on 1 October 2024 (Click to enlarge)
The Night Microphysics animation at the top of this blog post includes the signal of a cloud band, and the signal of the fire is lost in that animation as the cloud band moves over La Crosse. A particular strength of NGFS fire detections is their persistence in the presence of clouds, as shown in the animation below from 0741 to 0806 UTC. The cloud signal is apparent in the NGFS microphysics, and the fire detection persists through the cloud band’s passage.
NGFS Microphysics and NGFS Fire Detections, 0741 – 0806 UTC on 1 October 2024 (Click to enlarge)
Hurricane John was an intense cyclone that affected the Pacific coast of Mexico for a about a week in late September 2024. (Click here to see an approximate path). The storm was noteworthy in that it made landfall, dissipated, re-developed, and then made landfall again. The animation above shows the... Read More
GOES-18 Band 13 Infrared (10.3 µm) imagery, 0000 UTC 21 September 2024 – 0300 UTC 28 September 2024
Hurricane John was an intense cyclone that affected the Pacific coast of Mexico for a about a week in late September 2024. (Click here to see an approximate path). The storm was noteworthy in that it made landfall, dissipated, re-developed, and then made landfall again. The animation above shows the lifecycle of the system, starting as a tropical wave south of Mexico and ending with a slow approach to the coast on the 26th and 27th. John weakened as it moved along the coast, before dissipating late on the 27th.
Hurricane John made landfall just after 0300 UTC UTC on 24 September. At 0200 UTC, shown below, a well-developed eye is apparent in satellite imagery, and strong convection is wrapped around that eye. The structure of the hurricane was quickly disrupted once inland, and by 1800 UTC on the 24th, the National Hurricane Center ceased advisories on the system, with the caveat that the system could still generate heavy rain, and might redevelop.
GOES-18 Clean Window infrared (Band 13, 10.3 µm) at 0200 UTC 24 September 2024 (Click to enlarge)
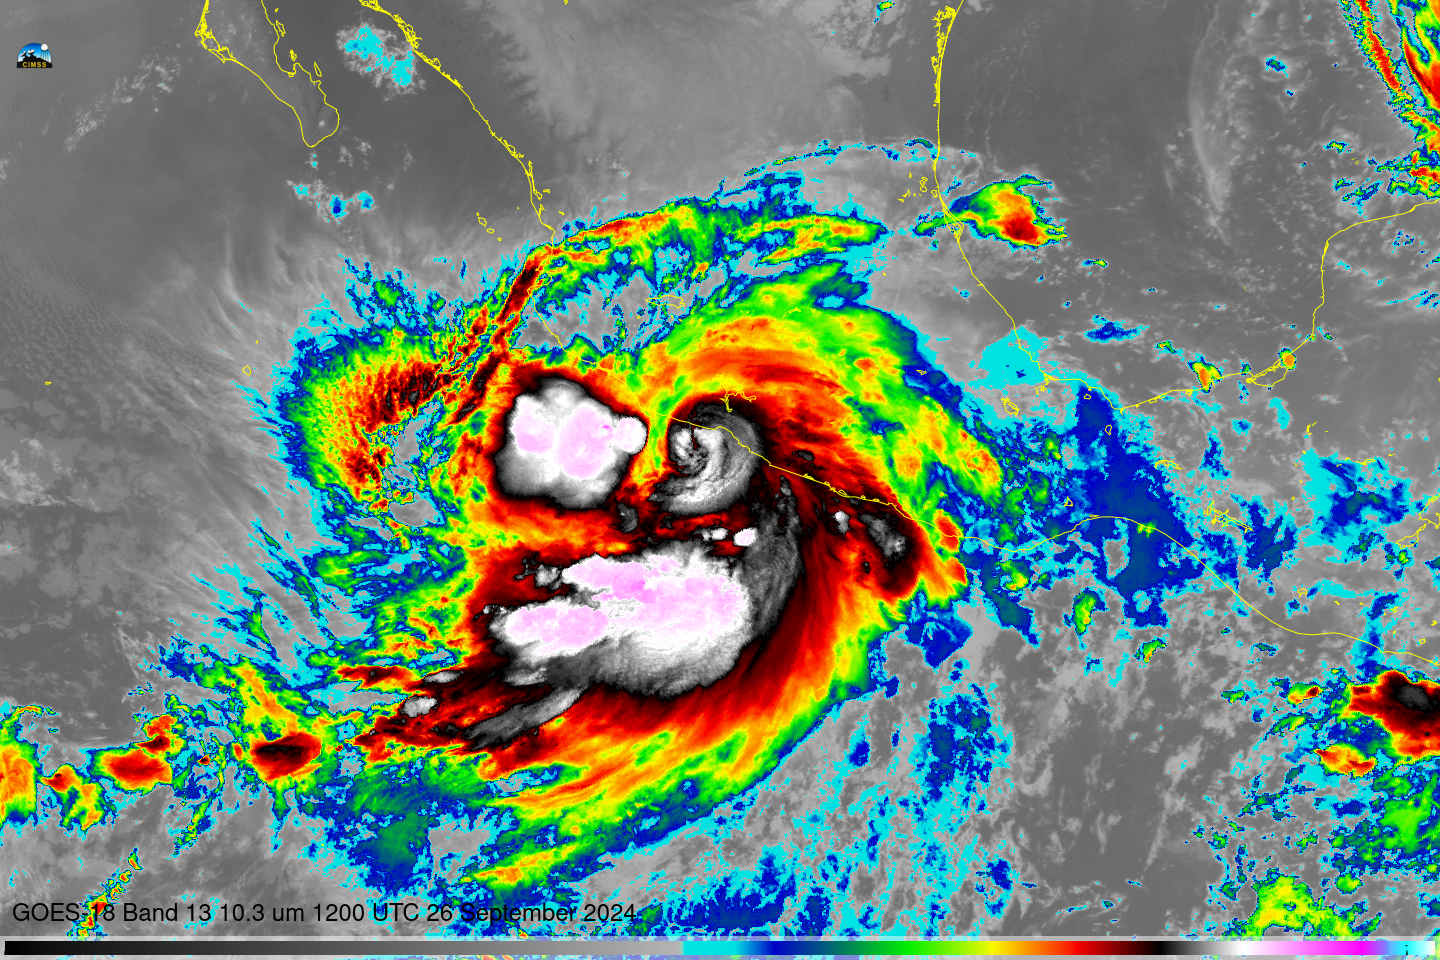
At 1200 UTC on 26 September 2024, shown below, John has redeveloped into a hurricane, with curved bands in the infrared imagery, to the east of a large mesoscale convective system. John weakened as it moved parallel to the coast for the next 30 hours, dissipating at 2100 UTC on 27 September.
GOES-18 Clean Window infrared (Band 13, 10.3 µm) at 1200 UTC 26 September 2024 (Click to enlarge)
GOES-16 Visible imagery (Band 2, 0.64 µm) from Mesoscale Sector 1, above, show the evolution of Helene for about 90 minutes shortly after sunrise on 26 September. Strong convection is wrapping around a center that occasionally has an eye-like characteristic. At the time of the animation, Helene was a very... Read More
GOES-16 Visible imagery (0.64 µm) from Mesoscale Sector 1, 1256-1415 UTC on 26 September (Click to enlarge)
GOES-16 Visible imagery (Band 2, 0.64 µm) from Mesoscale Sector 1, above, show the evolution of Helene for about 90 minutes shortly after sunrise on 26 September. Strong convection is wrapping around a center that occasionally has an eye-like characteristic. At the time of the animation, Helene was a very large (in area) Category 2 hurricane with maximum sustained winds of 100 mph. The visible imagery shows, along the western edge, anticyclonic cirrus outflow (and cyclonic low-level inflow) in addition to the compelling eye convection.
Helene is destined to interact with a mid-tropospheric system over the mid-Mississippi river valley that is shown below in the GOES-16 airmass RGB animation (the area of red/orange over western KY/TN).
GOES-16 airmass RGB, 2351 UTC on 25 September through 1421 UTC on 26 September 2024, in 30-minute steps (Click to enlarge)
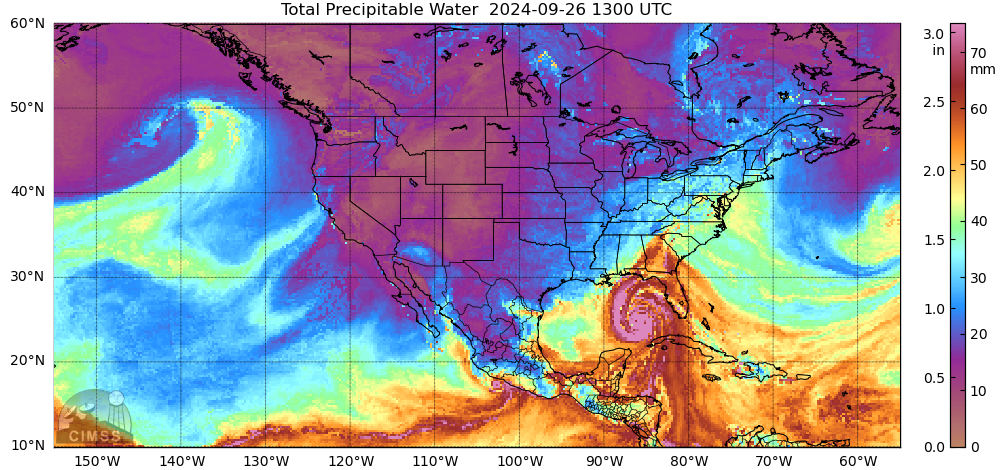
Helene is likely to produce prolific rains over the southeastern United States. MIMIC Total Precipitable Water fields for 1300 UTC on 26 September, above (from this site), suggest a stream of moisture moving north-northwestward from the Bahamas/tropical Atlantic into the southeastern United States. This in addition to the moisture moving northward with Helene itself will likely mean very heavy rains.
As sunset approached, Helene was in the northeast Gulf, nearing landfall, as a much more organized Category 4 storm. Visible imagery, below, shows convection surrounding a more prominent eye.
GOES-16 Visible imagery (0.64 µm) from Mesoscale Sector 1, 2145-2307 UTC on 26 September (Click to enlarge)
The GLM instrument observed lightning throughout the eye during this time of intensification, as shown below. Lightning within the eyewall is a trait of some hurricanes that are strengthening rapidly.
GOES-16 Visible imagery (0.64 µm) from Mesoscale Sector 1, 2145-2307 UTC on 26 September, along with GLM Flash Extent Density scaled from 0-24 (Click to enlarge)


