
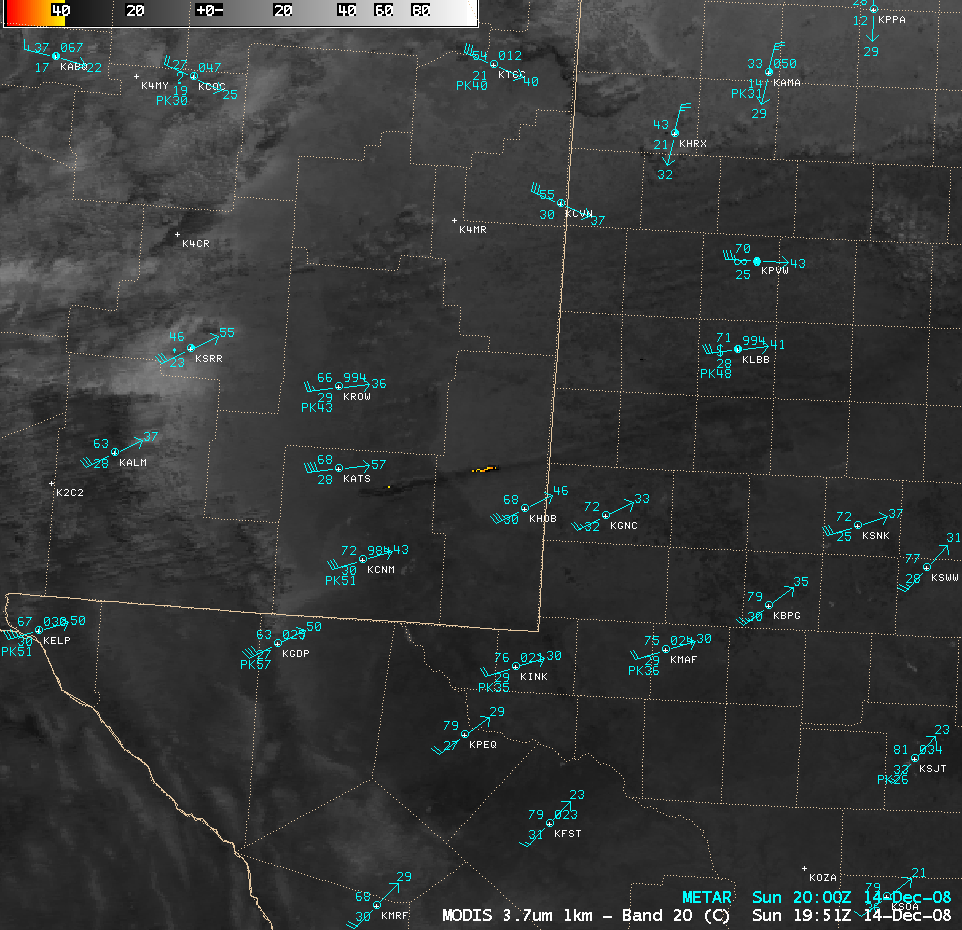
MODIS visible, cirrus, 3.7 µm IR, and water vapor images
Strong winds were producing plumes of blowing dust across parts of southeastern New Mexico and the Texas panhandle region on 14 December 2008 — this blowing dust was reducing surface visibility to 1 mile at Lubbock, Texas (station identifier KLBB). AWIPS images of the MODIS visible, “cirrus detection”, 3.7 µm shortwave IR, and 6.7 µm water vapor channels (above) showed the plumes around 19:51 UTC. The plumes of airborne aerosols exhibited a lighter gray “hazy” appearance on the visible image (and to a lesser extent on the “cirrus detection” image, due to that channel’s sensitivity to particles that scatter light).
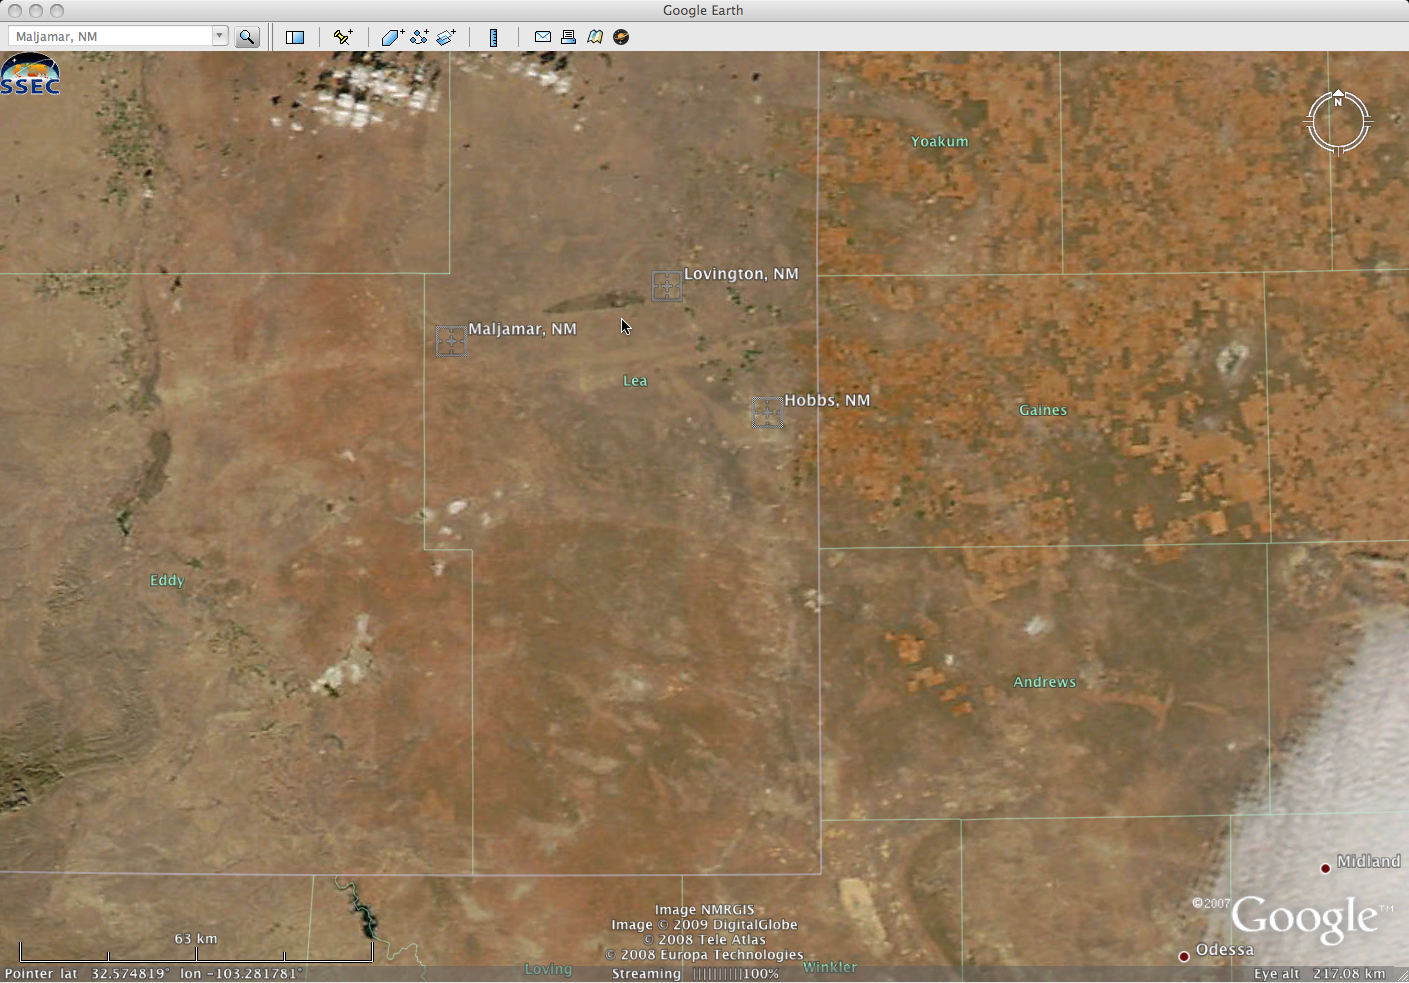
In addition, there was a small cluster of hot MODIS 3.7 µm IR pixels with a maximum temperature of 46º C located just northwest of Hobbs, New Mexico (station identifier KHOB), due to a grass fire that was burning in that area (MODIS 3.7 µm image) — and 250-meter resolution MODIS true color imagery (below) confirmed the presence of a lighter-colored smoke plume embedded within the longer orange-colored blowing dust plume. The burn scar from this fire was clearly evident on MODIS true color imagery (viewed using Google Earth) on the following day (located between Lovington and Maljamar, New Mexico).

MODIS true color image
The strong winds (which gusted as high as 71 mph at Tatum, New Mexico) were producing mountain waves immediately downwind of the higher terrain in the “Big Bend region” of Texas — a comparison of 1-km resolution MODIS 6.7 µm and 4-km resolution GOES-12 6.5 µm water vapor images (below) demonstrated the value of better spatial resolution for detecting such mesoscale phenomena.

MODIS 6.7 µm and GOES-12 6.5 µm water vapor images
View only this post Read Less


")


