
GOES-13 visible images
GOES-13 visible channel images (above) displayed a beautiful example of ducted internal gravity wave clouds over parts of Iowa, Wisconsin, Illinois, and Michigan during the daylight hours on 27 January 2009. The main linear “wave train” feature became obscured by a veil of high cirrus clouds later in the day, but other smaller/shorter wave features were seen to the north (over far northeastern Iowa and southern/central Wisconsin).
AWIPS images of the 1-km resolution MODIS visible, 3.7 µm “shortwave IR”, 6.7 µm “water vapor”, and 11.0 µm “IR window” channels (below) revealed the following points: (1) a strong component of solar reflection on the shortwave IR image (brightness temperature values were as warm as +25º to +35º C, darker gray color enhancement) suggested that the cloud billows were composed of supercooled water droplets, (2) the upward/downward gravity wave motions were also evident on the water vapor imagery, and (3) the IR window brightness temperature values were generally in the -20º to -29º C range (cyan to dark blue color enhancement).

MODIS visible + shortwave IR + water vapor + IR window images
The MODIS Cloud Phase and Cloud Top Temperature products (below) supported the idea of predominantly supercooled water droplet clouds (blue color enhancement), with minimum Cloud Top Temperature values of -22º C along the Wisconsin/Illinois border region.

MODIS visible + cloud phase + cloud top temperature images
A MODIS visible image with an overlay of CIMSS Mesoscale Winds and pilot reports of turbulence (below) showed that the winds in the middle to upper troposphere were fairly strong from the southwest (several wind speeds of 160-200 knots were indicated between the pressure levels of 250 and 337 hPa), and there were a handful of pilot reports of light to moderate turbulence (with one report at an altitude of 37,000 feet over extreme northern Illinois, near the gravity wave feature).

CIMSS GOES mesoscale winds
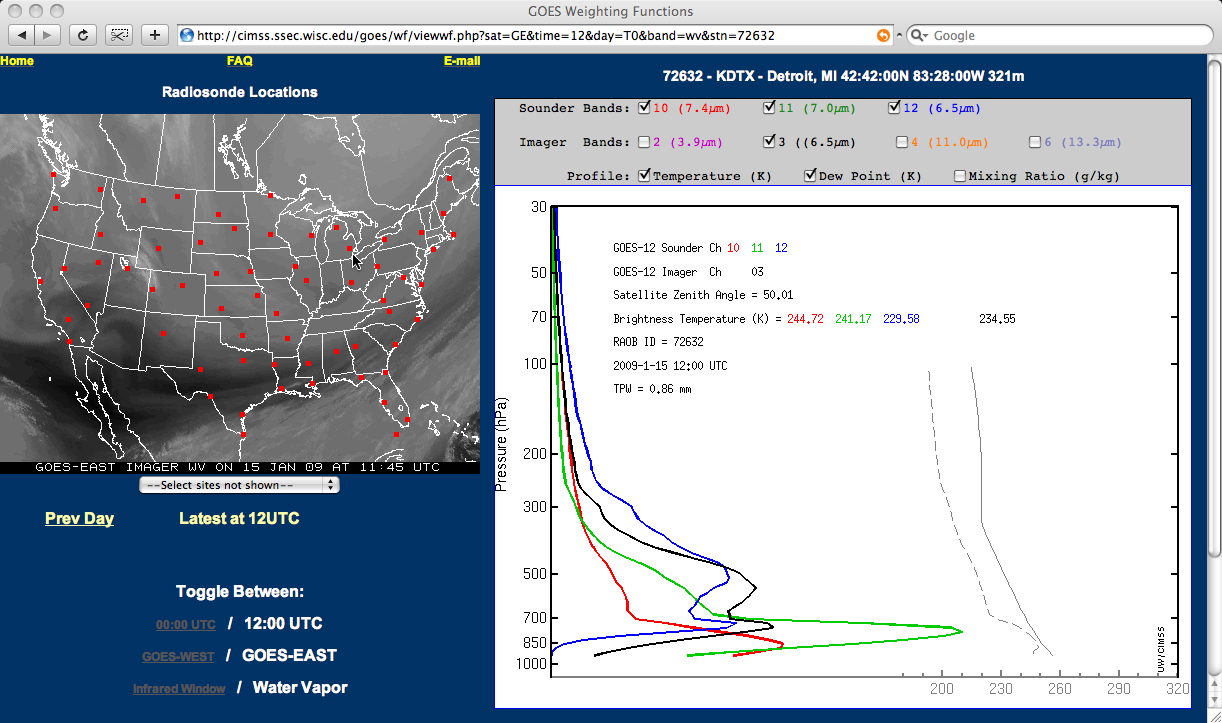
The rawinsonde data from Davenport, Iowa (below) a few hours after the gravity wave features were seen on the satellite imagery showed a pronounced temperature inversion between the 450-500 hPa pressure levels — the air temperatures in that layer were in the -21 to -26º C range, in agreement with the MODIS IR brightness temperature and Cloud Top Temperature values associated with the main gravity wave feature. According to the GOES-12 sounder Cloud Top Height product, the tops of these cloud features were within the 12,000-15,000 feet range (which seemed a bit on the low side, judging from the rawinsonde data).

Davenport, Iowa rawinsonde data
View only this post Read Less

")
")


")


")


