![GOES-16 "Red" Visible (0.64 µm) images, with plots of hourly surface reports [click to play animation]](http://cimss.ssec.wisc.edu/satellite-blog/wp-content/uploads/2018/02/G16_VIS_W_LAKE_SUPERIOR_04FEB2018_960x1280_B2_2018035_180227_0001PANEL_00049.GIF)
GOES-16 “Red” Visible (0.64 µm) images, with plots of hourly surface reports [click to play animation]
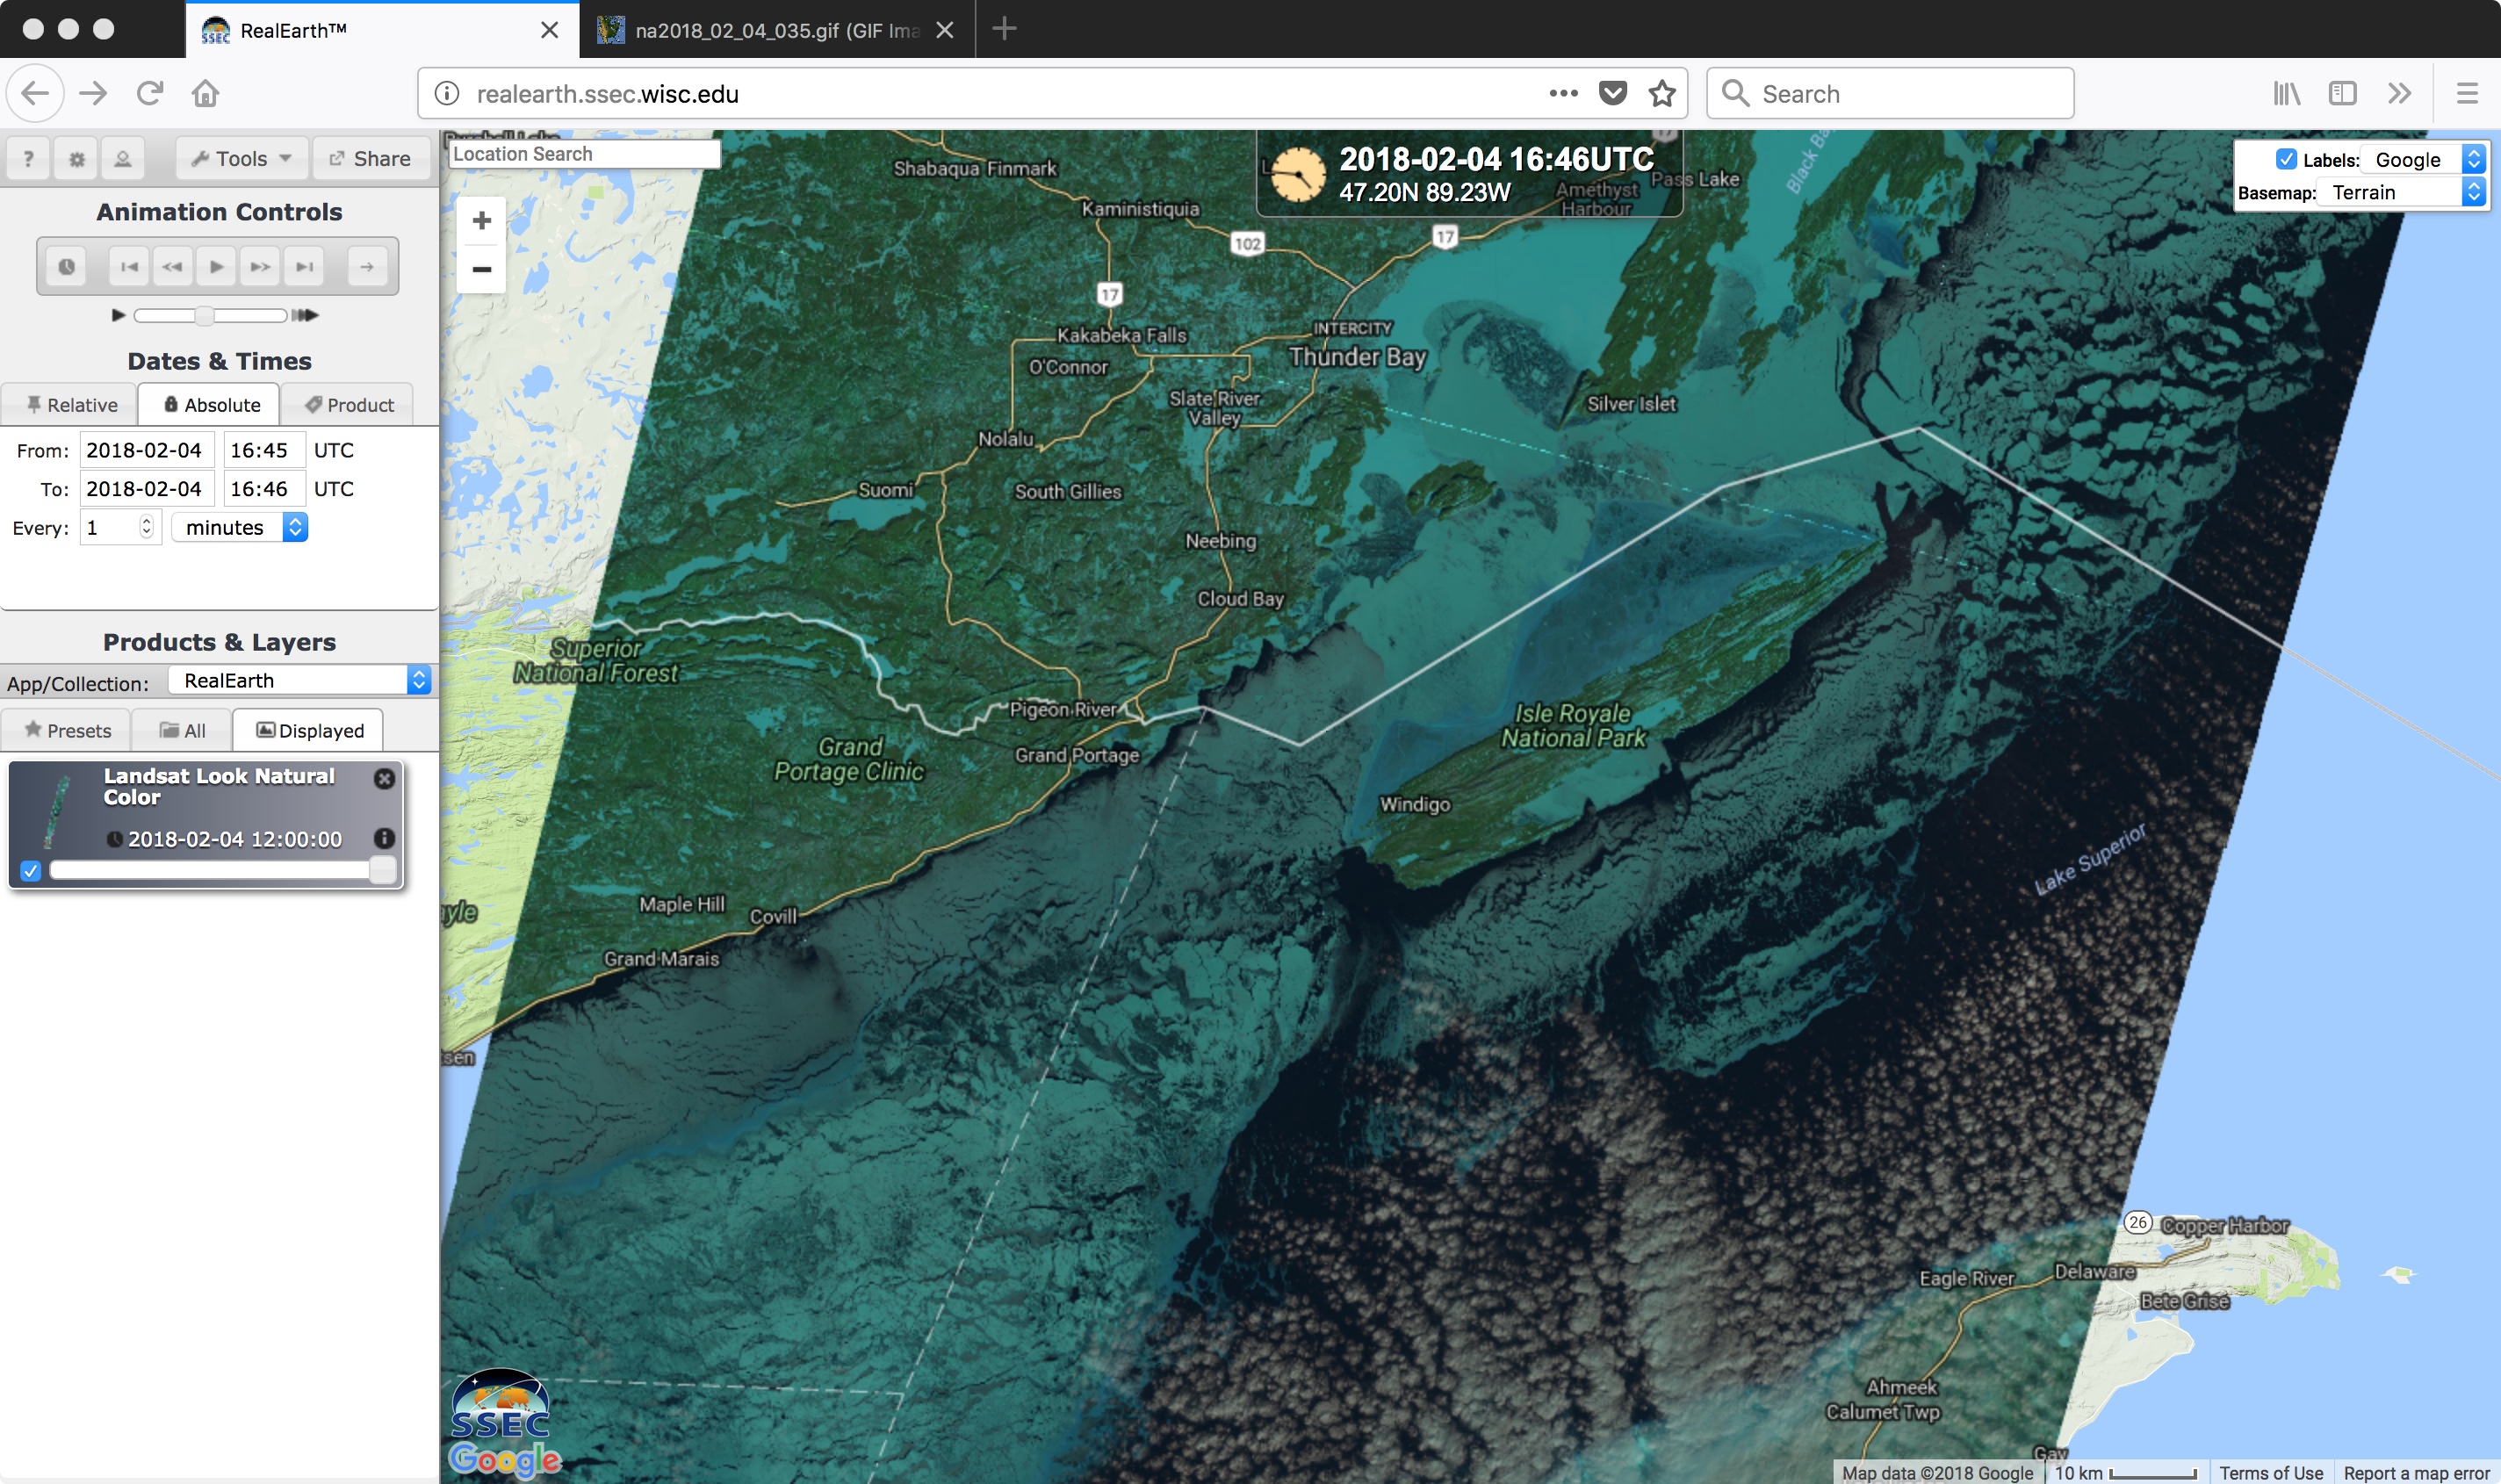
After several days of cold temperatures, ice coverage in the western half of Lake Superior began to increase — and GOES-16
(GOES-East) “Red” Visible (
0.64 µm) images
(above) showed the motion of some of this lake ice (which was driven by a combination of surface winds and lake circulations) on
04 February 2018. That morning a number of locations in northern and northeastern Minnesota reported low temperatures in the -20 to -40 ºF range, with -43 ºF at Embarrass (the coldest location in the Lower 48 states).
With an overpass of the Landsat-8 satellite at 1646 UTC, a 30-meter resolution False-color Red-Green-Blue (RGB) image (below) provided a very detailed view of a portion of the Lake Superior ice. NOAA-GLERL analyzed the mean ice concentration of Lake Superior to be at 23.9% ; the Canadian Ice Service analyzed much of the new lake ice to have a concentration of 9/10ths to 10/10ths.
![Landsat-8 False-color RGB image [click to enlarge]](http://cimss.ssec.wisc.edu/satellite-blog/wp-content/uploads/2018/02/180204_1646utc_landsat8_falsecolor_Lake_Superior_ice.jpeg)
Landsat-8 False-color RGB image [click to enlarge]
Magnified sections of the Landsat-8 RGB image swath are shown below, moving from northeast to southwest.
![Landsat-8 False-color RGB image [click to enlarge]](http://cimss.ssec.wisc.edu/satellite-blog/wp-content/uploads/2018/02/180204_landsat8_zoom_1.jpeg)
Landsat-8 False-color RGB image [click to enlarge]
![Landsat-8 False-color RGB image [click to enlarge]](http://cimss.ssec.wisc.edu/satellite-blog/wp-content/uploads/2018/02/180204_landsat8_zoom_2.jpeg)
Landsat-8 False-color RGB image [click to enlarge]
![Landsat-8 False-color RGB image [click to enlarge]](http://cimss.ssec.wisc.edu/satellite-blog/wp-content/uploads/2018/02/180204_landsat8_zoom_3.jpeg)
Landsat-8 False-color RGB image [click to enlarge]
![Landsat-8 False-color RGB image [click to enlarge]](http://cimss.ssec.wisc.edu/satellite-blog/wp-content/uploads/2018/02/180204_landsat8_zoom_4.jpeg)
Landsat-8 False-color RGB image [click to enlarge]
Moving to the south, a closer look at Green Bay in northeastern Wisconsin revealed a few small ice floes drifting from the north end of the bay into Lake Michigan
(below).

GOES-16 “Red” Visible (0.64 µm) images, with plots of hourly surface reports [click to play animation]