Wet weather continues in Samoa
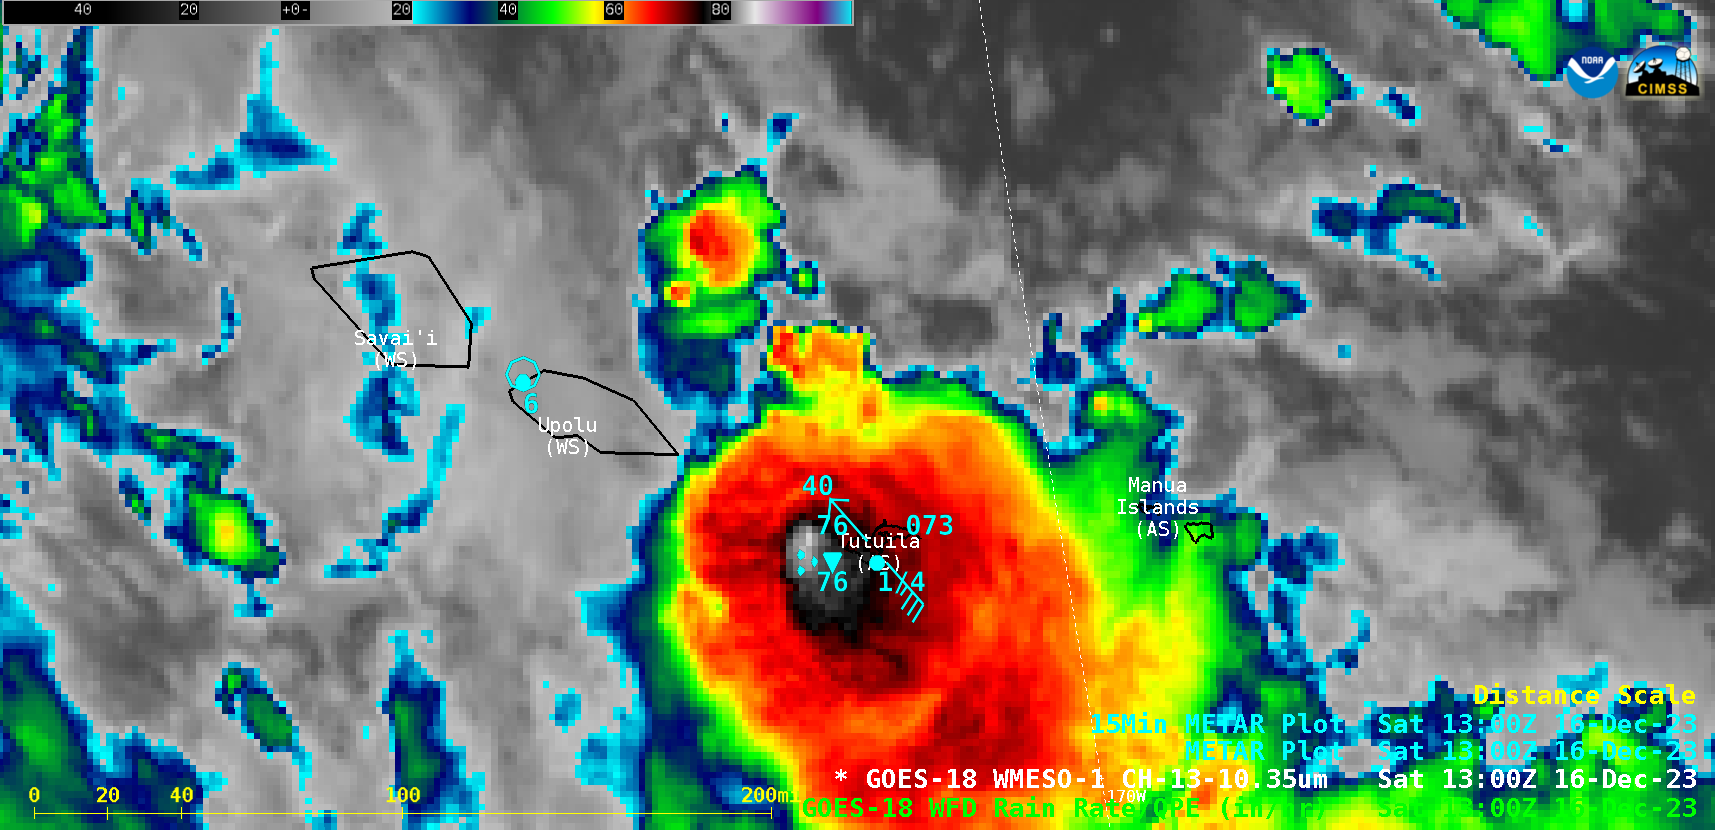
MIMIC Total Preciptable Water (TPW) Fields (from this site), below, for the 24 hours ending 1300 UTC on 26 December 2023, show the Samoan Islands (at 13-14oS, ~172oW) in the middle of the South Pacific Convergence Zone (SPCZ) that stretches east-southeastward across the South Pacific. Pago Pago has received more than 20″... Read More
