1-minute GOES-18 images to monitor heavy rainfall potential across American Samoa
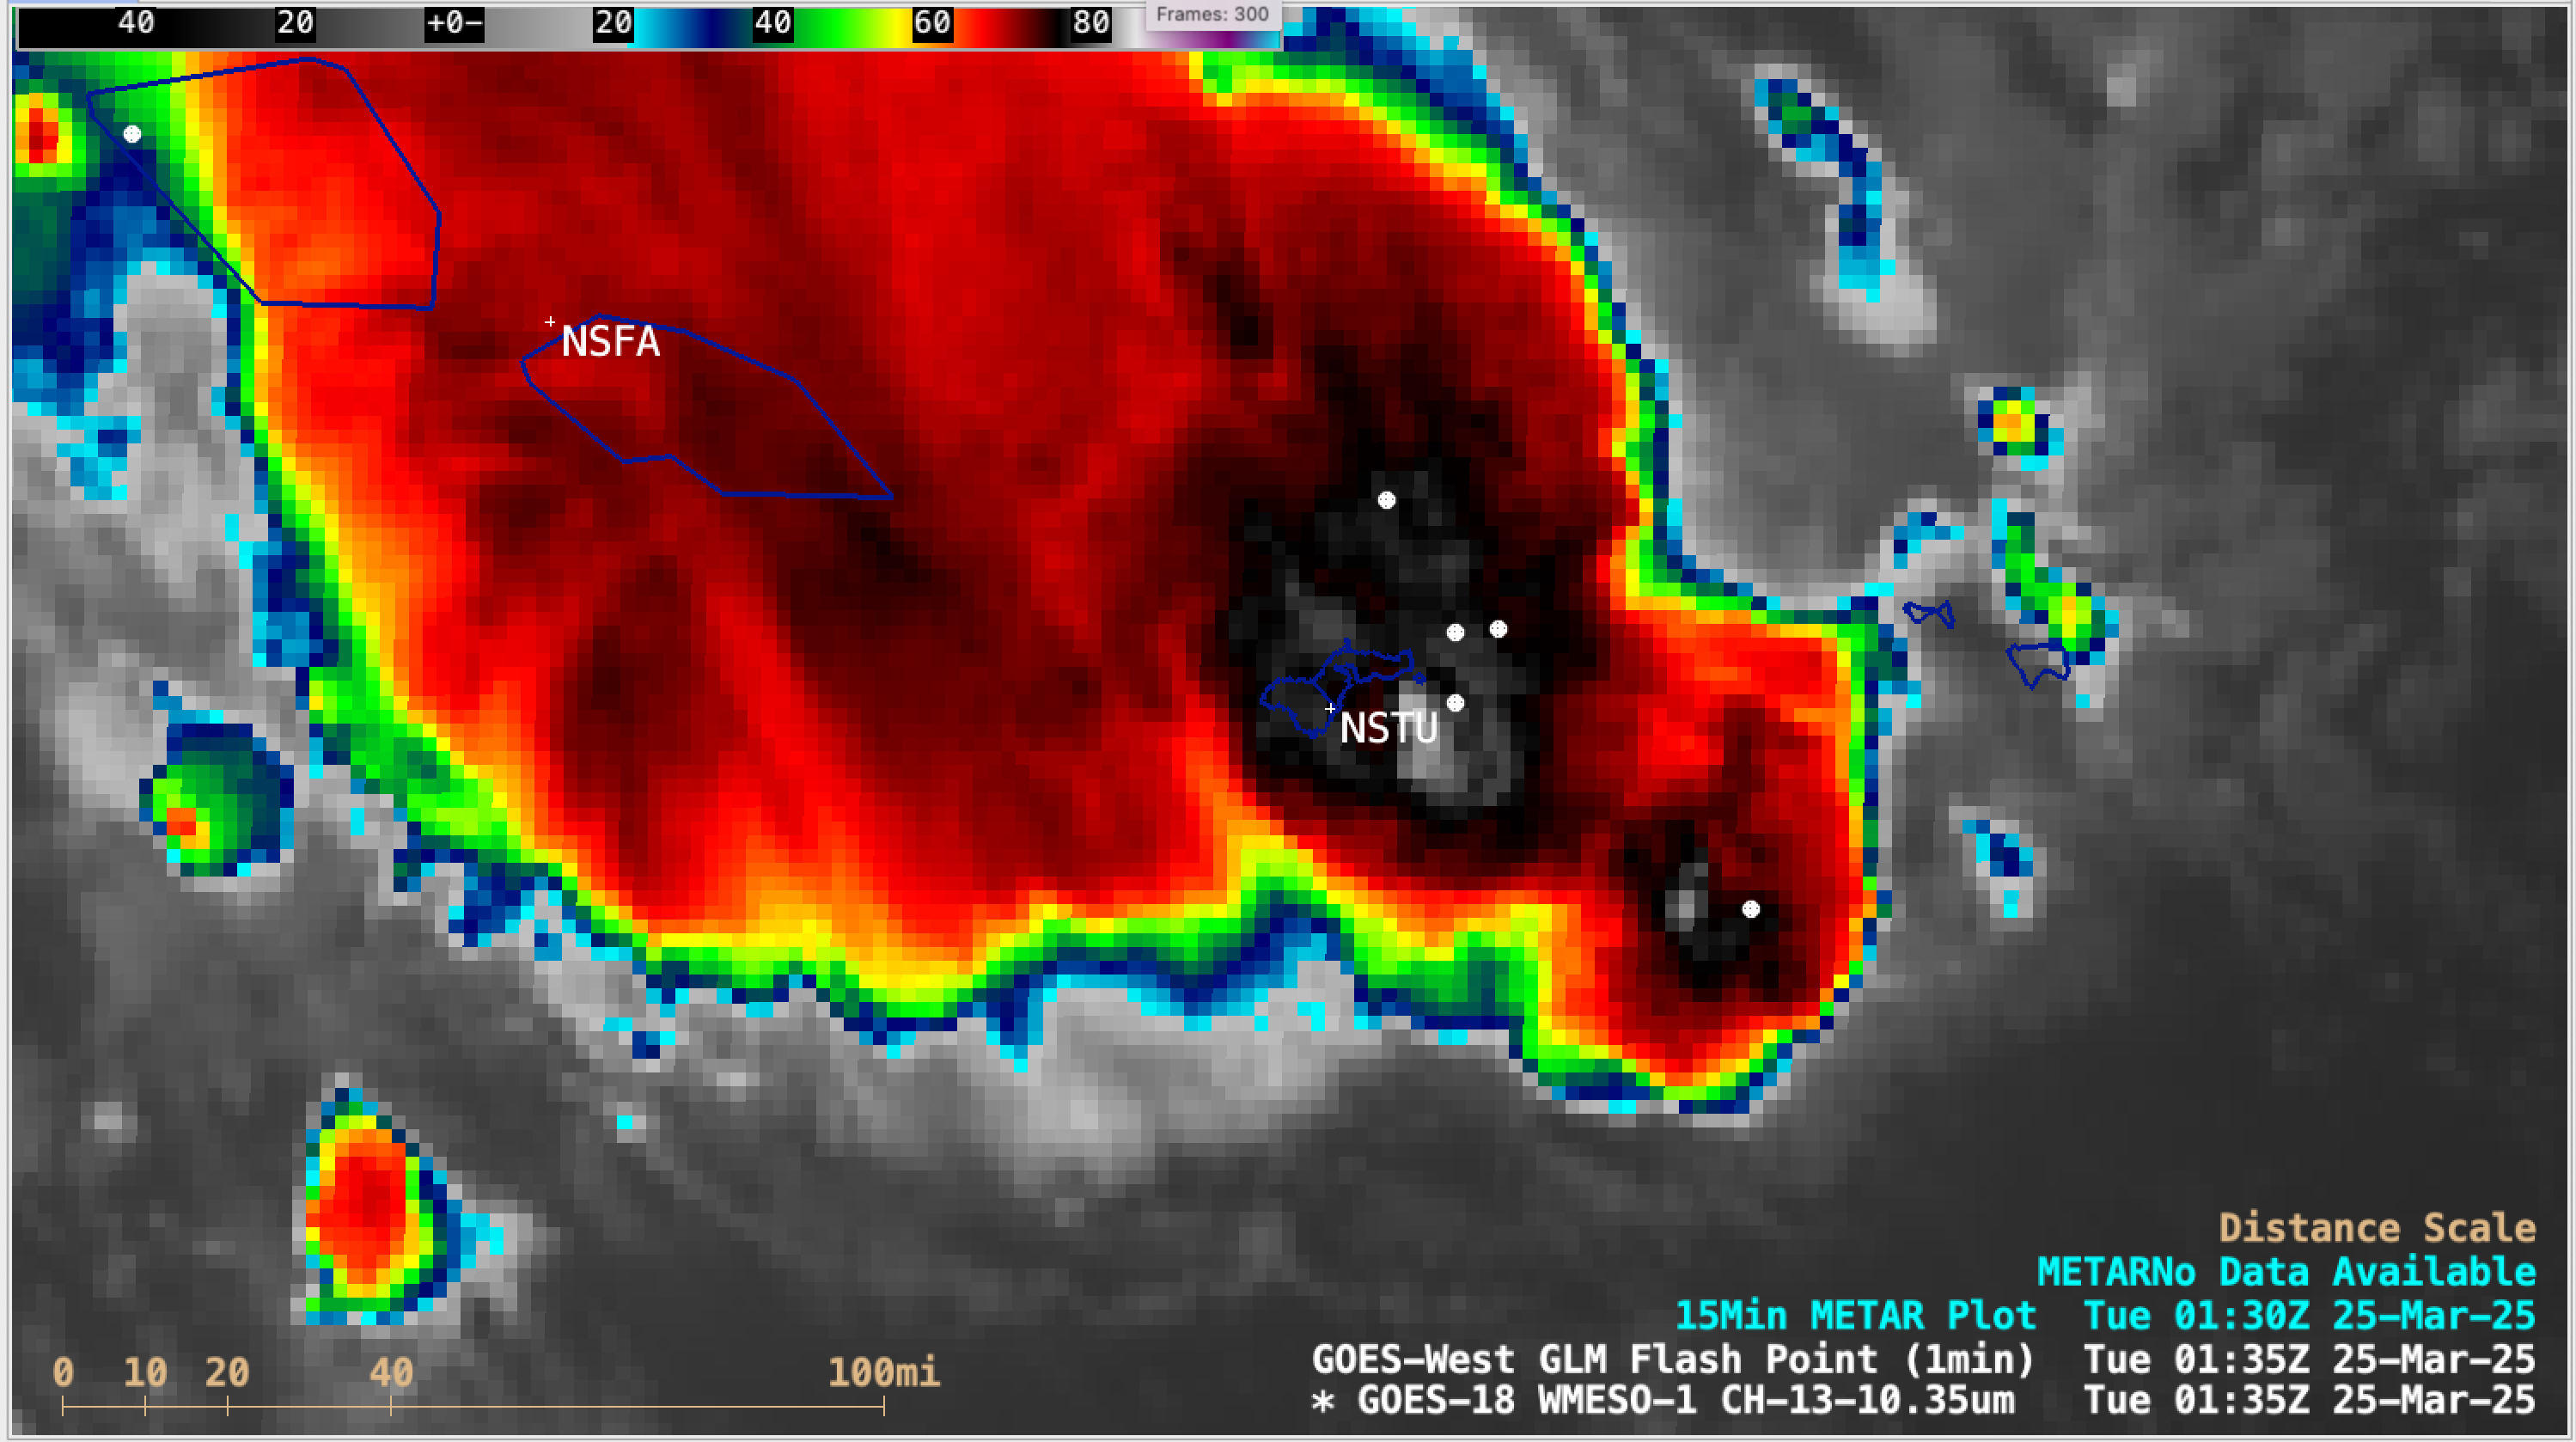
1-minute GOES-18 Clean Infrared Window (10.3 µm) images with an overlay of GLM Flash Points, from 1901 UTC on 24 March to 0400 UTC on 25 March [click to play MP4 animation]
A listing of Pago Pago surface observations is shown below — highlighting the time period displayed by the 1-minute GOES-18 imagery (during which NSTU received 3.72″ of rainfall in 3 hours). Local time in American Samoa is 11 hours behind UTC.
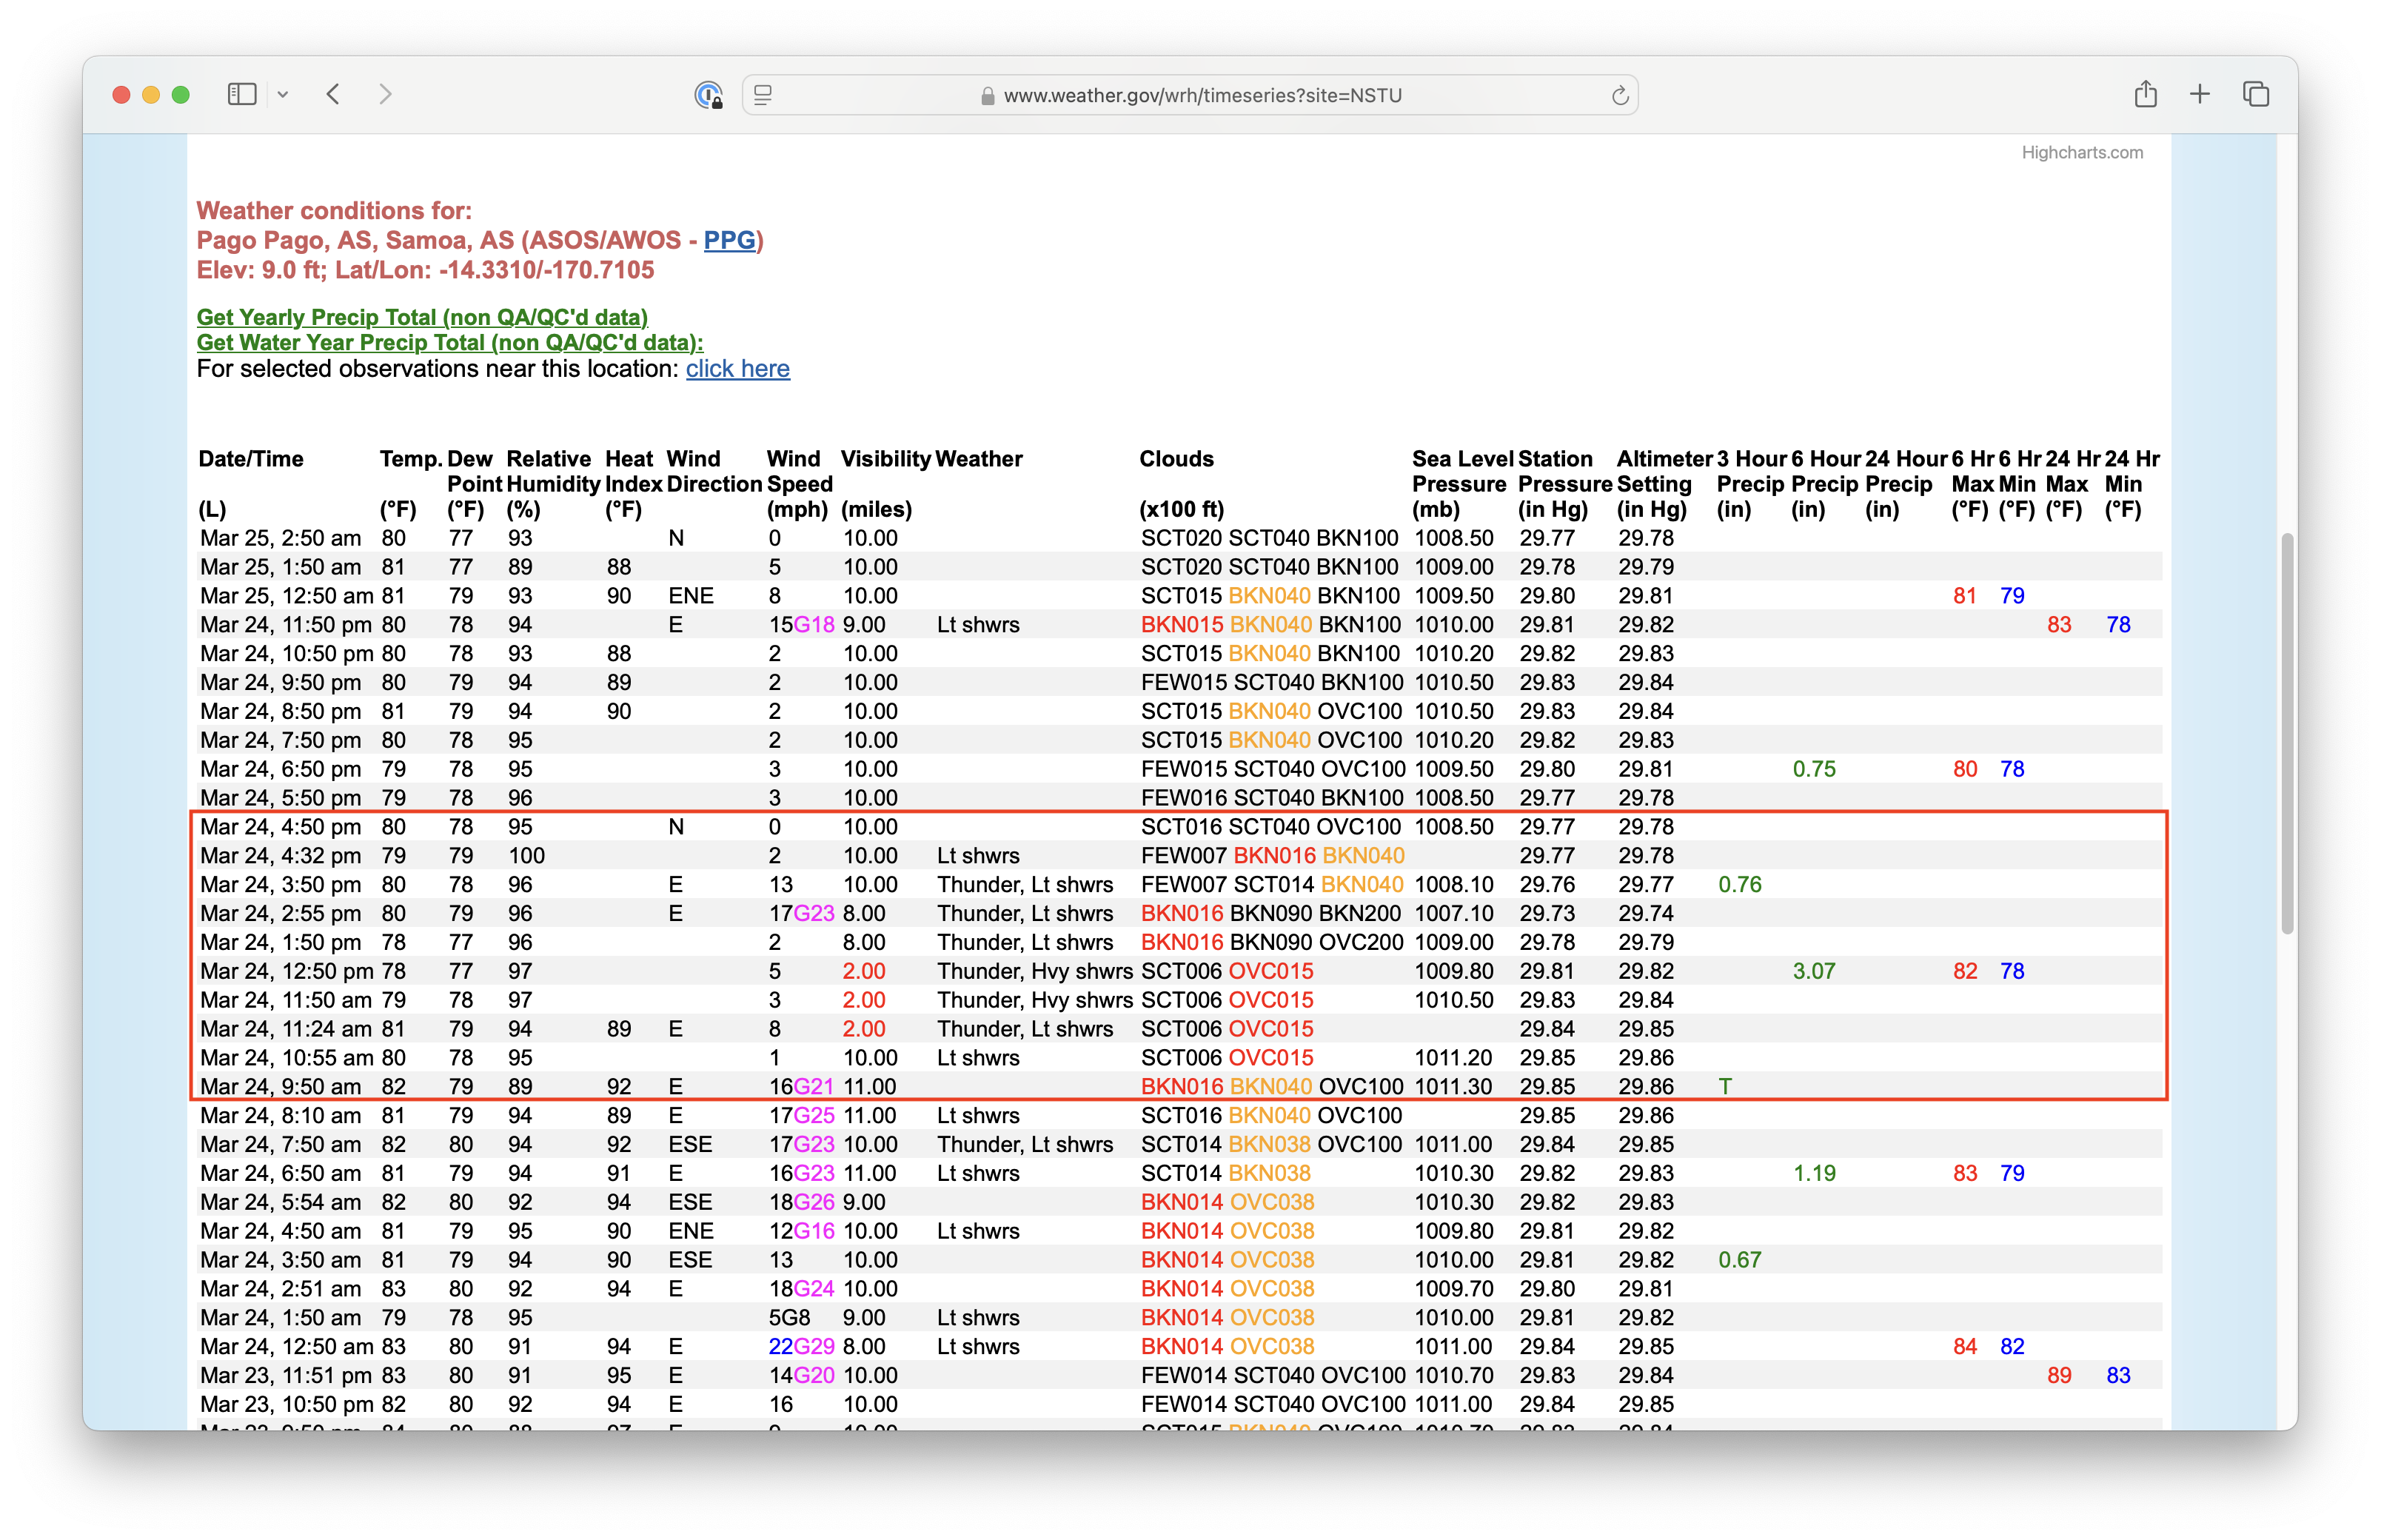
Surface observations from Pago Pago, American Samoa (NSTU) — the red box highlights the time period covered by the 1-minute GOES-18 imagery [click to enlarge]
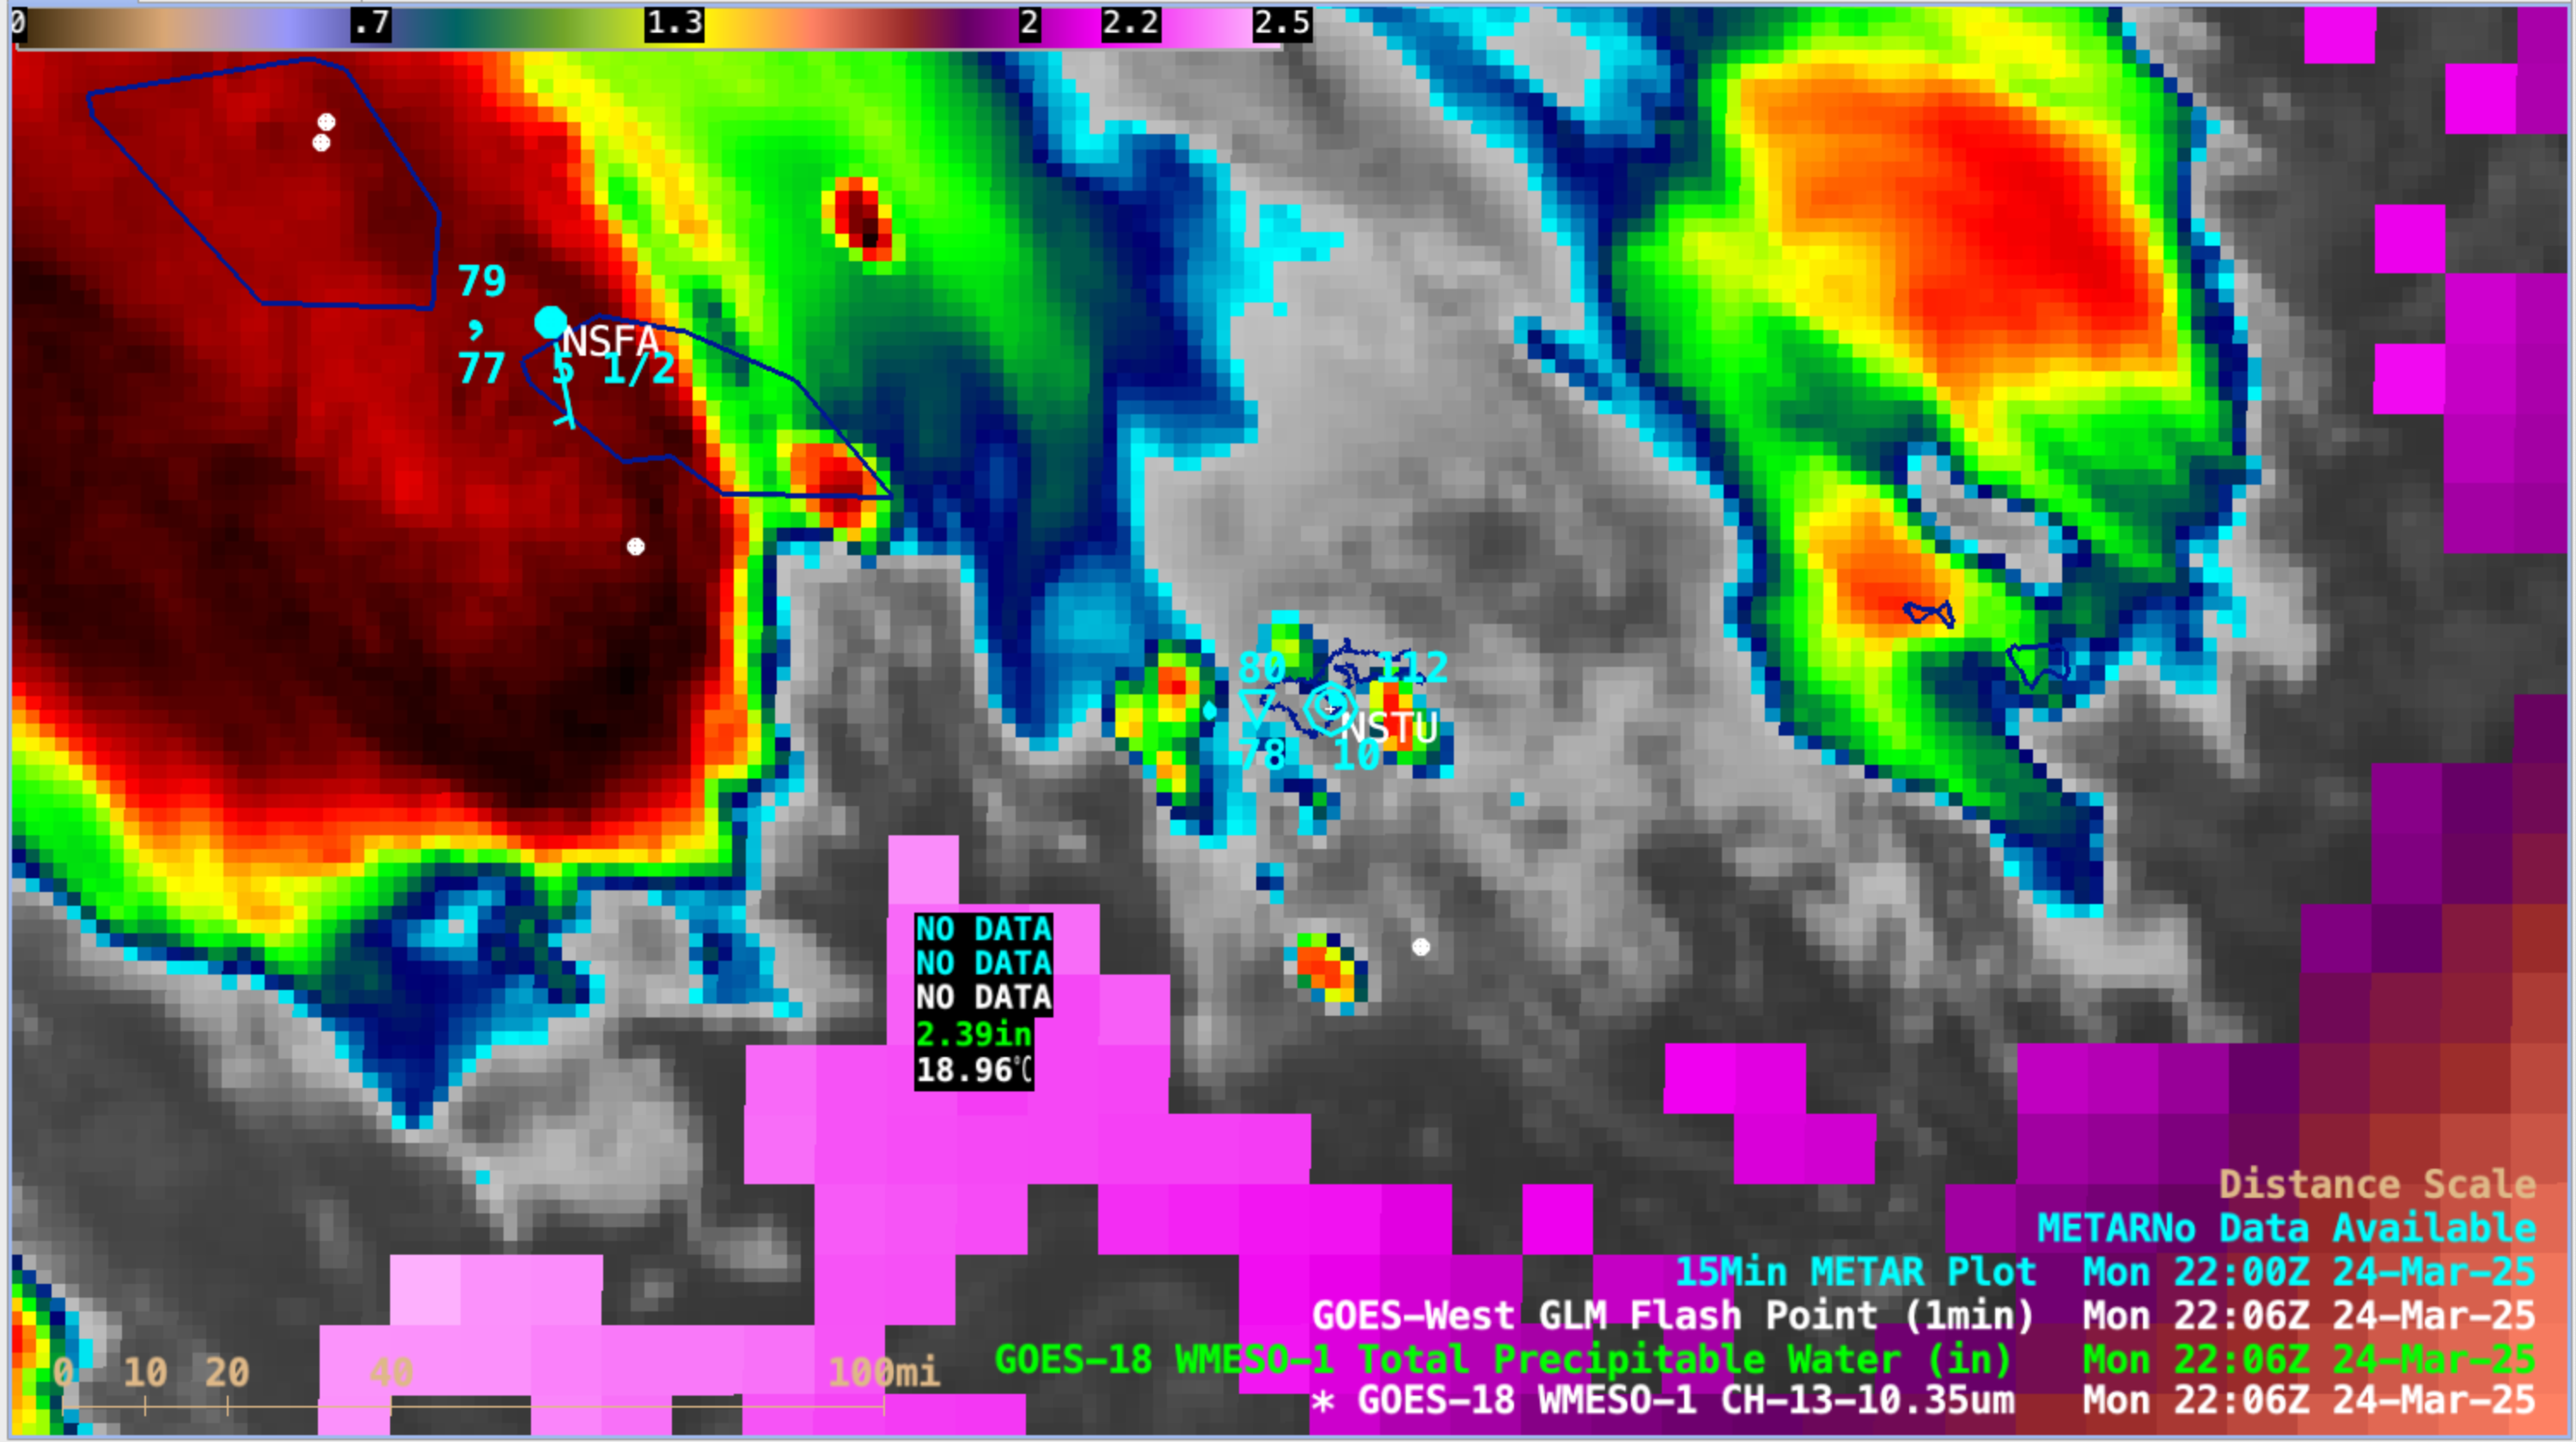
GOES-18 Clean Infrared Window (10.3 µm) image with an overlay of the Total Precipitable Water derived product and GLM Flash Points at 2206 UTC on 24 March [click to enlarge]
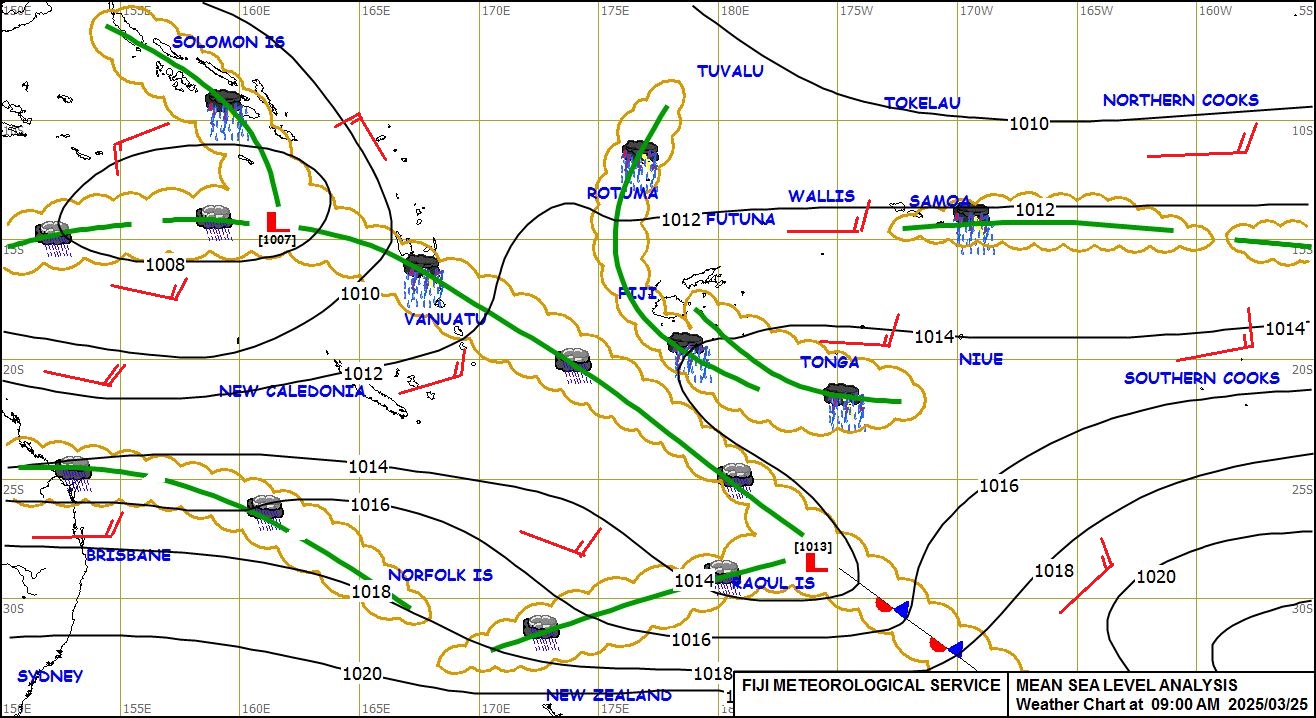
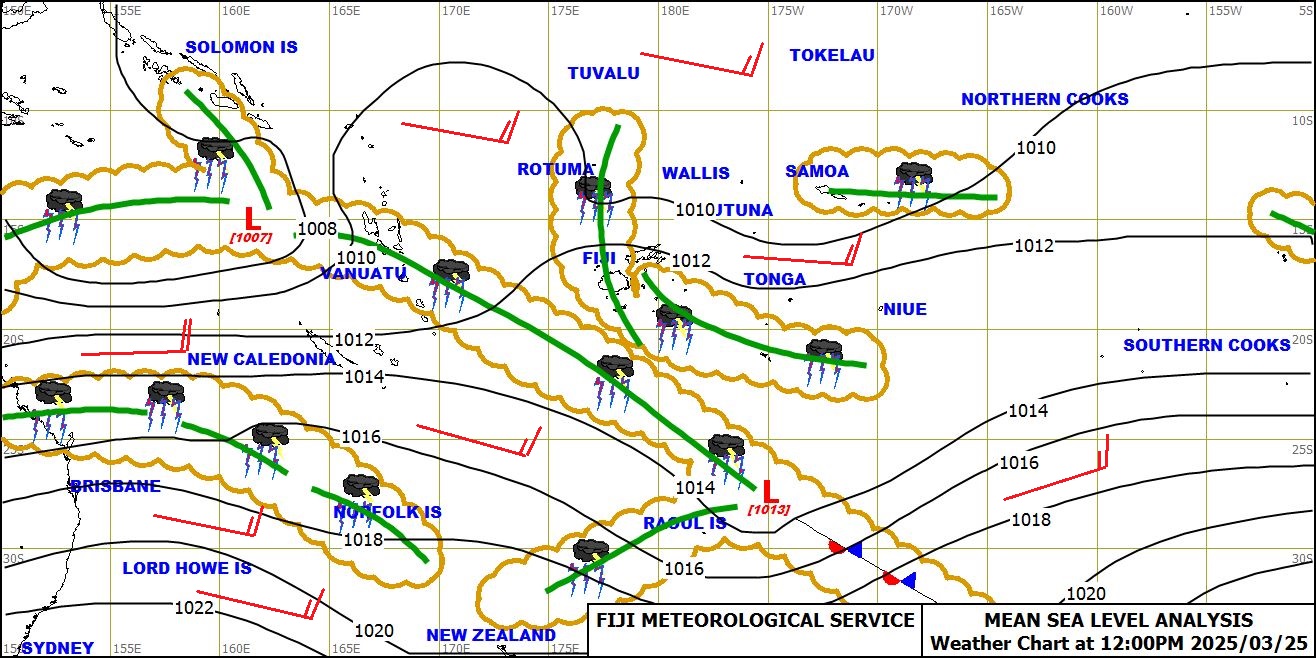
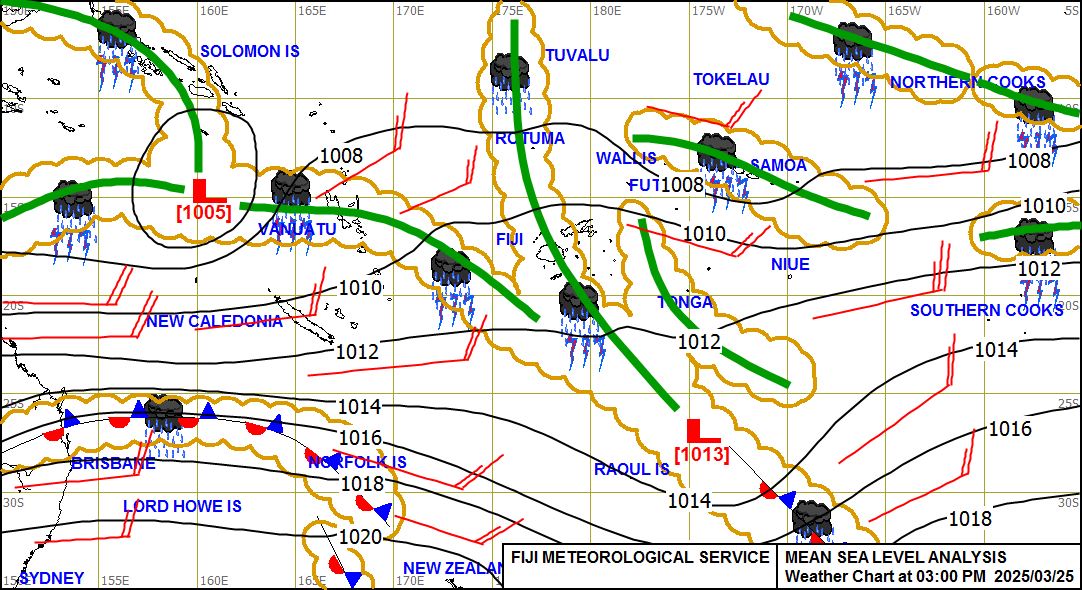
The heavy rains that occurred were within a large region of atmospheric moisture as shown in the MIMIC TPW animation below of Total Precipitable Water. MIIMIC TPW values started decreasing around 0900 UTC on 25 March 2025.