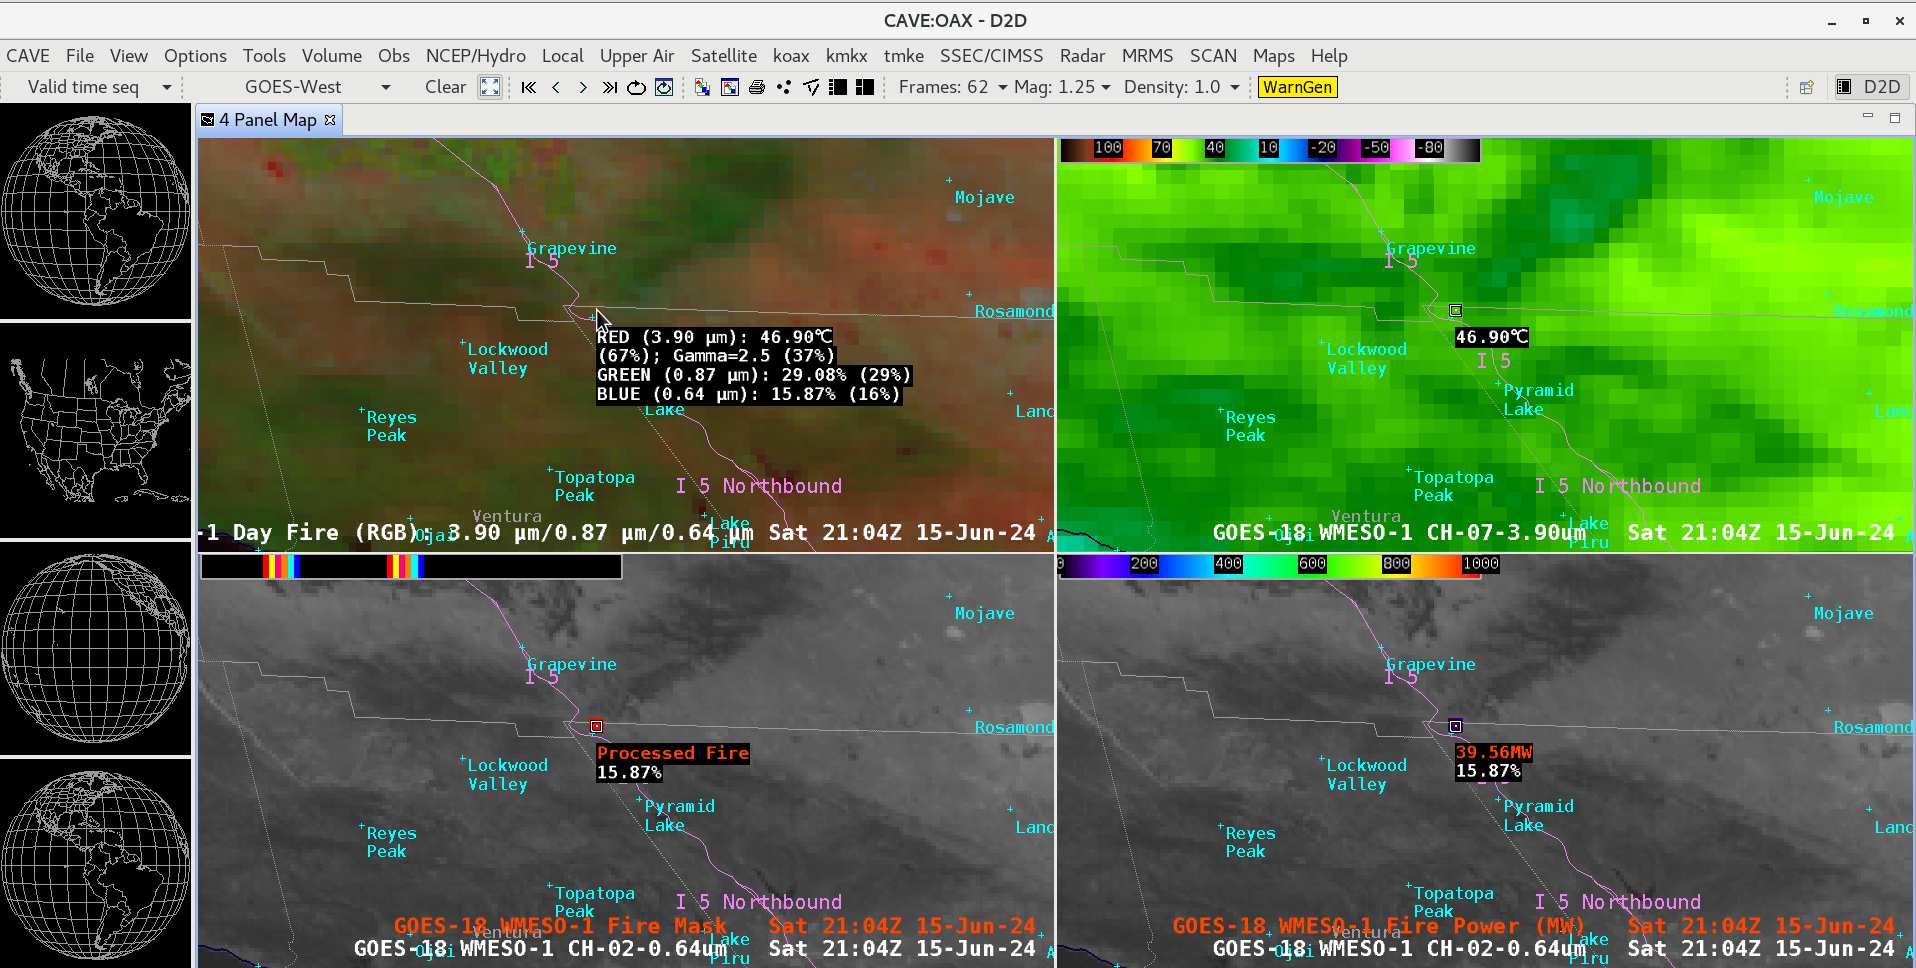
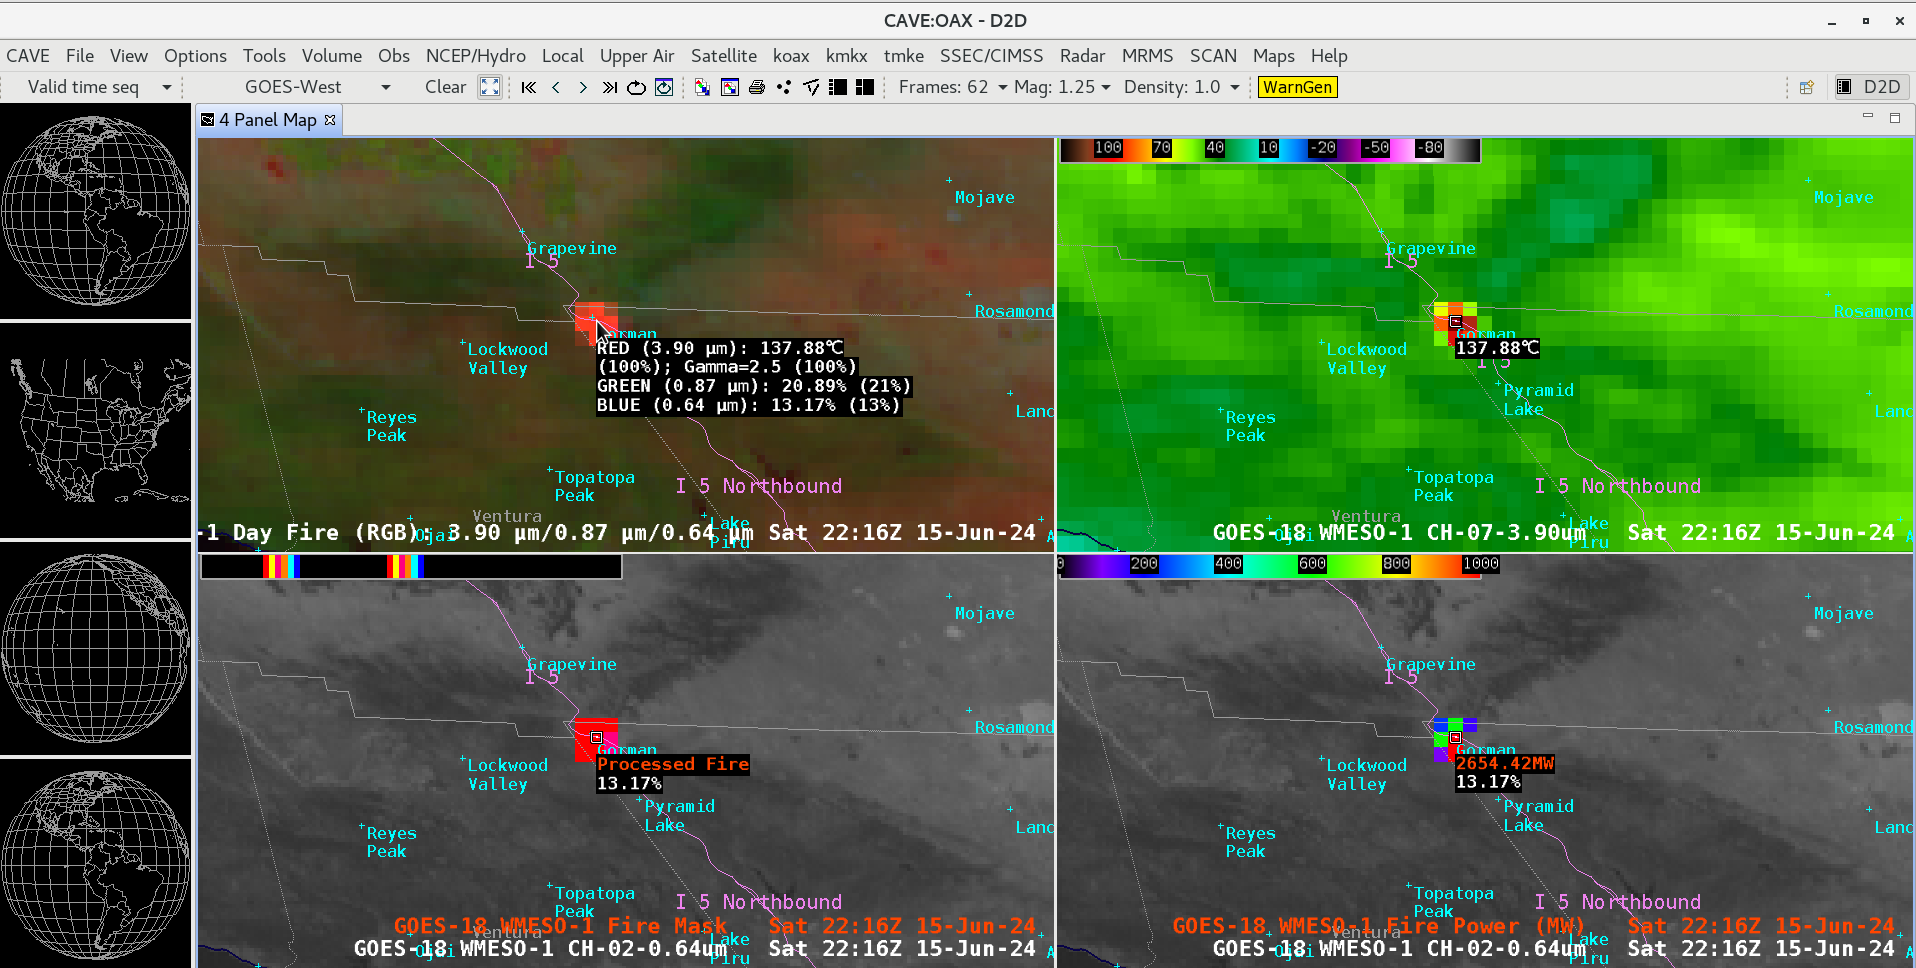
Post Fire in Southern California

GOES-18 Day Fire RGB (top left), Shortwave Infrared (3.9 µm, top right), and “Red” Visible (0.64 µm) images with overlays of the Fire Mask (bottom left) and Fire Power derived products (bottom right), from 2057 UTC on 15 June to 0200 UTC on 16 June; Interstate 5 is plotted in violet [click to play animated GIF | MP4]
1-minute GOES-18 True Color RGB images (source) from 2130 UTC on 15 June to 0149 UTC on 16 June (below) showed the transport of dense smoke from the wildfire. Note the occasional pyrocumulus jumps near the fire source region.
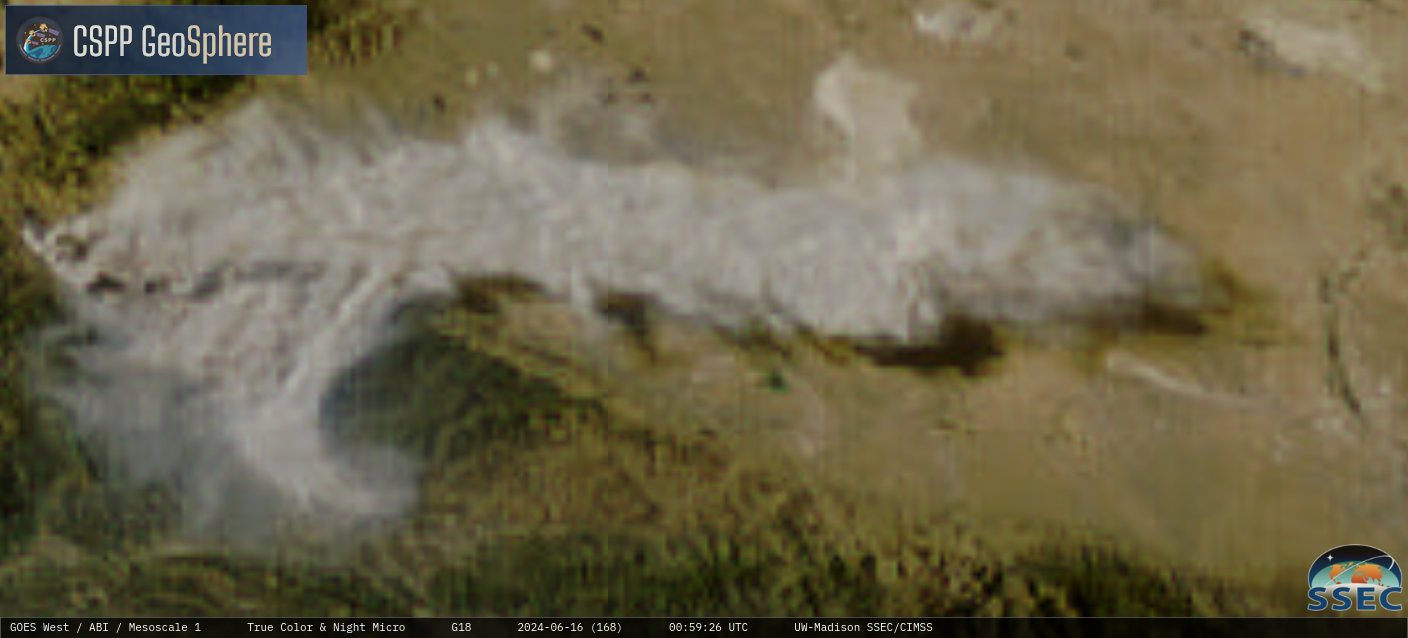
1-minute GOES-18 True Color RGB images, from 2130 UTC on 15 June to 0149 UTC on 16 June [click to play MP4 animation]

1-minute GOES-18 Day Fire RGB images with METAR sites plotted in yellow, from 2200 UTC on 15 June to 0200 UTC on 16 June [click to play animated GIF | MP4]
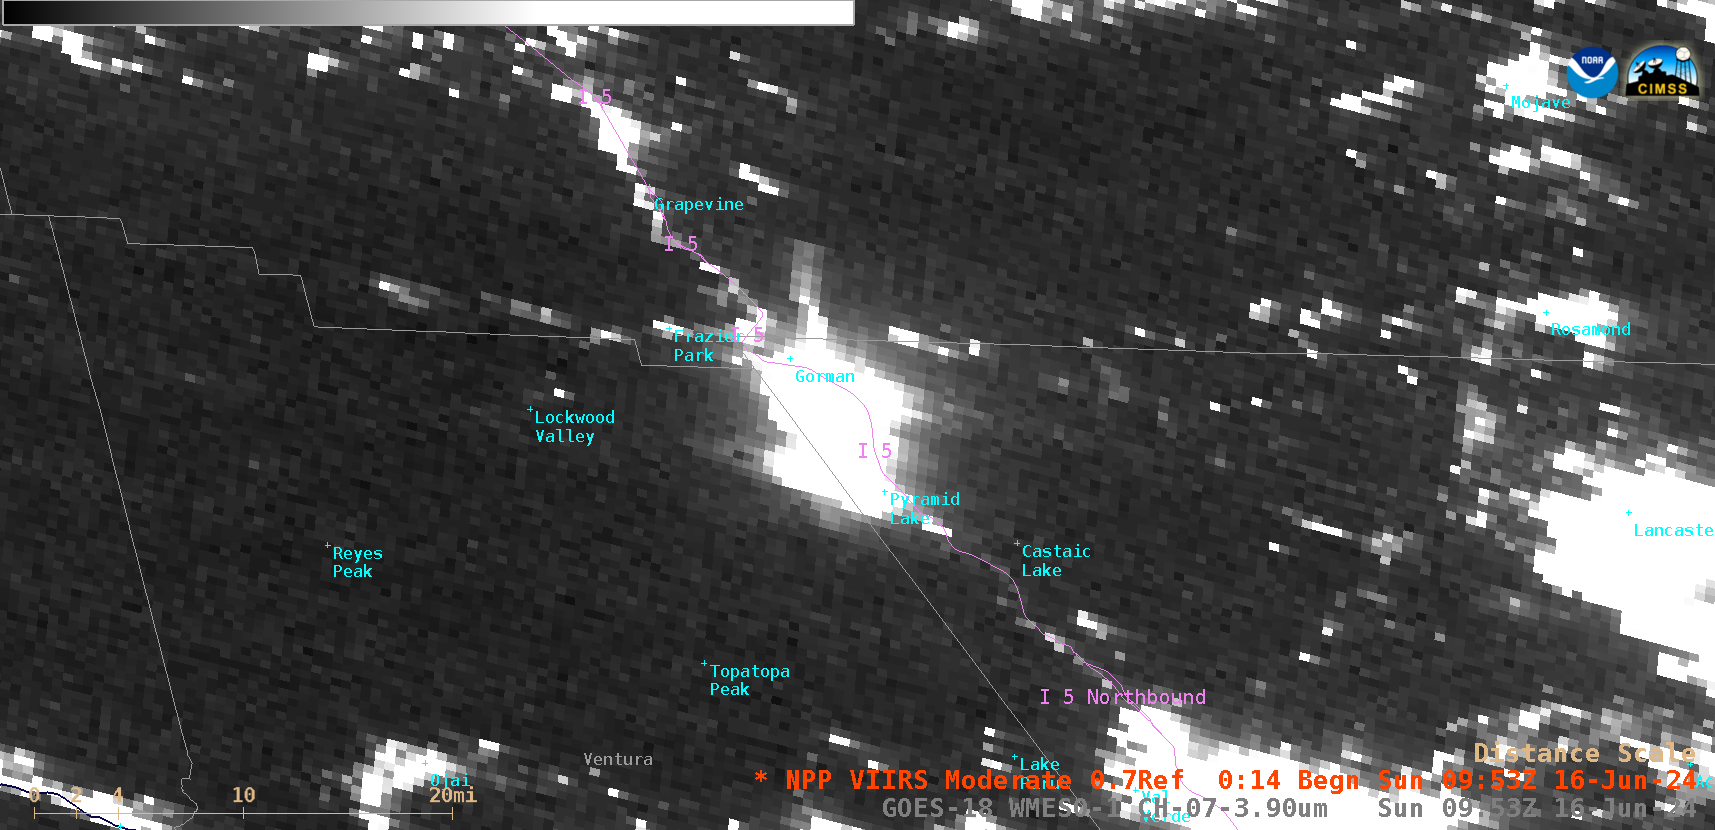
NOAA-21 VIIRS Day/Night Band (0.7 µm) image valid at 0944 UTC on 16 June [click to enlarge]

1-minute GOES-18 Shortwave Infrared (3.9 µm) images, from 2100 UTC on 15 June to 2359 UTC on 16 June [click to play animated GIF | MP4]
NOAA-20 VIIRS True Color and False Color RGB images at 2014 UTC on 16 June [click to enlarge]