1-minute GOES-18 imagery to monitor ongoing heavy rainfall in American Samoa

1-minute GOES-18 Clean Infrared Window (10.3 µm) images, from 1000 UTC to 1600 UTC on 16 December [click to play animated GIF | MP4]
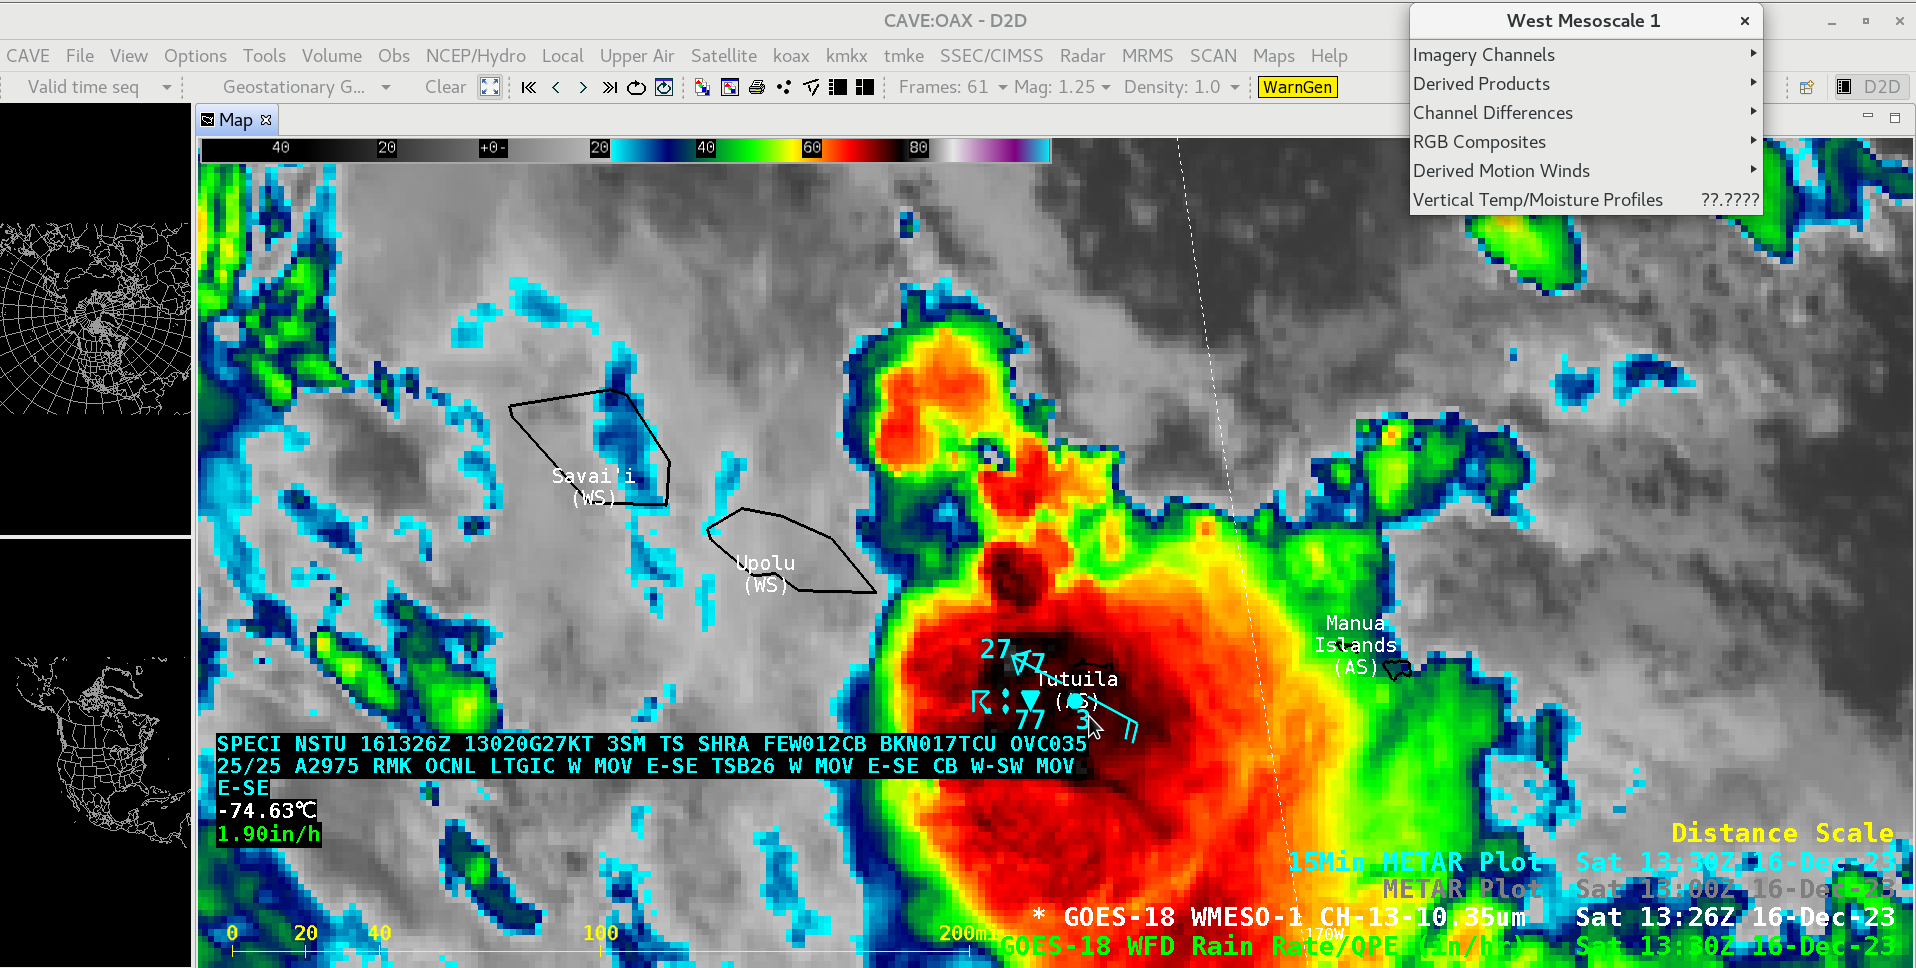
GOES-18 Clean Infrared Window (10.3 µm) image at 1326 UTC on 16 December, with a cursor sample of the corresponding NSTU METAR [click to enlarge]
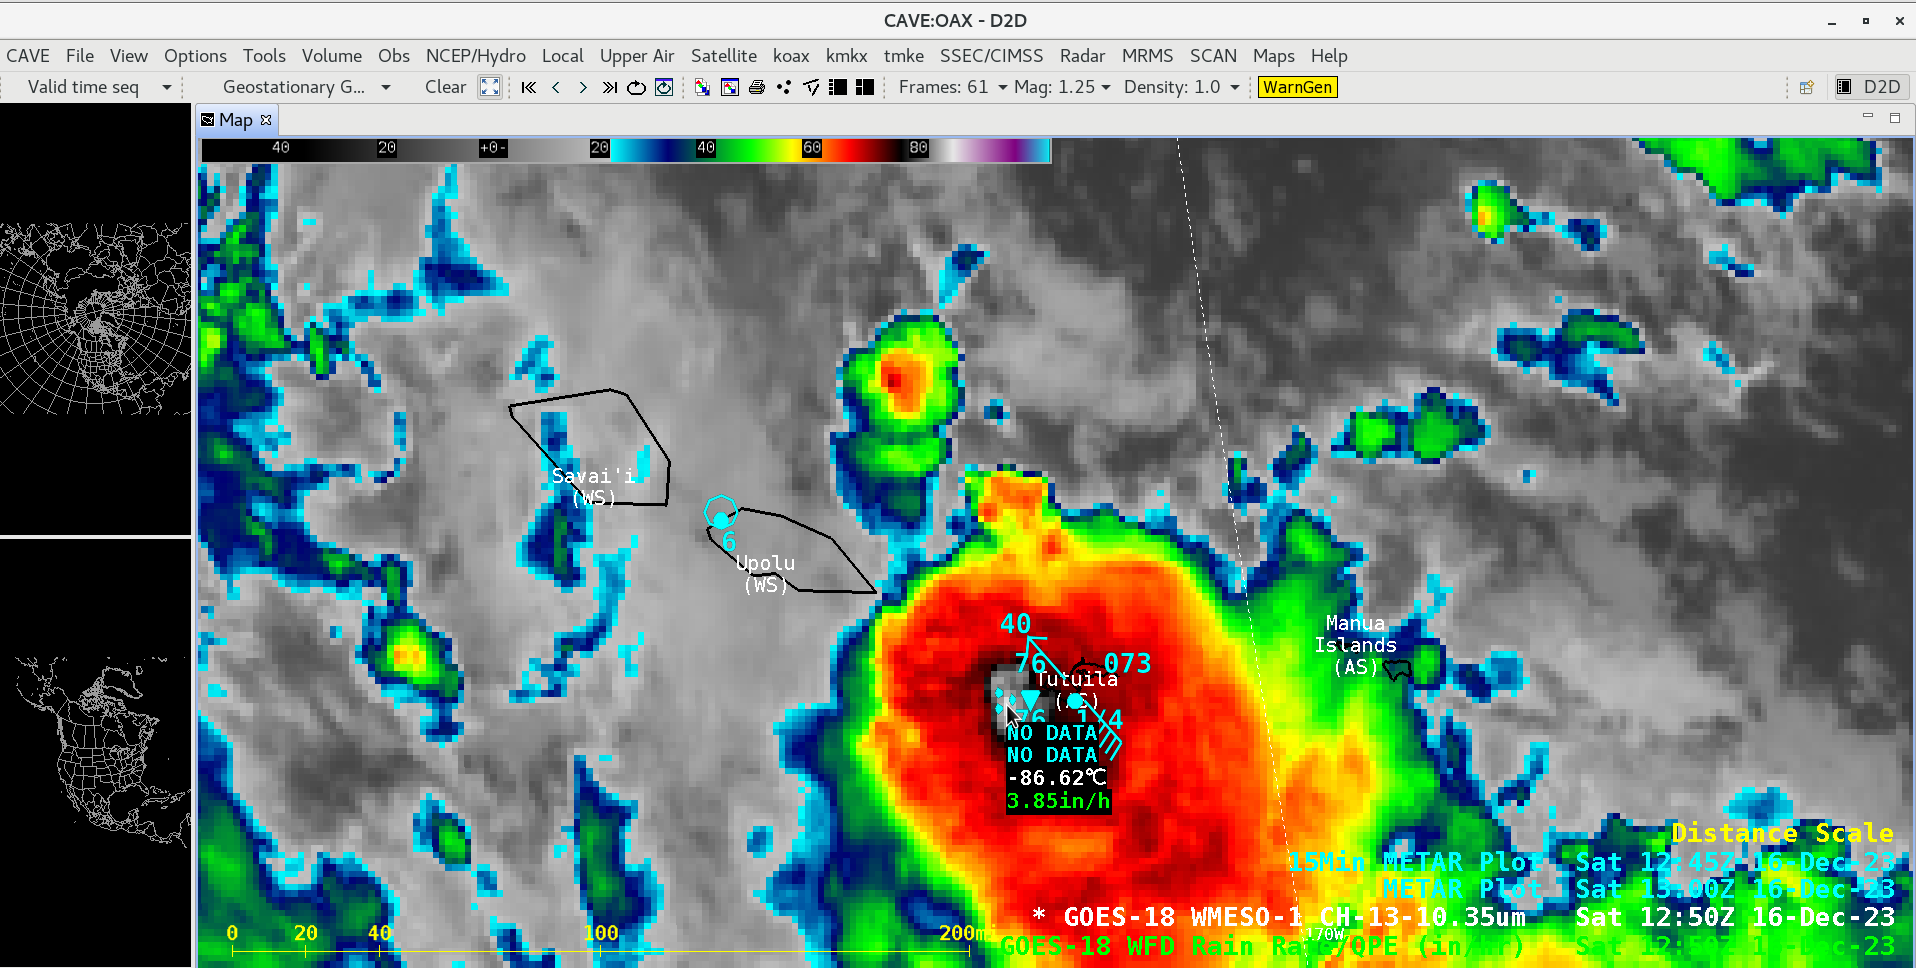
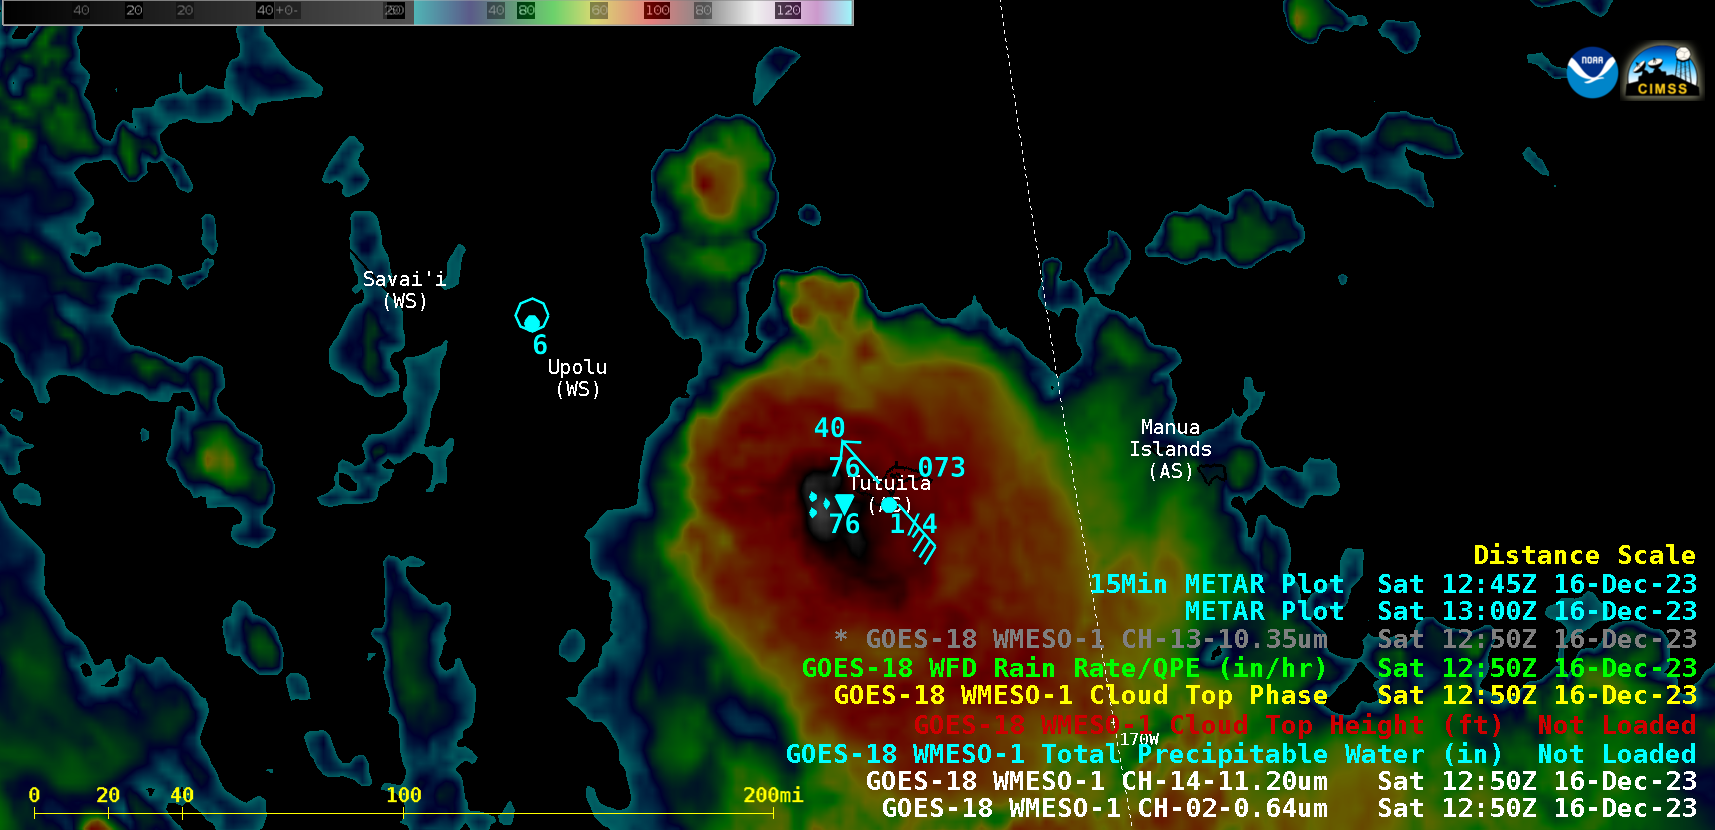
GOES-18 Clean Infrared Window (10.3 µm) image at 1250 UTC on 16 December, with a cursor sample of 10.3 µm brightness temperature and Rain Rate derived product just west of Tutuila [click to enlarge]
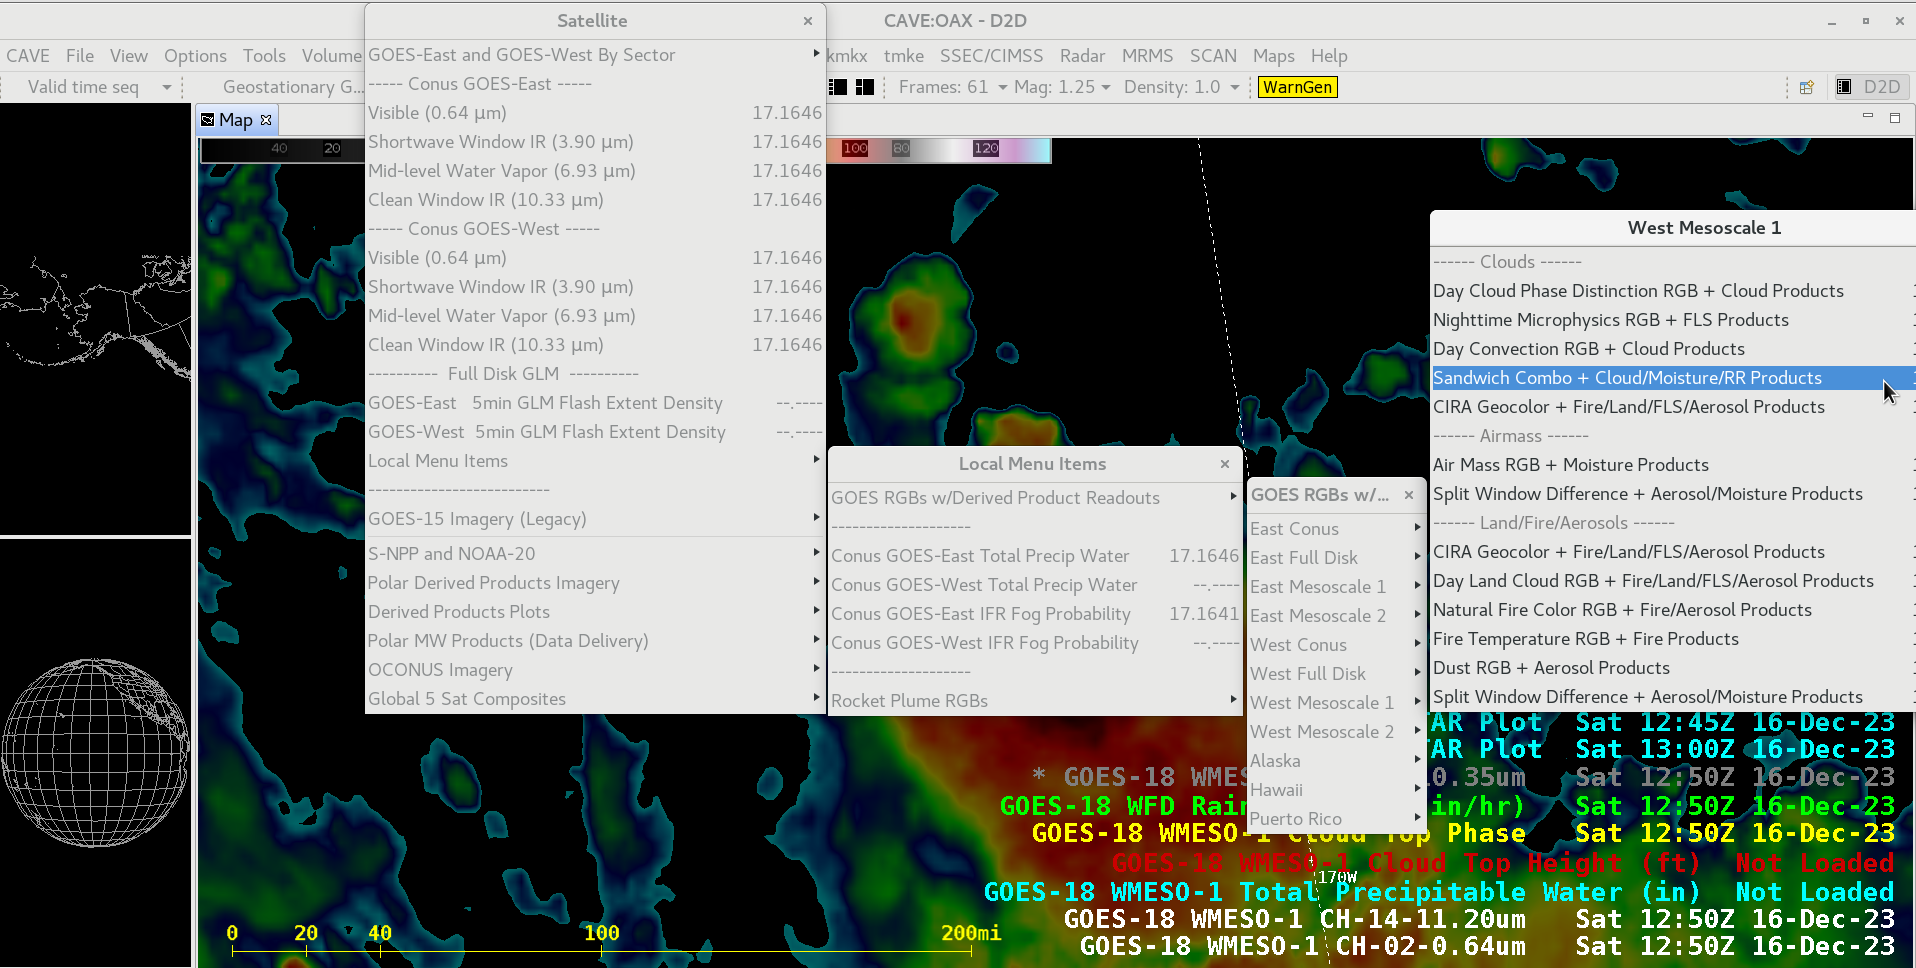
GOES RGBs with Level 2 Derived Product Readouts menu structure [click to enlarge]
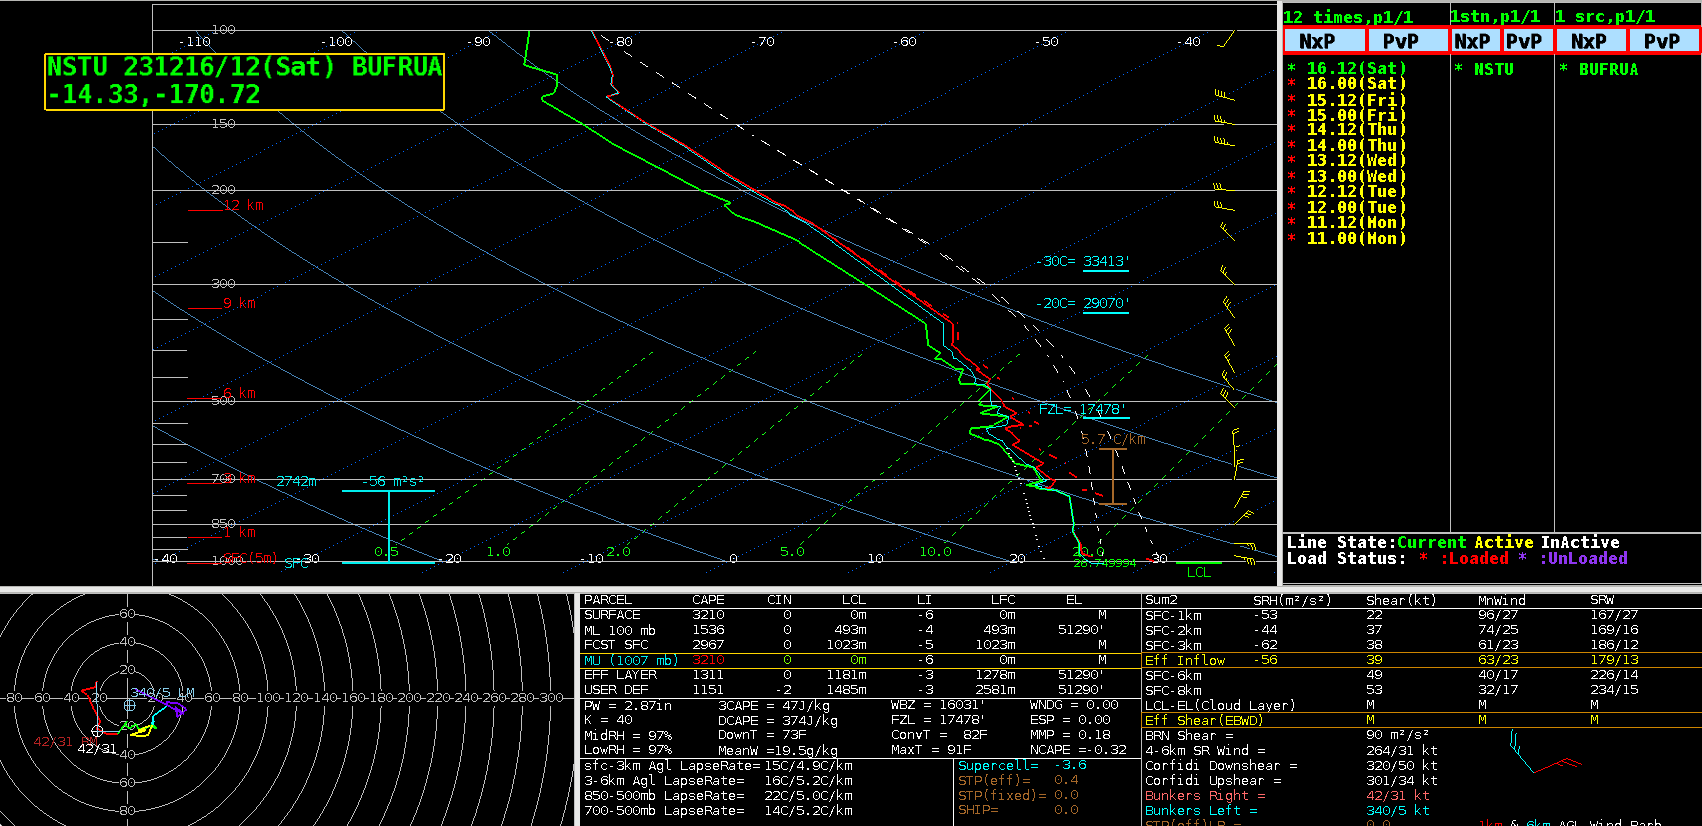
Plot of NSTU rawinsonde data at 1200 UTC on 16 December [click to enlarge]
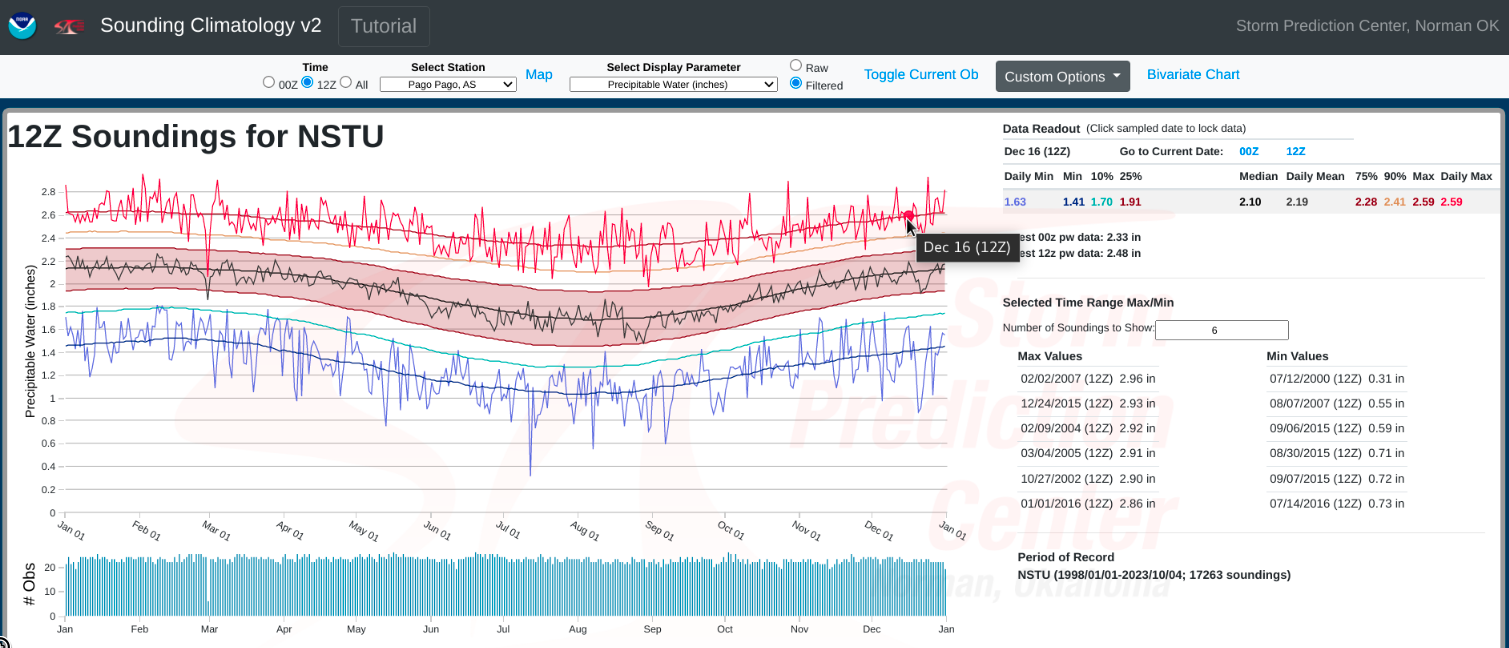
Climatology of Total Precipitable Water for NSTU rawinsonde reports at 12 UTC [click to enlarge]
MIMIC TPW images, from 0000 UTC on 13 December to 2300 UTC on 16 December [click to play animated GIF | MP4]