An airmass change at Guam
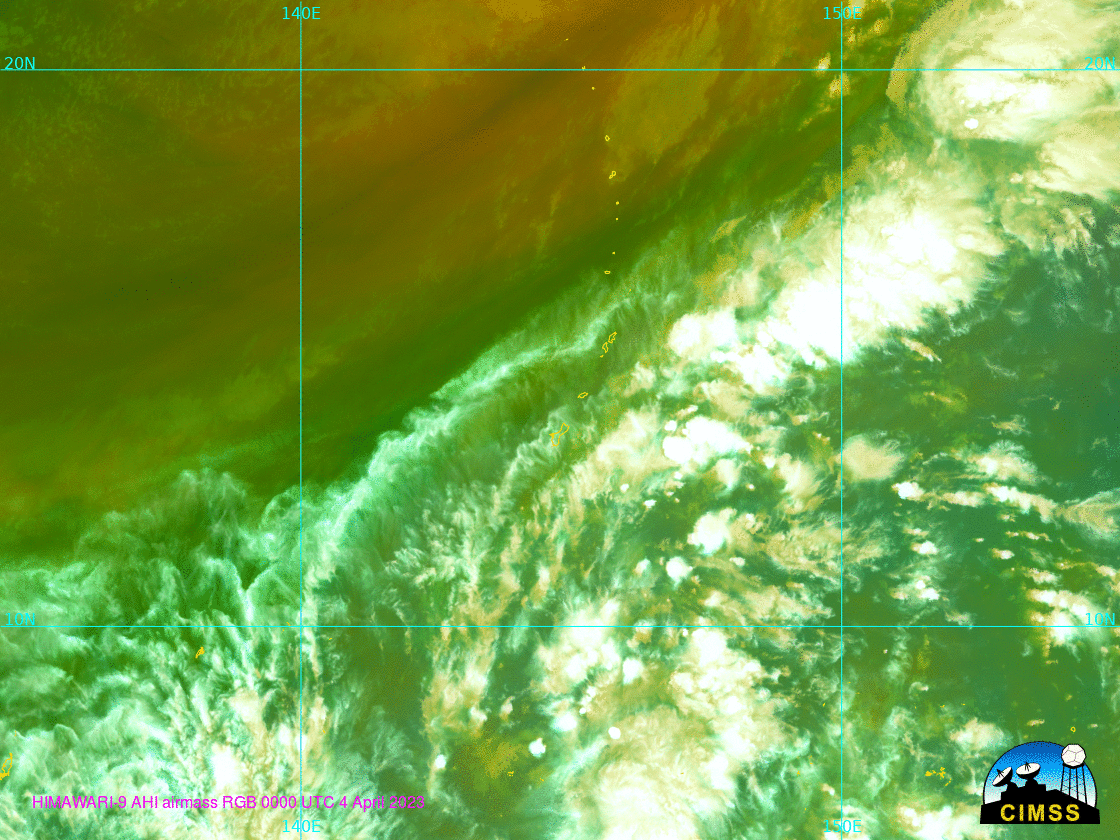
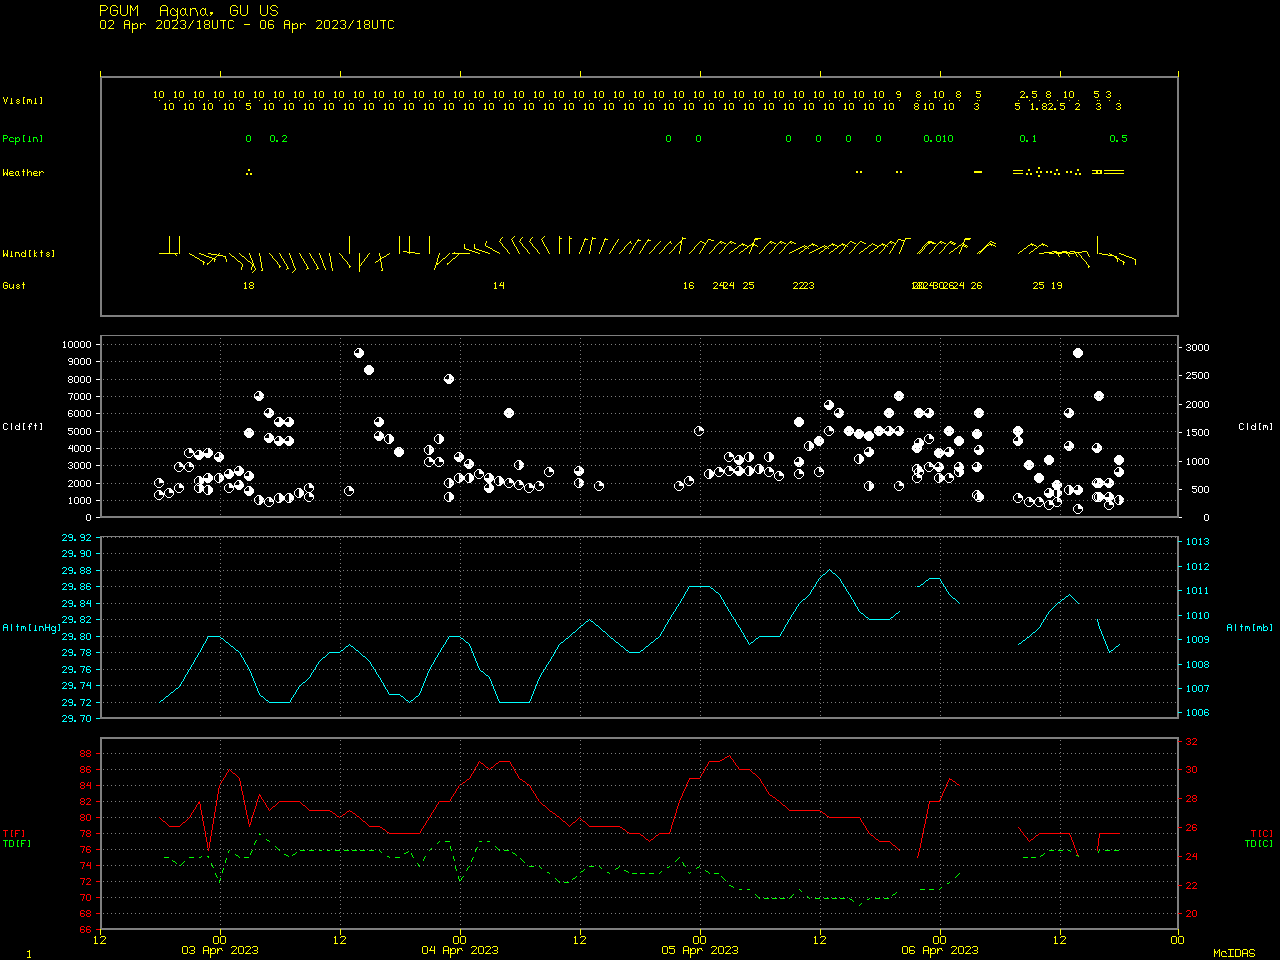
Himawari-9 Airmass RGB imagery, below, from 0000 on 4 April through 1200 UTC on 6 April 2023 (created using geo2grid) show a transition from a deep tropical airmass (deep green in the RGB with embedded clouds that are white) over the southern Marianas islands to one that is a bit dryer (more orange in the RGB). A meteorogram for the A. B. Won Pat International Airport on Guam, below, shows the transition that started around 1800 UTC on 4 April. In particular, the pressure increased from 1008 mb to around 1010 mb; winds shifted to northeast and then east (and strengthened); dewpoint temperatures dropped a couple degrees (oF). Guam is at 13.4° N; this airmass penetrated very deep into the tropics.
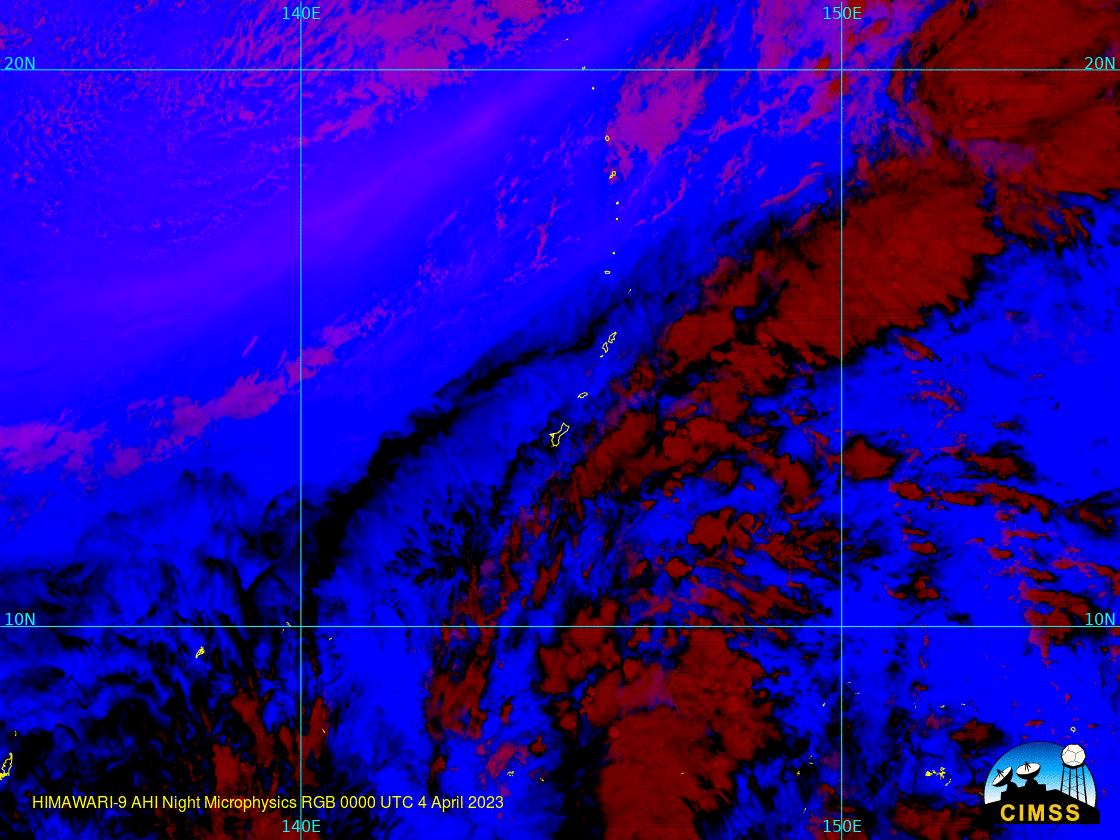
What other satellite products showed this change? The Night Microphysics RGB, below, also shows a boundary moving south over the southern Marianas islands. As with the airmass RGB above, the boundary does not appear to move very far south of Guam.
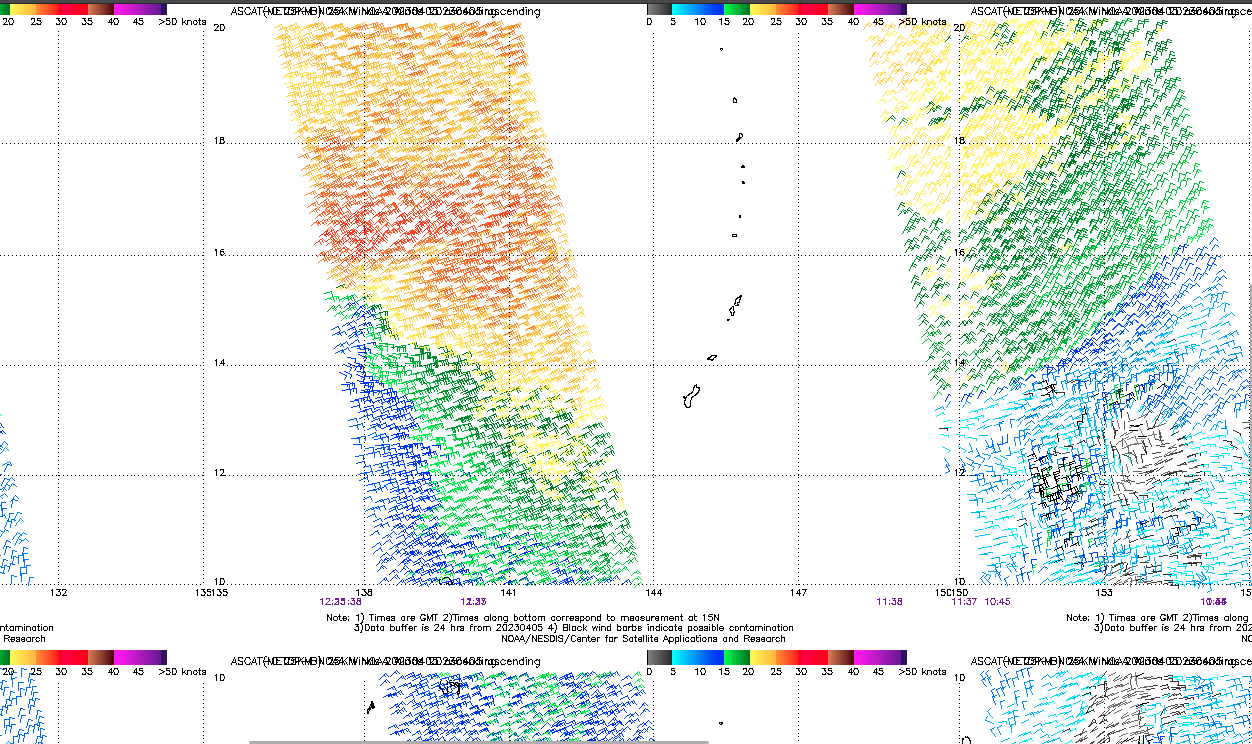
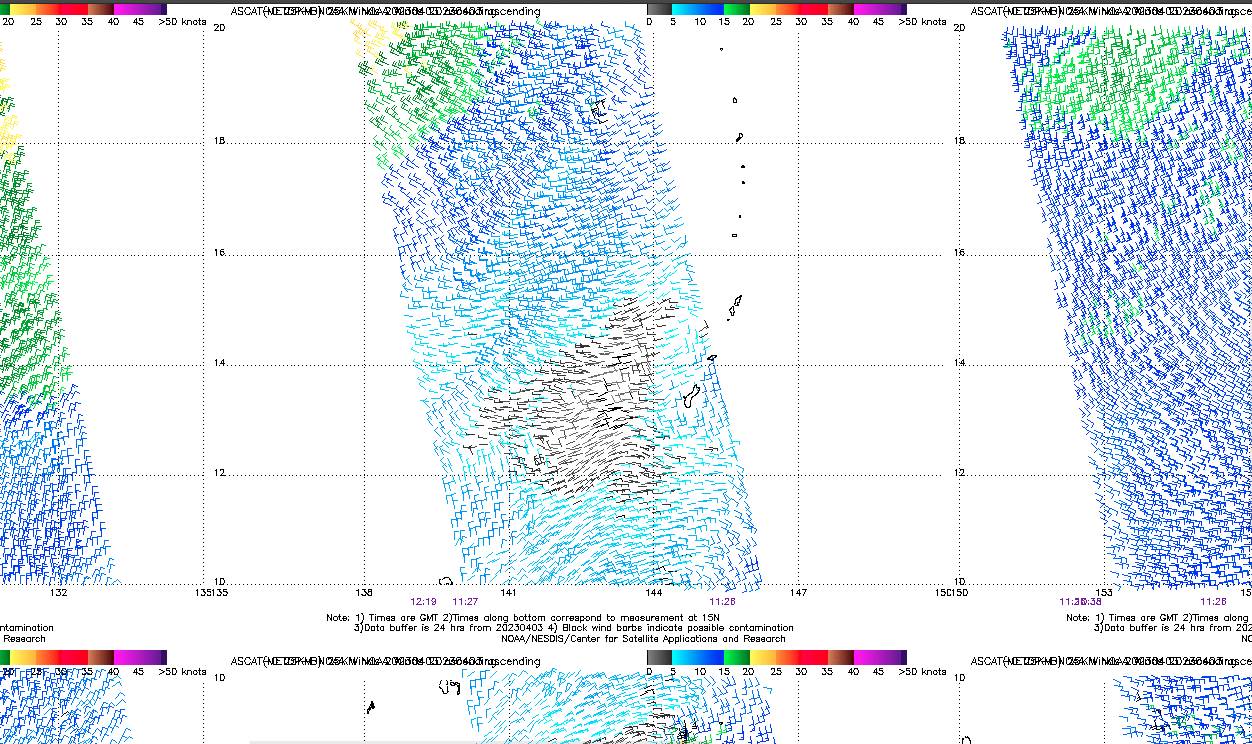
Advanced Scatterometer (ASCAT) imagery from MetopB and MetopC (originally from this website, and combined into one image at this website that shows the most recent 1-week animation) also shows the expansion southward of strong northeasterly winds. On 3 April 2023, winds around Guam are light from the east or southeast. By 5 April 2023, strong northeasterly winds have expanded southward over the Marianas Islands.
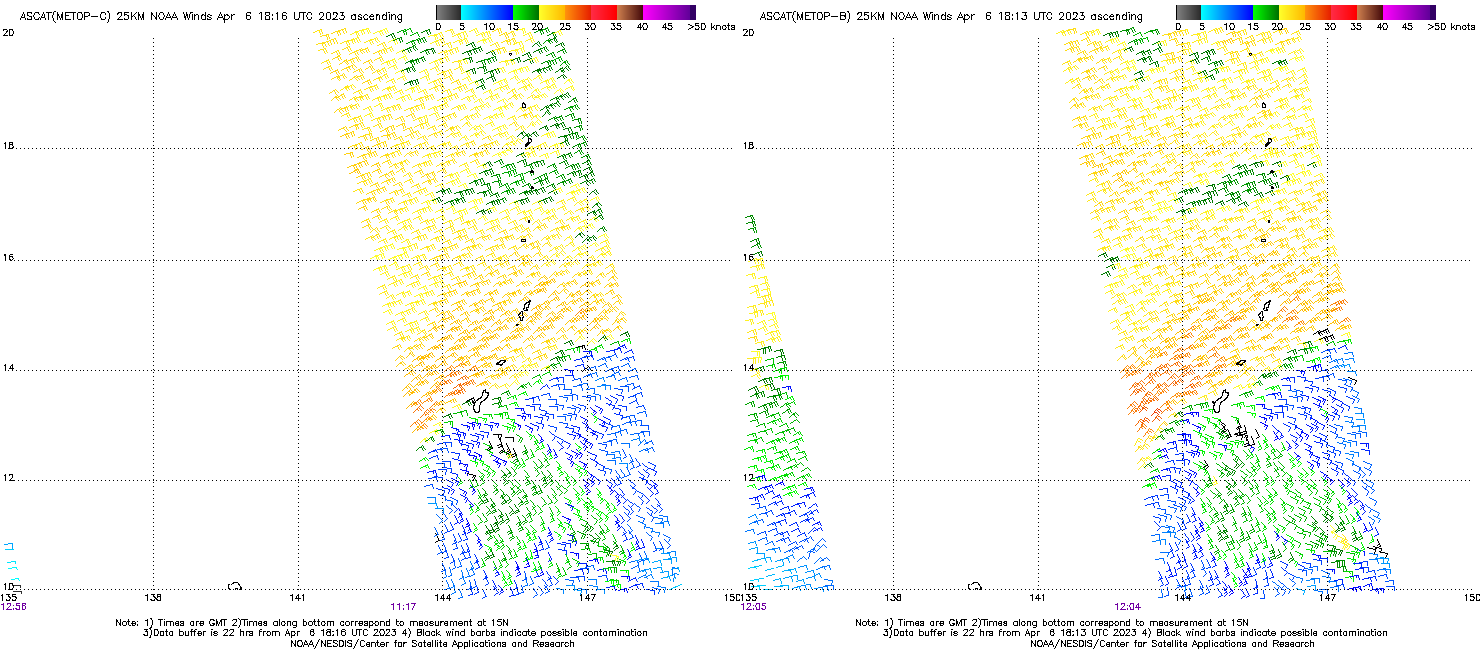
ASCAT winds ca. 1200 UTC on 6 April 2023, shown below, indicate strong convergence over Guam.
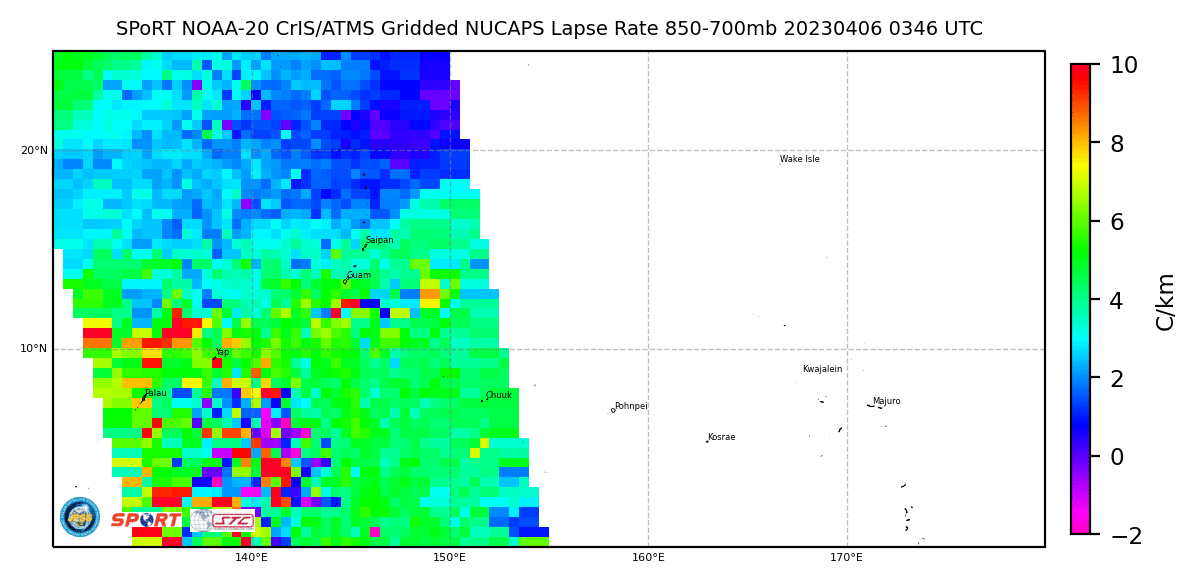
Gridded NUCAPS fields (available at this site) also show the stark differences across the Marianas Islands from north to south. The animation below shows 850-700 mb lapse rates (more stable over the northern Marianas), 400-200 mb lapse rates (more stable over the northern Marianas), Total Precipitable water (dryer over the northern Marianas) and 850-mb Temperatures (cooler over the northern Marianas). NUCAPS data can give very useful information within data voids (like the Western Pacific Ocean!)
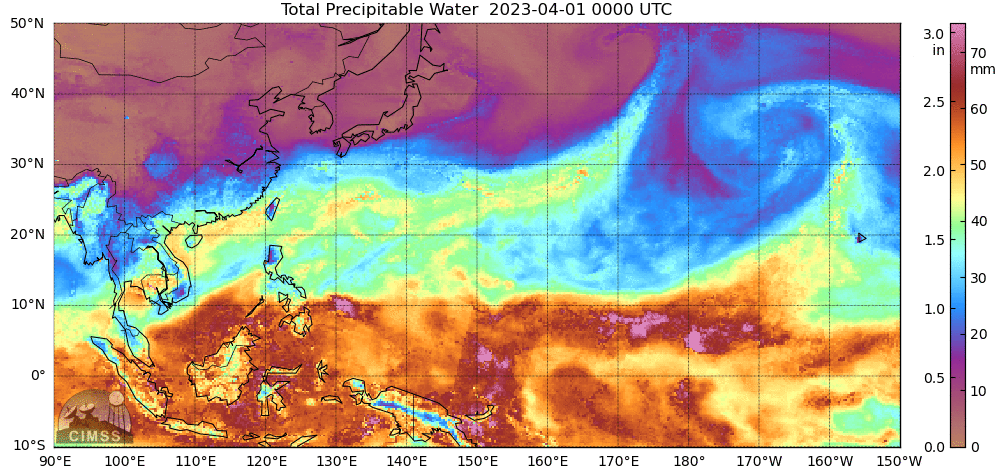
MIMIC Total Precipitable Water fields over the western Pacific Ocean (from this site and archived here), below, from 0000 UTC on 1 April through 1200 UTC 6 April, show the dramatic southward motion of dry air over the northern Marianas that extend northeastward from Guam (at 13.4° N, 144.8° E).
Sandwich product imagery from this JMA website (scraped daily), below, shows parts of the western Pacific from 0000 UTC on 1 April through 5 April 2023. The storm responsible for dragging a front across the Marianas is apparent in the imagery starting around 3 April.