Hurricane Sally
GOES-16 Clean Window Infrared (10.3 µm) Imagery over Sally, 1113 – 1312 UTC 14 September 2020. GLM Flash Density (1-minute observations) are also plotted (Click to animate)
Hurricane Sally was moving very slowly in the north-central Gulf of Mexico at sunrise on 15 September 2020. A GOES-16 Mesoscale sector placed over the storm allowed for 1-minute imagery, and the Clean Infrared window animation, above, for the 2 hours centered on Sunrise, show a compact storm south of Mobile Bay and east of the Mississippi River delta. Geostationary Lightning Mapper (GLM) data overlain on the ABI imagery show active lightning in a feeder band to the east of the storm, but little lightning in the storm center.

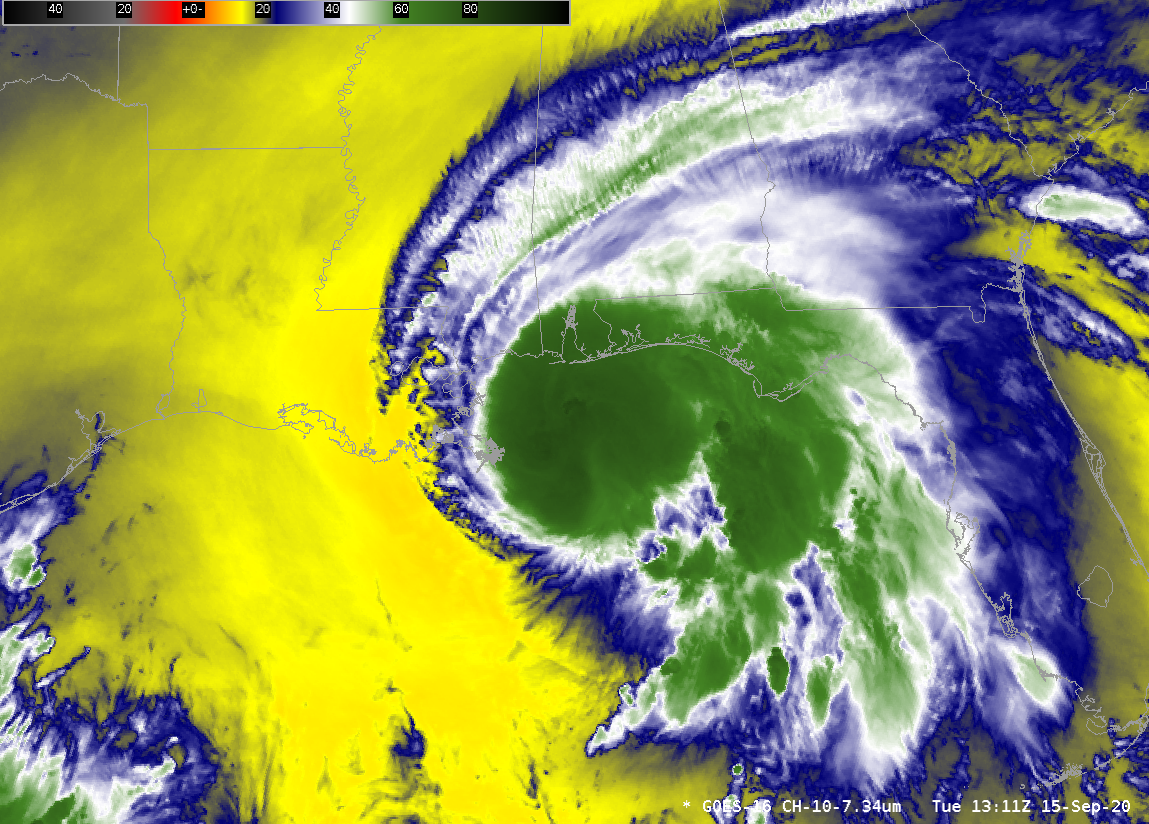
GOES-16 Upper Level (6,19 µm) and Lower Level (7.34 µm) water vapor imagery, 1311 UTC on 15 September 2020 (Click to enlarge)
Intensification of Sally has been affected by dry air near the storm (as mentioned in this discussion, for example). The toggle above of GOES-16 infrared upper-level and lower-level water vapor imagery (observed at 6.19 µm and 7.34 µm, respectively), shows warm brightness temperatures to the west of the storm. These warm temperatures (yellow in the 7.34 µm image, blue in the 6.19 µm image) are regions of mid-level dryness: the top of the moist layer is farther down in the atmosphere in these regions.
Morphed microwave imagery, below, (from this site), shows the effect of dry air on the storm structure. The eyewall almost forms — but it is eroded along its southern edge by dry air.
Morphed Microwave imagery following the center of Hurricane Sally for the 24 hours ending 1300 UTC on 15 September (Click to enlarge)
The 1200 UTC MIMIC Total Precipitable Water (TPW) field, below (from this site) suggests that dryer Continental air might be affecting the storm. Advected Layer Precipitation Water from 1200 UTC (here, from this site), tells a similar tale.
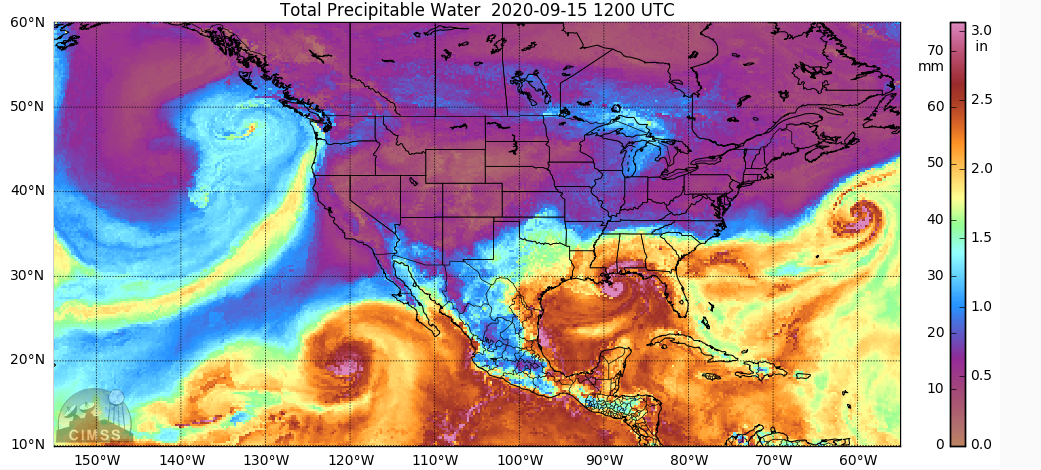
Microwave-derived Total Precipitable Water, 1200 UTC on 15 September 2020 (Click to enlarge)
Visible imagery, below, at sunrise shows a thick clouds over the center of the storm. The appearance is similar to yesterday’s. A visible animation (from 1130-1313 UTC) without the GLM overlay is available here.
GOES-16 visible imagery (0.64 µm) with 1-minute GLM Flash Density overlain, 1145 – 1311 UTC 15 September (Click to animate)
===== 21 UTC Update =====
![GOES-16 “Red” Visible (0.64 µm) and “Clean” Infrared Window (10.35 µm) images (with and without an overlay of GLM Flash Extent Density) [click to play animation | MP4]](https://cimss.ssec.wisc.edu/satellite-blog/images/2020/09/200915_goes16_infrared_glmFlashExtentDensity_visible_Hurricane_Sally_anim.gif)
GOES-16 “Red” Visible (0.64 µm) and “Clean” Infrared Window (10.35 µm) images (with and without an overlay of GLM Flash Extent Density) [click to play animation | MP4]
A toggle between Suomi NPP VIIRS Visible (0.64 µm) and Infrared Window (11.45 µm) images (below) showed Sally at 1806 UTC. The coldest cloud-top infrared brightness temperature northwest of the eye was -86ºC.
![Suomi NPP VIIRS Visible (0.64 µm) and Infrared Window (11.45 µm) images at 1806 UTC [click to enlarge]](https://cimss.ssec.wisc.edu/satellite-blog/images/2020/09/200915_1806utc_suomiNPP_viirs_visible_infrared_Hurricane_Sally_anim.gif)
Suomi NPP VIIRS Visible (0.64 µm) and Infrared Window (11.45 µm) images at 1806 UTC [click to enlarge]