Intense central US midlatitude cyclone
![GOES-16 Air Mass RGB images [click to play animation | MP4]](https://cimss.ssec.wisc.edu/satellite-blog/wp-content/uploads/sites/5/2019/03/190313_goes16_airmassRGB_Plains_cyclone_anim.gif)
GOES-16 Air Mass RGB images [click to play animation | MP4]
On a map of NWS warnings/advisories valid at 14 UTC (below), Blizzard Warnings (red) extended from Colorado to the US/Canada border. South of the Blizzard Warnings, High Wind Warnings (brown) were in effect to the US/Mexico border.
![Map of NWS warnings and advisories at 14 UTC [click to enlarge]](https://cimss.ssec.wisc.edu/satellite-blog/wp-content/uploads/sites/5/2019/03/190313_14utc_nws_warnings_advisories.png)
Map of NWS warnings and advisories at 14 UTC [click to enlarge]
![GOES-16 Mid-level Water Vapor (6.9 µm) images [click to play animation | MP4]](https://cimss.ssec.wisc.edu/satellite-blog/wp-content/uploads/sites/5/2019/03/190313_goes16_waterVapor_windGusts_Plains_cyclone_anim.gif)
GOES-16 Mid-level Water Vapor (6.9 µm) images [click to play animation | MP4]
![MIMIC Total Precipitable Water product [click to play animation | MP4]](https://cimss.ssec.wisc.edu/satellite-blog/wp-content/uploads/sites/5/2019/03/190312_190313_mimicTPW_anim.gif)
MIMIC Total Precipitable Water product [click to play animation | MP4]
![GOES-16 "Red" Visible (0.64 µm) and Split Window Difference images [click to play animation | MP4]](https://cimss.ssec.wisc.edu/satellite-blog/wp-content/uploads/sites/5/2019/03/190313_goes16_visible_splitWindowDifference_NM_TX_blowing_dust_anim.gif)
GOES-16 “Red” Visible (0.64 µm) and Split Window Difference images [click to play animation | MP4]
![GOES-16 True Color RGB images [click to play animation | MP4]](https://cimss.ssec.wisc.edu/satellite-blog/wp-content/uploads/sites/5/2019/03/190313_goes16_truecolor_Plains_cyclone_anim.gif)
GOES-16 True Color RGB images [click to play animation | MP4]
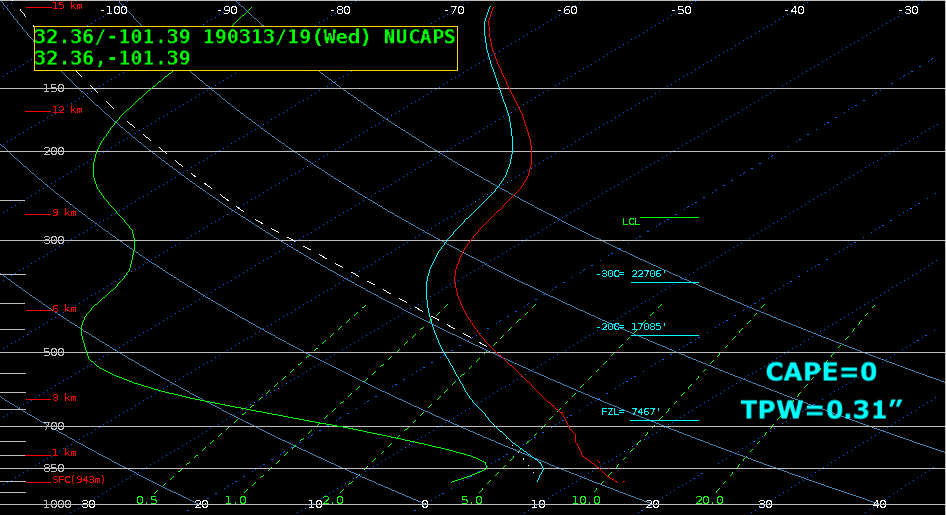
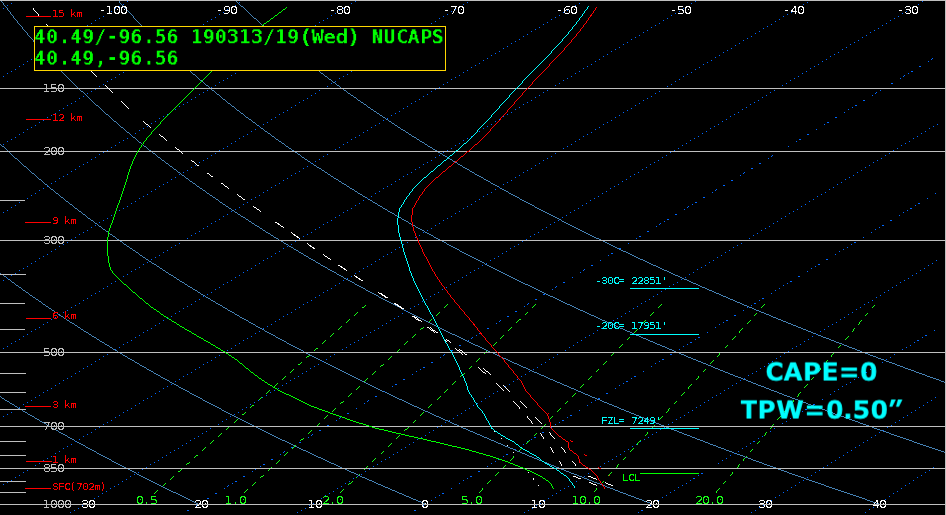
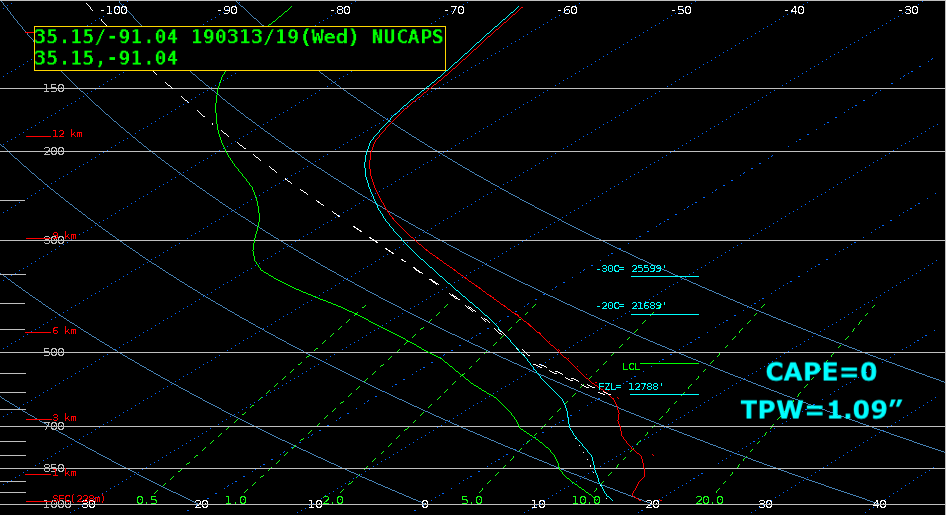
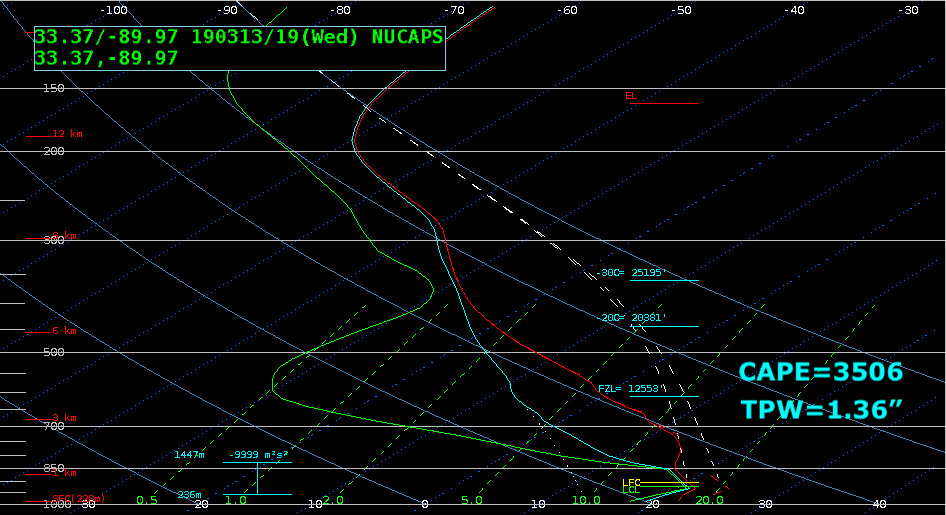
![Suomi NPP VIIRS Visible (0.64 µm) image, with overlays of the surface analysis and available NUCAPS soundings [click to enlarge]](https://cimss.ssec.wisc.edu/satellite-blog/wp-content/uploads/sites/5/2019/03/bomb_viirs_visible_nucaps-20190313_185912_anim.gif)
Suomi NPP VIIRS Visible (0.64 µm) image, with overlays of the surface analysis and available NUCAPS soundings [click to enlarge]
GOES-17 “Clean” Infrared Window (10.3 µm) images, with plots of SPC storm reports [click to play animation | MP4]
A Great Plains cyclone of historic proportions is now underway across the central U.S. Here’s the latest… pic.twitter.com/CLAsDmmOkZ
— NWS WPC (@NWSWPC) March 13, 2019
Powerful low in the Central Plains with widespread significant wind gusts. Over the past 24 hours, NWS offices logged about 350 wind gust reports of 50+ MPH, with a further 92 reports of damage. The most significant gusts (70+ MPH) generally in NE NM, TX Panhandle, E CO. pic.twitter.com/duCPfqdkII
— NWS WPC (@NWSWPC) March 14, 2019
===== 14 March Update =====
![GOES-16 Mid-level Water Vapor (6.9 µm) images, with hourly plots of surface winds and gusts in knots [click to play animation | MP4]](https://cimss.ssec.wisc.edu/satellite-blog/wp-content/uploads/sites/5/2019/03/190314_goes16_waterVapor_windGusts_Plains_cyclone_anim.gif)
GOES-16 Mid-level Water Vapor (6.9 µm) images, with hourly plots of surface winds and gusts in knots [click to play animation | MP4]
Farther to the east, severe thunderstorms produced large hail, damaging winds and tornadoes as far north as northern Illinois/Indiana/Ohio and southern Lower Michigan (SPC storm reports | NWS Detroit) — as shown with 1-minute Mesoscale Domain Sector GOES-16 Visible images (below). The corresponding GOES-16 Infrared image animation is available here; the coldest cloud-top infrared brightness temperatures were only in the -30 to -40ºC range
![GOES-16 "Red" Visible (0.64 µm) Visible images, with SPC storm reports plotted in red [click to play MP4 animation]](https://cimss.ssec.wisc.edu/satellite-blog/wp-content/uploads/sites/5/2019/03/G16_VIS_IL_IN_MI_SVR_14MAR2019_2019073_230327_GOES-16_0001PANEL.GIF)
GOES-16 “Red” Visible (0.64 µm) Visible images, with SPC storm reports plotted in red [click to play MP4 animation]