Snowfall in Texas and Oklahoma

GOES-16 “Red” Visible (0.64 µm) images, with hourly plots of surface reports [click to play animation | MP4]
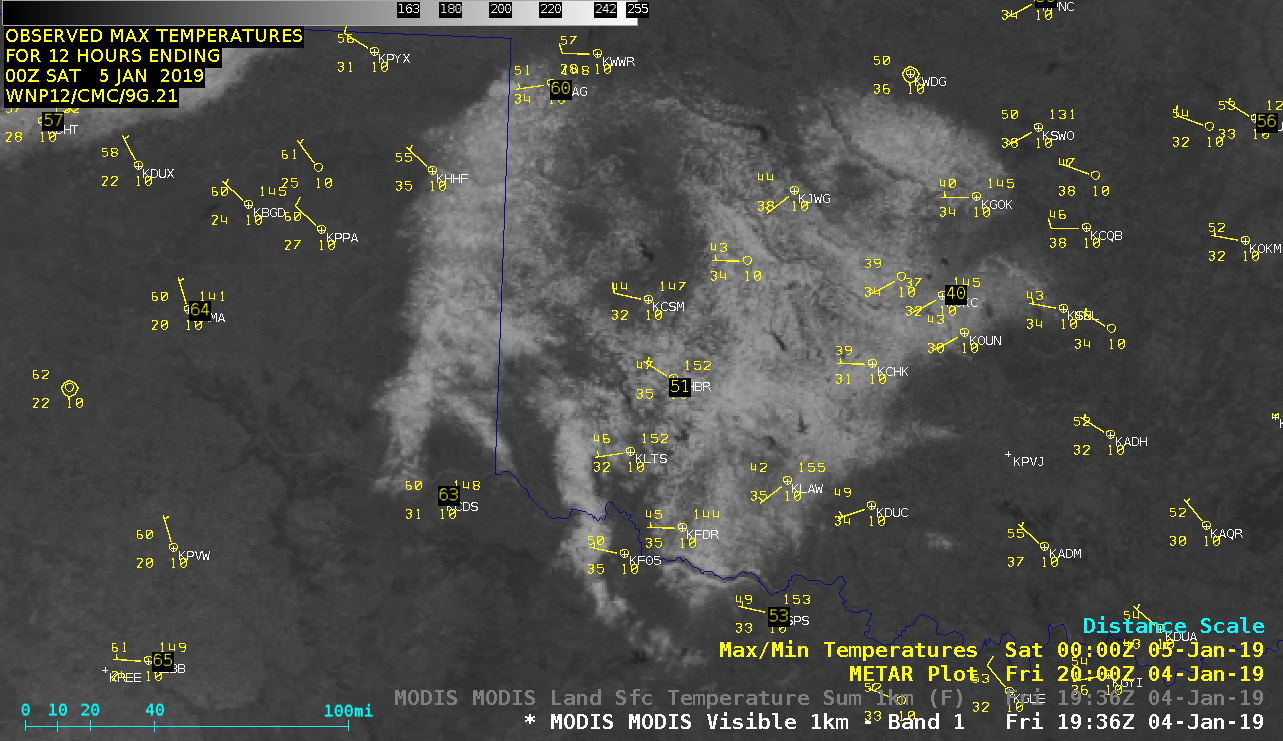
In a comparison between Terra and Aqua MODIS Visible (0.65 µm) images and the corresponding Land Surface Temperature product at 1757 and 1936 UTC (below), LST values in the 30s F (darker shades of blue) were 20ºF colder over the snow cover than over adjacent bare ground in Oklahoma, and 35-40ºF colder than the more sparsely-vegetated bare ground in Texas. By increasing the surface albedo, the snow cover acted to suppress daily maximum temperatures by several degrees.
![Terra and Aqua MODIS Visible (0.65 µm) image and Land Surface Temperature product at 1757 an 1936 UTC [click to enlarge]](https://cimss.ssec.wisc.edu/satellite-blog/wp-content/uploads/sites/5/2019/01/190104_1757utc_1936utc_modis_visible_landSurfaceTemperature_TX_OK_anim.gif)
Terra and Aqua MODIS Visible (0.65 µm) image and Land Surface Temperature product at 1757 an 1936 UTC [click to enlarge]
===== 05 January Update =====
![GOES-16 "Red" Visible (0.64 µm) images, 04 and 05 January [click to play animation | MP4]](https://cimss.ssec.wisc.edu/satellite-blog/wp-content/uploads/sites/5/2019/01/190104_190105_goes16_visible_TX_OK_snowmelt_anim.gif)
GOES-16 “Red” Visible (0.64 µm) images with hourly plots of surface reports, 04 and 05 January [click to play animation | MP4]
A toggle between NOAA-20 VIIRS True Color Red-Green-Blue (RGB) images on 04 and 05 January as viewed using RealEarth (below) provided a higher-resolution view of the snow cover just after 1 PM local time on those two days.
![NOAA-20 VIIRS True Color RGB images on 04 and 05 January [click to enlarge]](https://cimss.ssec.wisc.edu/satellite-blog/wp-content/uploads/sites/5/2019/01/190104_190105_noaa20_viirs_truecolor_TX_OK_snowcover_anim.gif)
NOAA-20 VIIRS True Color RGB images on 04 and 05 January [click to enlarge]