Day 7 of the Thomas Fire in Southern California
![GOES-15 Shortwave Infrared (3.9 µm) images, with hourly surface reports plotted in yellow [click to play MP4 animation]](https://cimss.ssec.wisc.edu/satellite-blog/wp-content/uploads/sites/5/2017/12/960x1280_WESTL_B2_GOES15_SOCAL_FIRES_10DEC2017_2017344_195700_0001PANEL.GIF)
GOES-15 Shortwave Infrared (3.9 µm) images, with hourly surface reports plotted in yellow [click to play MP4 animation]
A sequence of 4 Shortwave Infrared images from Terra MODIS and Suomi NPP VIIRS (below) showed the westward and northwestward expansion of the fire during the 0637 to 2032 UTC period. The Thomas fire has now burned 230,000 acres, making it the fifth largest wildfire on record in California.
![Terra MODIS and Suomi NPP VIIRS Shortwave Infrared images, with corresponding surface reports plotted in cyan [click to enlarge]](https://cimss.ssec.wisc.edu/satellite-blog/wp-content/uploads/sites/5/2017/12/171210_modis_viirs_ShortwaveInfrared_SoCal_fires_anim.gif)
Terra MODIS and Suomi NPP VIIRS Shortwave Infrared images, with corresponding surface reports plotted in cyan [click to enlarge]
![Terra MODIS true-color and false-color images [click to enlarge]](https://cimss.ssec.wisc.edu/satellite-blog/wp-content/uploads/sites/5/2017/12/171210_1846utc_terra_modis_truecolor_falsecolor_anim.gif)
Terra MODIS true-color and false-color images [click to enlarge]
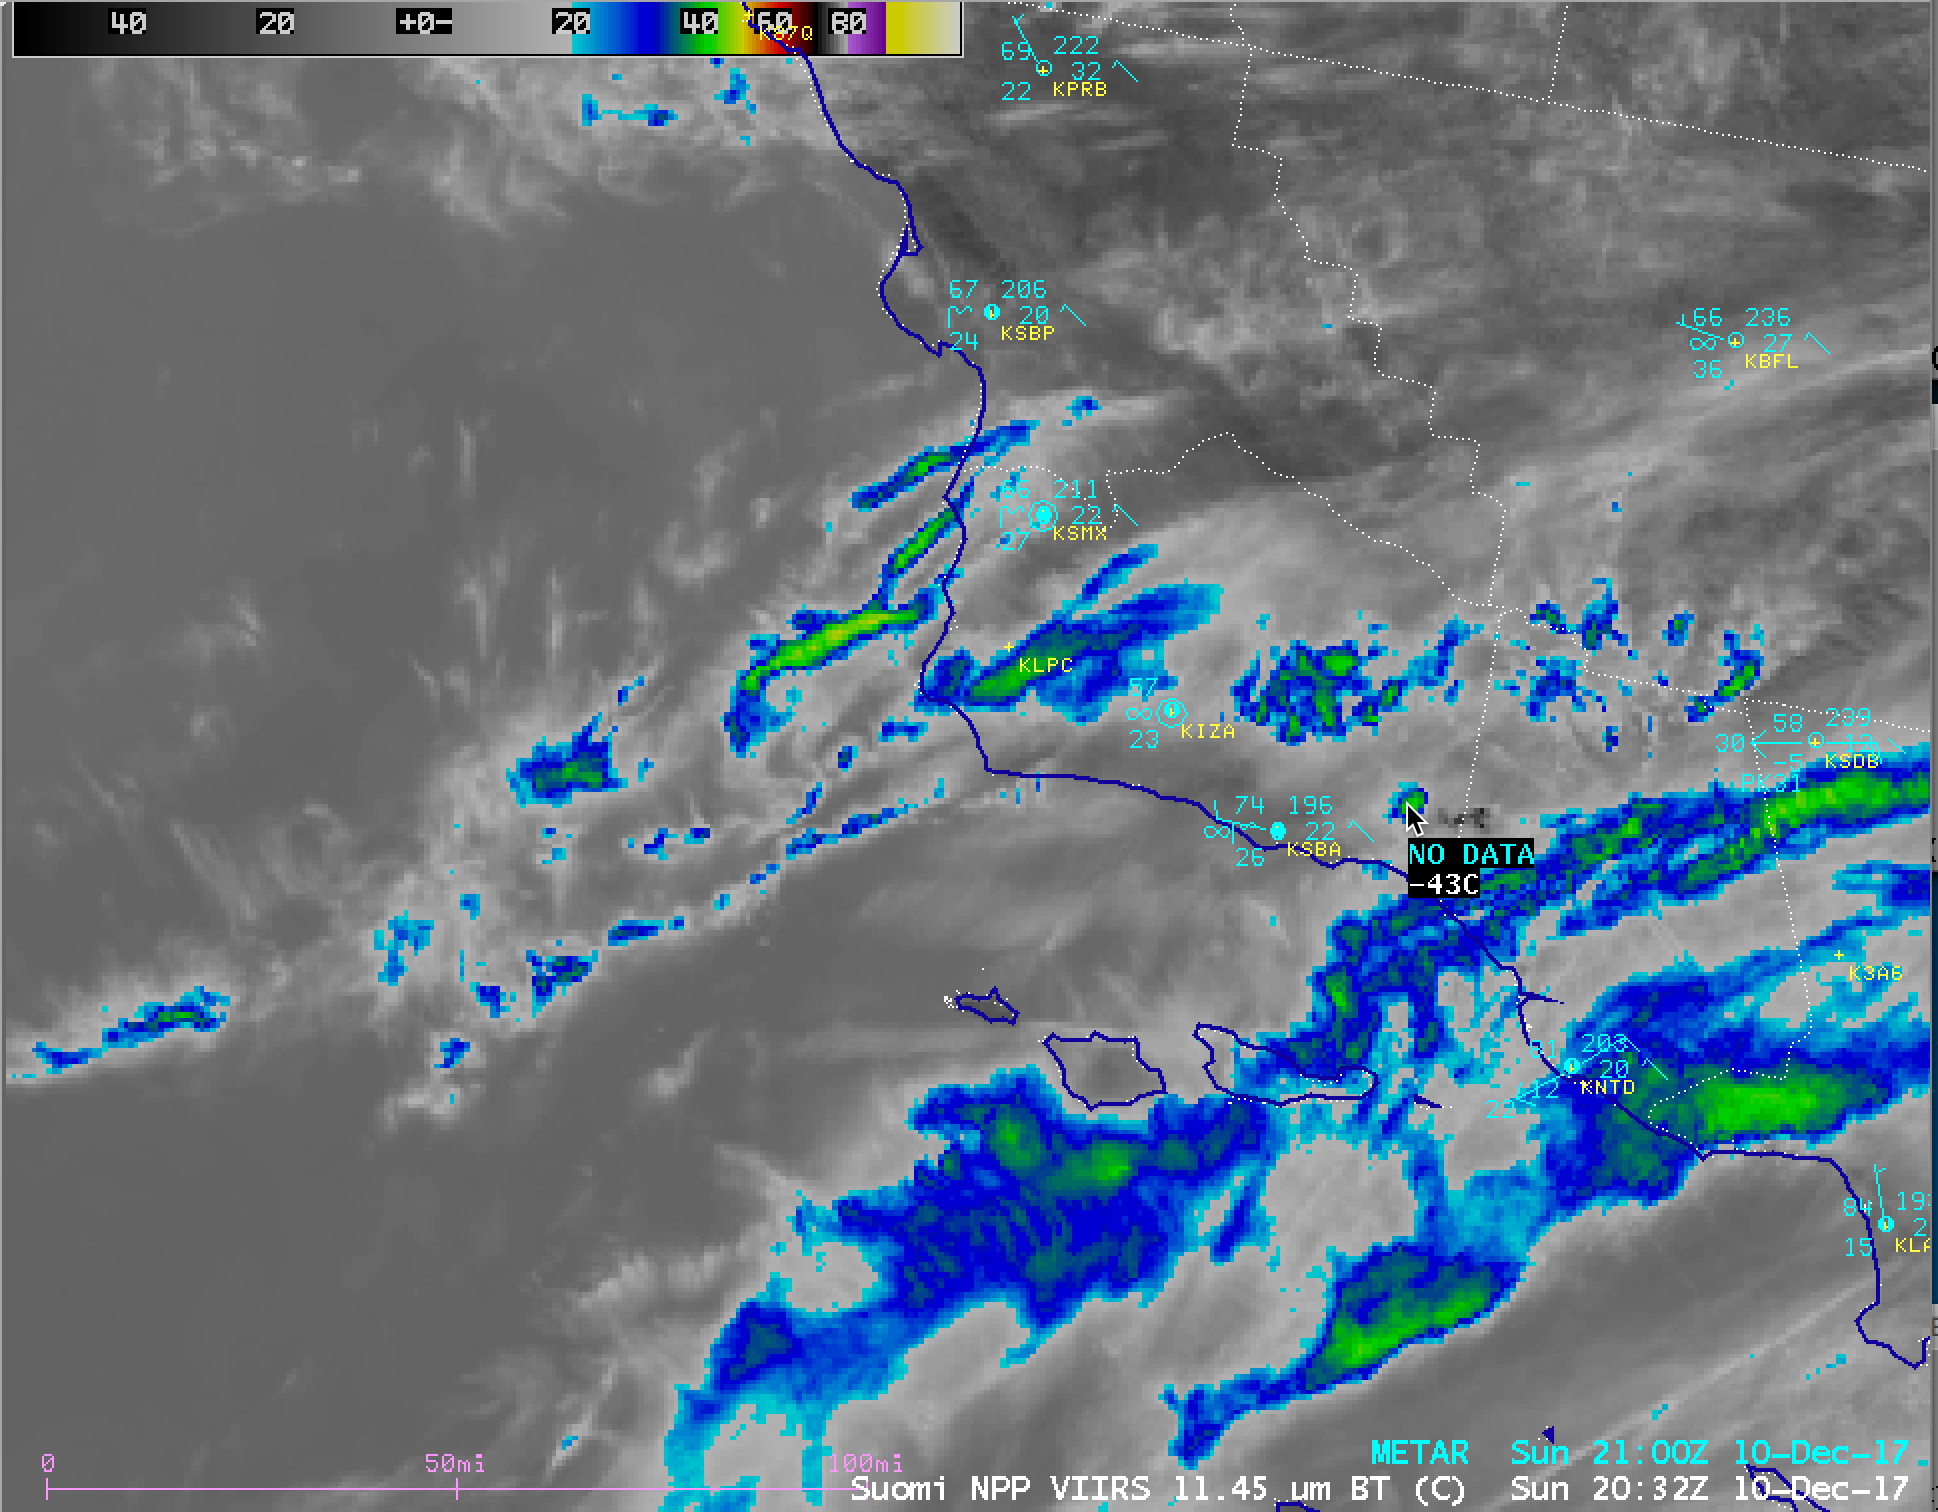
![Suomi NPP VIIRS Visible (0.64 µm), Shortwave Infrared (3.74 µm) and Infrared Window (11.45 µm) images, with surface reports plotted in cyan [click to enlarge]](https://cimss.ssec.wisc.edu/satellite-blog/wp-content/uploads/sites/5/2017/12/171210_2032utc_suomi_npp_viirs_Visible_ShortwaveInfrared_InfraredWindow_SoCal_fires_anim.gif)
Suomi NPP VIIRS Visible (0.64 µm), Shortwave Infrared (3.74 µm) and Infrared Window (11.45 µm) images, with surface reports plotted in cyan [click to enlarge]
Massive imposing smoke from #ThomasFire today. Looking west from Newbury Park. pic.twitter.com/gekRcWcPiO
— Greg Vit (@gvitty) December 10, 2017
#ThomasFire from Thousand Oaks yesterday. pic.twitter.com/DcvLdArGVC
— Art Oleszczuk (@_AutoArt) December 11, 2017
Shown below is a photo taken at 2045 UTC or 12:45 PM local time, from a commercial jet flying into Santa Barbara (courtesy of Henry Dubroff/www.pacbiztimes.com).
![Photo of Thomas Fire pyrocumulus [click to enlarge]](https://cimss.ssec.wisc.edu/satellite-blog/wp-content/uploads/sites/5/2017/12/171210_2045utc_Thomas_Fire_pyrocu.jpg)
Photo of Thomas Fire pyrocumulus [click to enlarge]
![Suomi NPP VIIRS Day/Night Band (0.7 µm), Near-Infrared (1.61 and 2.25 µm), Shortwave Infrared (3.75 and 4.05 µm) and Infrared Window (11.45 µm) images [click to enlarge]](https://cimss.ssec.wisc.edu/satellite-blog/wp-content/uploads/sites/5/2017/12/171211_1035utc_suomi_npp_viirs_DayNightBand_NearInfrared_ShortwaveInfrared_InfraredWindow_SoCal_fires_anim.gif)
Suomi NPP VIIRS Day/Night Band (0.7 µm), Near-Infrared (1.61 and 2.25 µm), Shortwave Infrared (3.75 and 4.05 µm) and Infrared Window (11.45 µm) images [click to enlarge]
GOES-15 Shortwave Infrared (3.9 µm) images (below) showed that once the thicker bands of cirrus clouds moved northwestward away from the region, a more well-defined thermal signature became apparent.
![GOES-15 Shortwave Infrared (3.9 µm) images, with hourly surface reports plotted in yellow [click to play animation]](https://cimss.ssec.wisc.edu/satellite-blog/wp-content/uploads/sites/5/2017/12/960x1280_WESTL_B2_GOES15_SOCAL_FIRES_11DEC2017_2017345_213000_0001PANEL.GIF)
GOES-15 Shortwave Infrared (3.9 µm) images, with hourly surface reports plotted in yellow [click to play animation]
![7-day sequence Nighttime and Daytime composites of Suomi NPP VIIRS Shortwave Infrared (3.74 µm) images [click to play animation]](https://cimss.ssec.wisc.edu/satellite-blog/wp-content/uploads/sites/5/2017/12/171205-11_suomi_npp_viirs_ShortwaveInfrared_Thomas_Fire_CA_anim.gif)
7-day sequence Nighttime and Daytime composites of Suomi NPP VIIRS Shortwave Infrared (3.74 µm) images [click to play animation]