GOES-16 water vapor imagery: wave structures within a dry slot
![GOES-16 Water Vapor images: 6.2 µm (top), 6.9 µm (middle) and 7.4 µm (bottom) [click to play animation]](https://cimss.ssec.wisc.edu/satellite-blog/wp-content/uploads/sites/5/2017/03/170308_goes16_water_vapor_Great_Lakes_dry_slot_waves_anim.gif)
GOES-16 Water Vapor images: 6.2 µm (top), 6.9 µm (middle) and 7.4 µm (bottom) [click to play animation]
(Hat tip to T.J. Turnage, NWS Grand Rapids, for alerting us to this case): A variety of mesoscale wave structures were seen in NOAA GOES-16 Lower-Tropospheric Water Vapor (7.3 µm) and Middle-Tropospheric Water Vapor 6.9 µm images (above; also available as an MP4 animation) within a dry slot along the southern periphery of a trough associated with a large and intense mid-latitude cyclone centered over Hudson Bay, Canada on 08 March 2017. Beneath this dry slot, wind gusts exceeded 60 mph across southern portions of Minnesota, Wisconsin and Lower Michigan as momentum aloft was mixed downward to the surface.
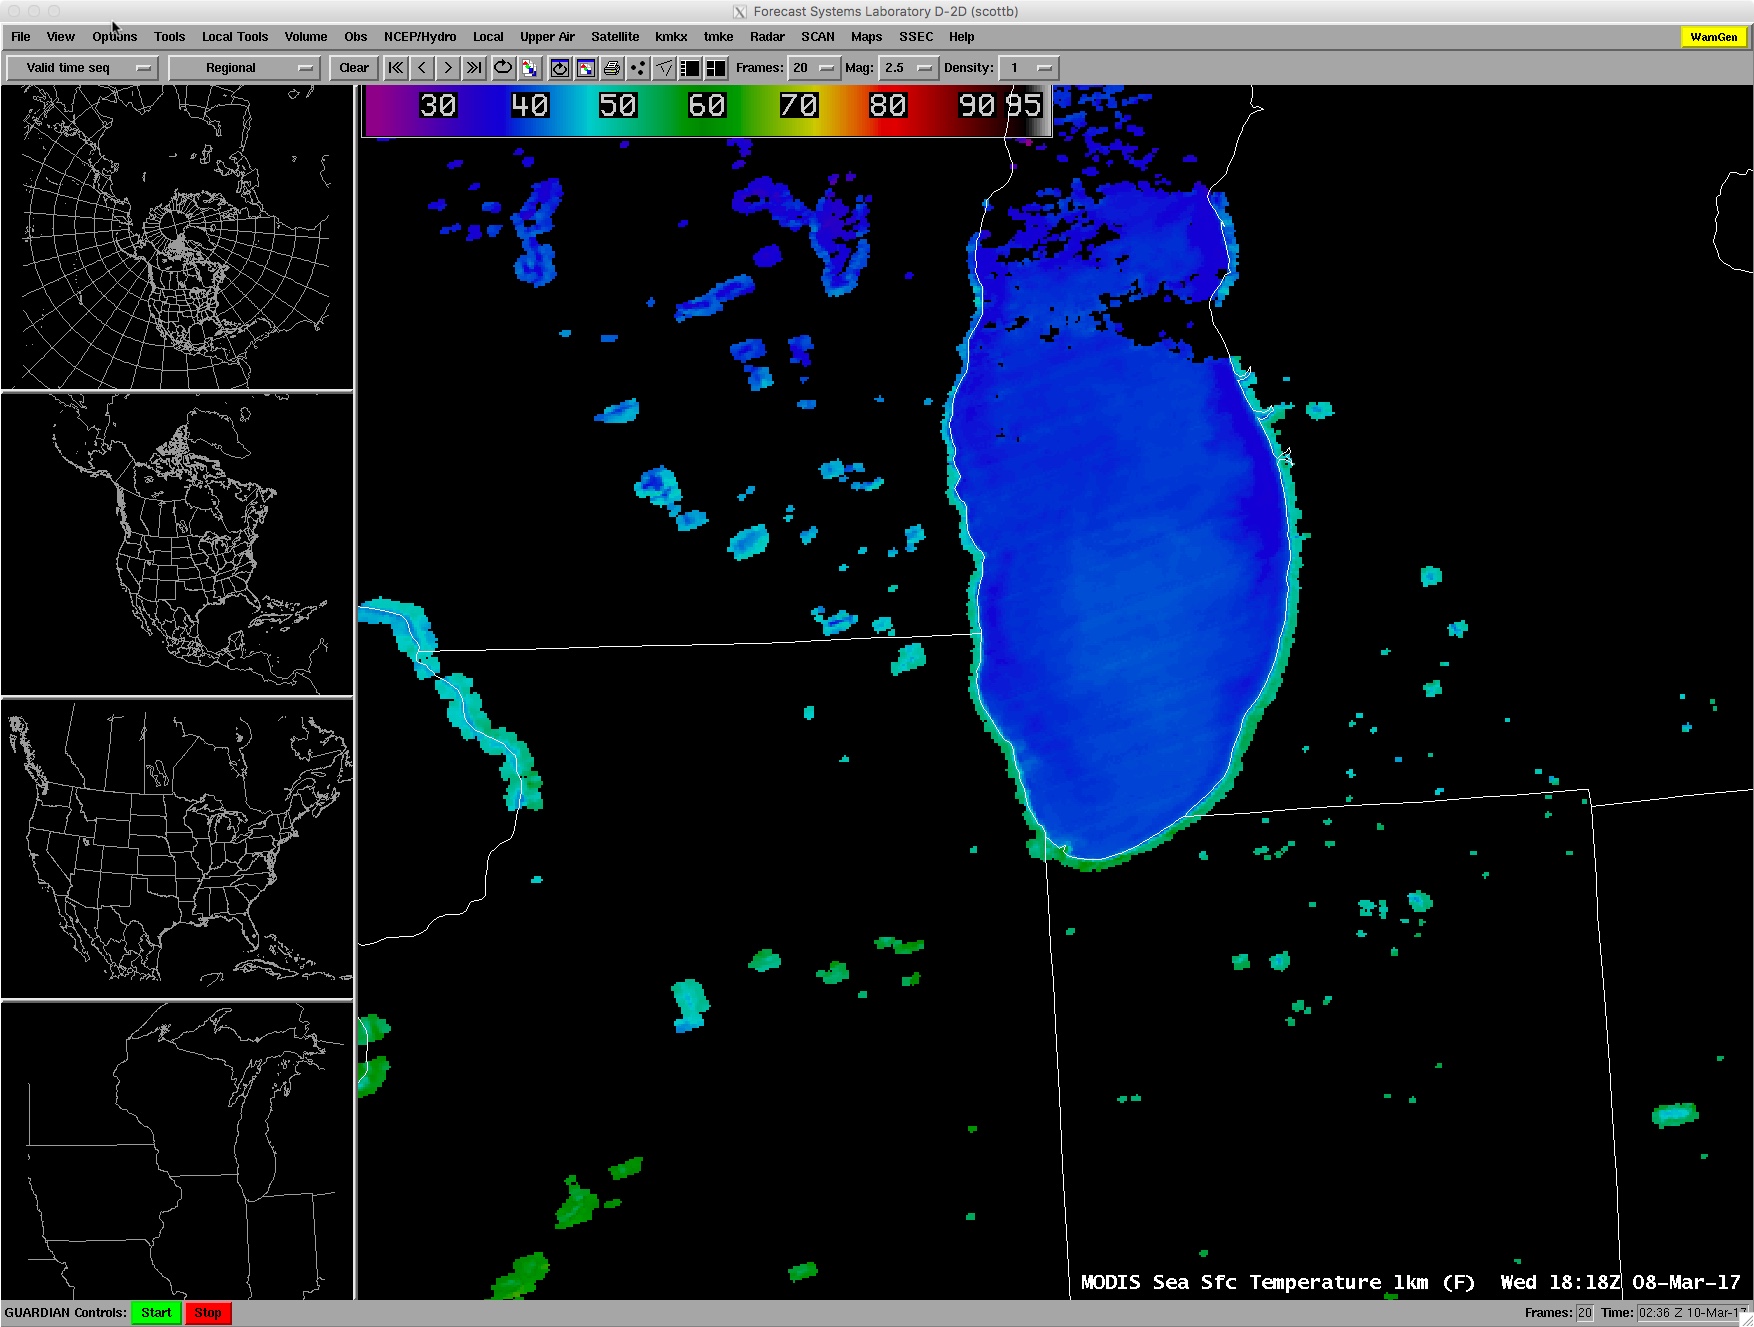
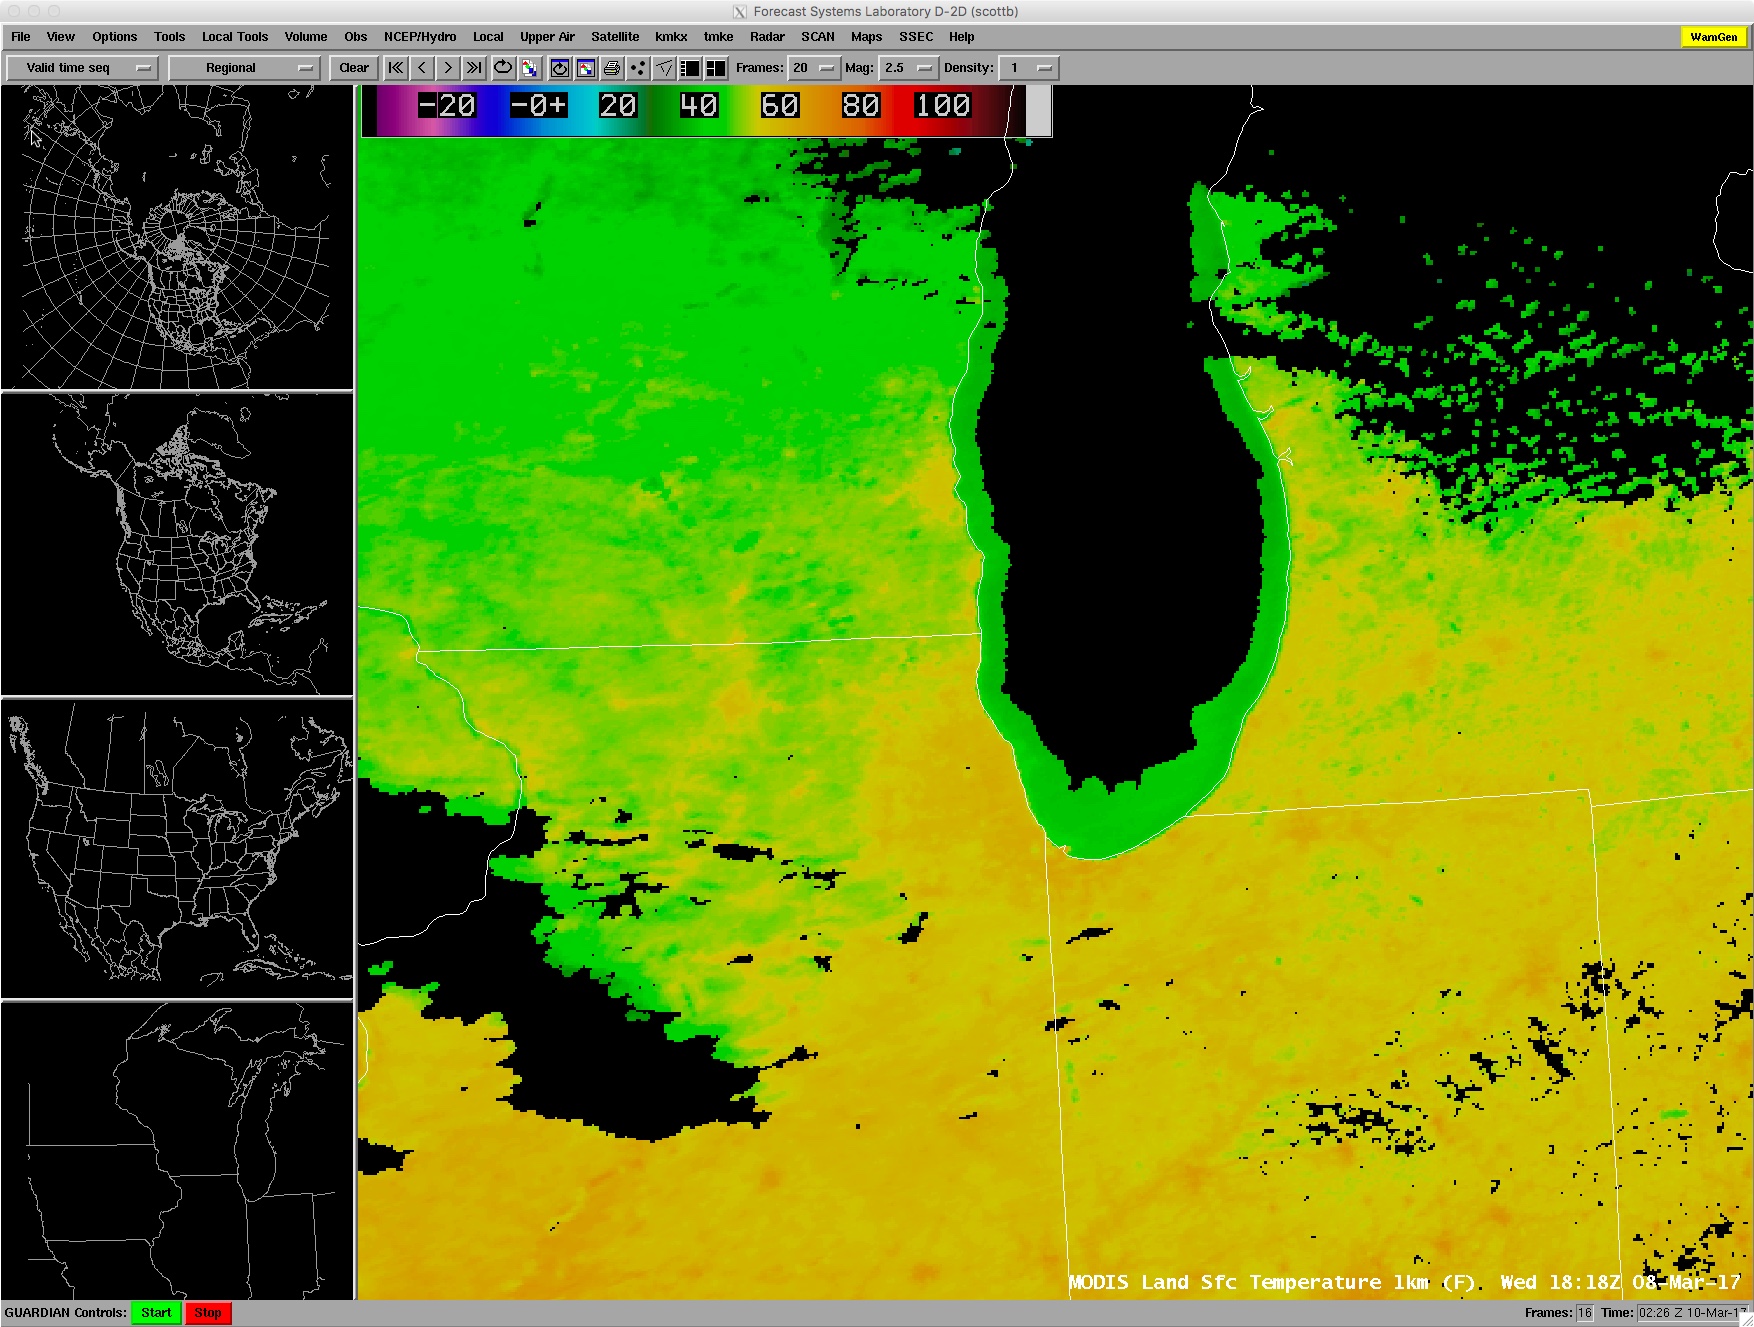
Using the GOES-13 (GOES-East) Sounder water vapor bands as a proxy for the three ABI water vapor bands, weighting functions calculated using 12 UTC rawinsonde data from Chanhassen, Minnesota (below) showed a dramatic downward shift in the weighting function curves (compared to a US Standard Atmosphere) — this meant that the 3 water vapor bands were sensing radiation from layers much closer to the surface on 08 March (where the strong winds could interact with terrain and cause standing waves to form). It is interesting to note that the outline of the southern part of Lake Michigan could be seen on GOES-16 Lower-Tropospheric Water Vapor (7.3 µm) imagery (animated GIF | MP4 animation) — the signal of the thermal contrast between the lake water (MODIS SST values in the upper 30s to low 40s F) and the adjacent land surfaces (MODIS LST values in the middle 50s to low 60s F) was “bleeding up” through what little water vapor was present aloft.
![GOES-13 Sounder water vapor weighting functions: 12 UTC Chanhassen, Minnesota sounding vs US Standard Atmosphere [click to enlarge]](https://cimss.ssec.wisc.edu/satellite-blog/wp-content/uploads/sites/5/2017/03/170308_12utc_kmpx_ussa_water_vapor_weighting_functions_anim.gif)
GOES-13 Sounder water vapor weighting functions: 12 UTC Chanhassen, Minnesota sounding vs US Standard Atmosphere [click to enlarge]
![GOES-16 images: 0.64 µm Visible (top), 6.9 µm Water Vapor (middle) and 7.4 µm Water Vapor (bottom) [click to play animation]](https://cimss.ssec.wisc.edu/satellite-blog/wp-content/uploads/sites/5/2017/03/170308_goes16_visible_water_vapor_Great_Lakes_dry_slot_waves_anim.gif)
GOES-16 images: 0.64 µm Visible (top), 6.9 µm Water Vapor (middle) and 7.4 µm Water Vapor (bottom) [click to play animation]
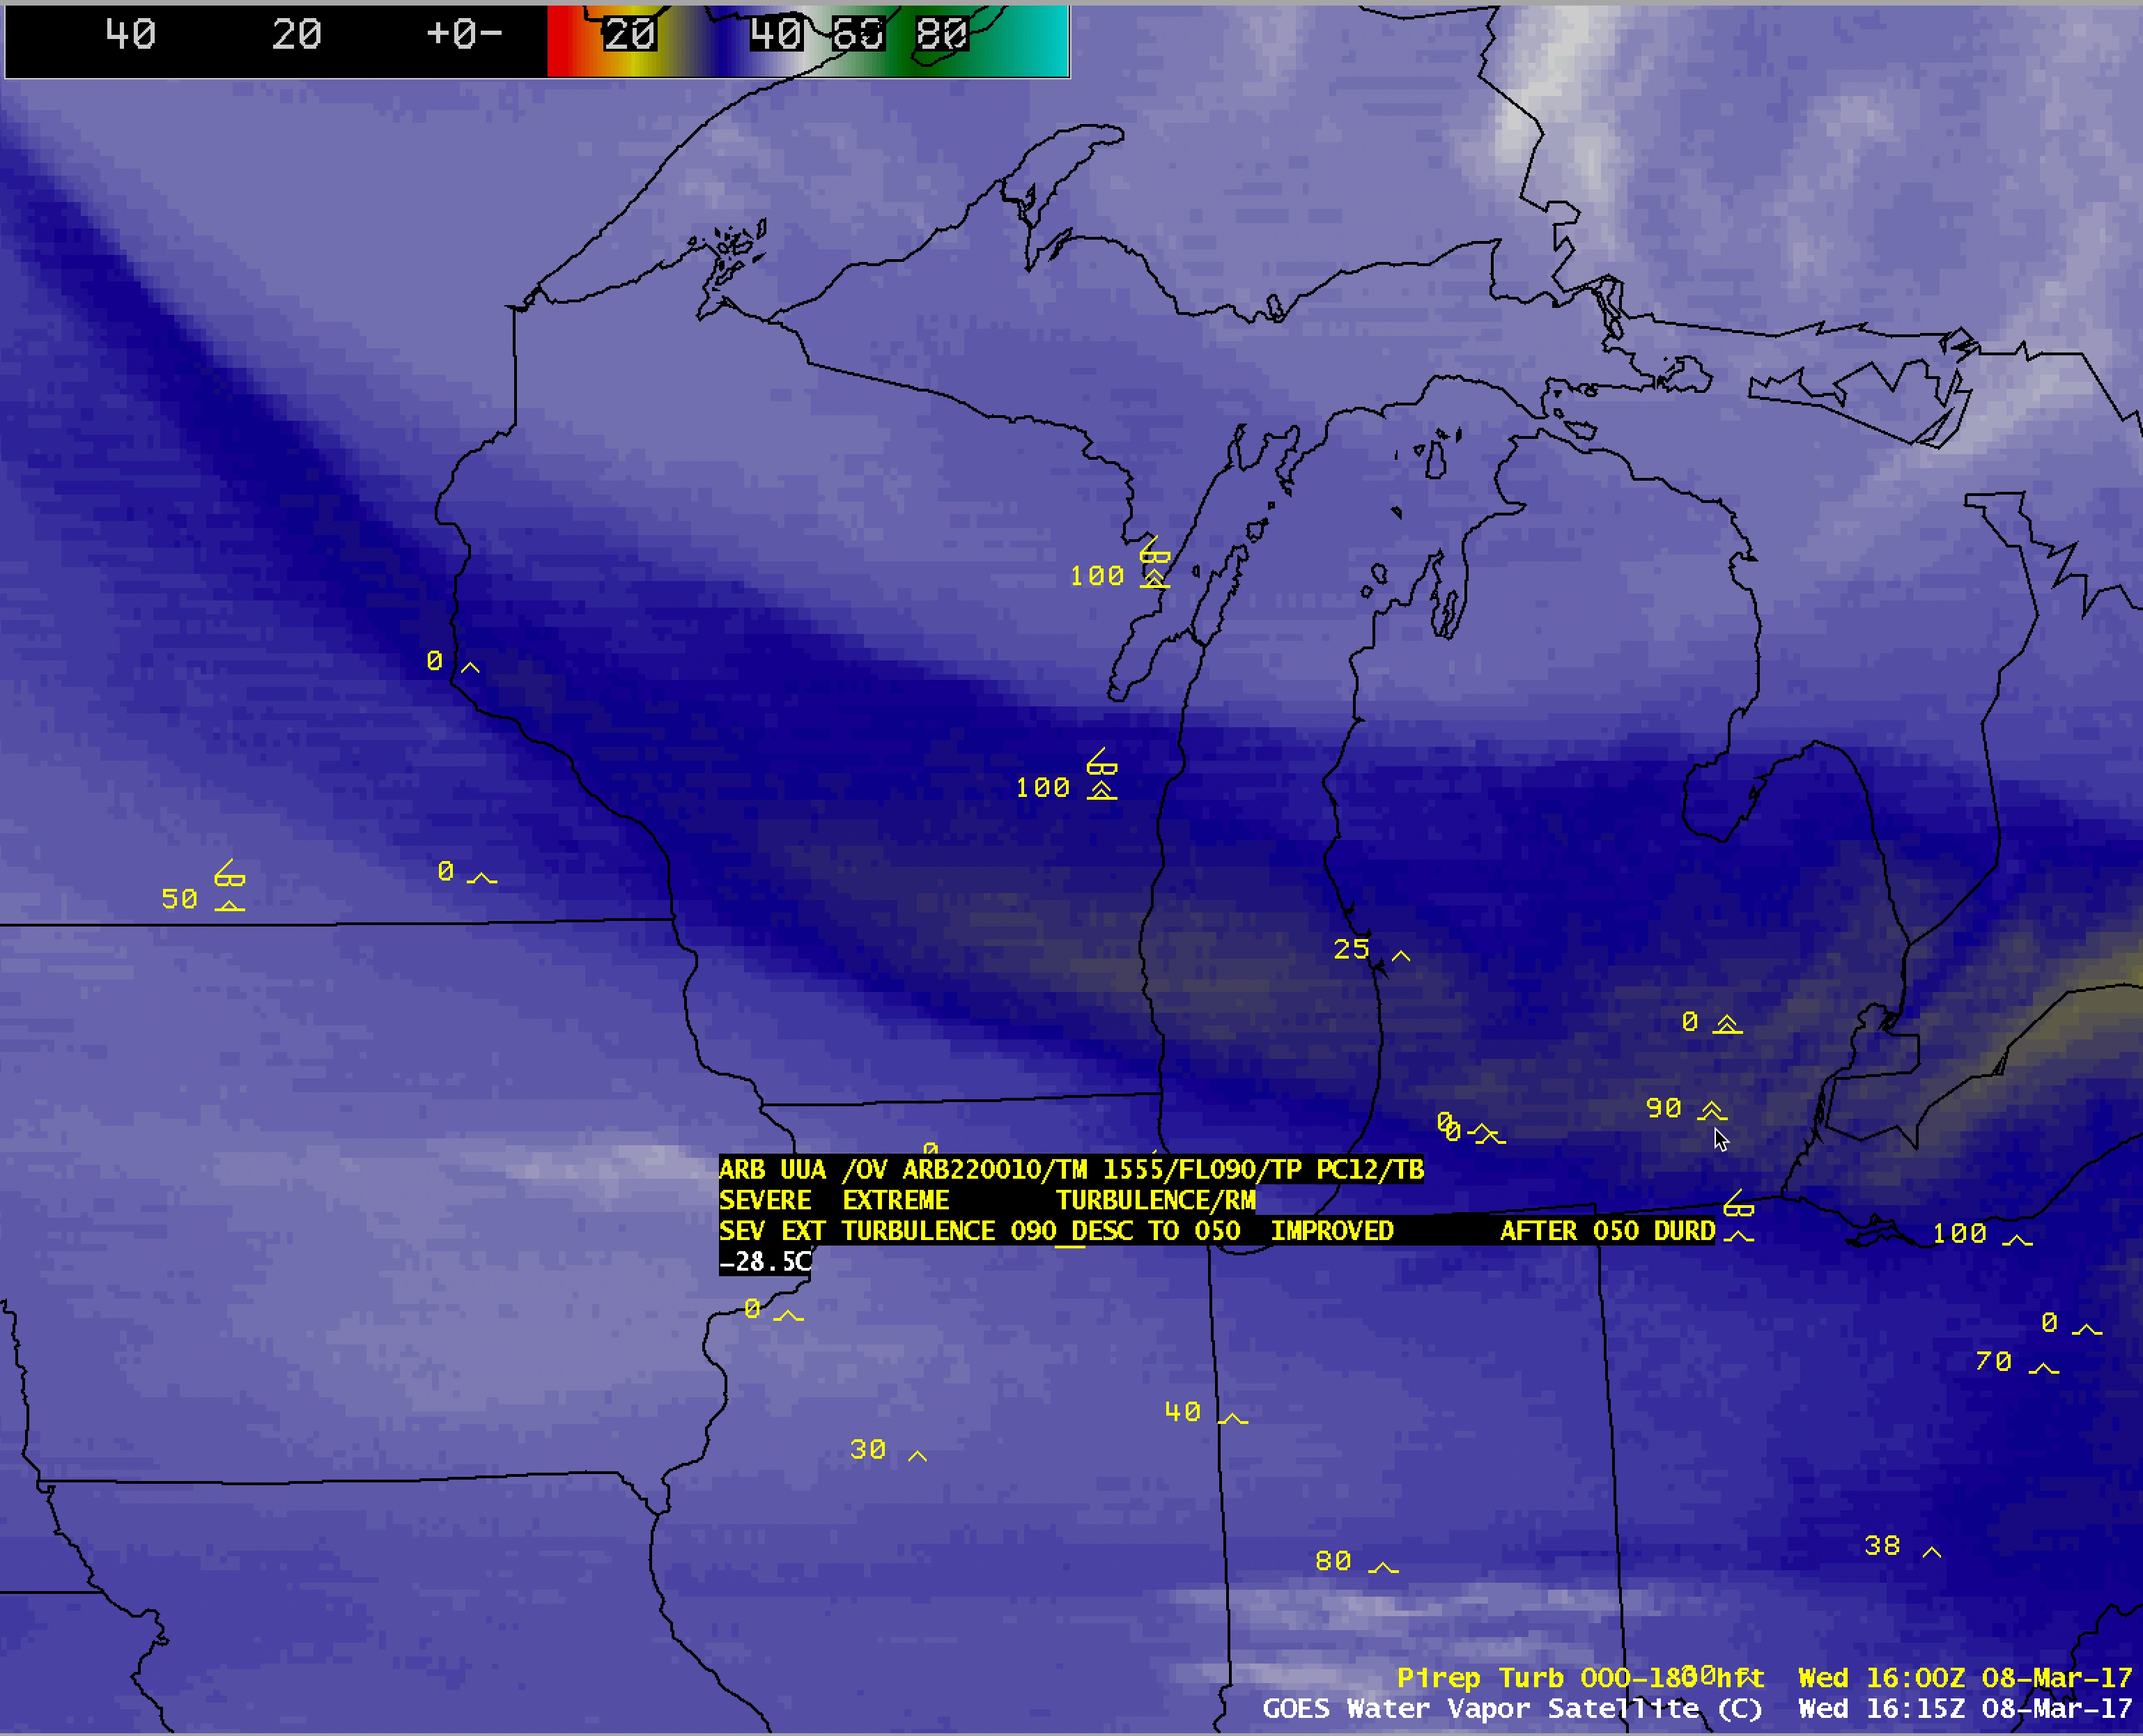
![GOES-13 Water Vapor (6.5 µm) images, with pilot reports of turbulence [click to play animation]](https://cimss.ssec.wisc.edu/satellite-blog/wp-content/uploads/sites/5/2017/03/170308_goes13_water_vapor_pireps_anim.gif)
GOES-13 Water Vapor (6.5 µm) images, with pilot reports of turbulence [click to play animation]