Chan-Hom approaches the coast of China
Himawari-8 6.2 µm (top), 6.9 µm (middle) and 7.3 µm (bottom) water vapor infrared imagery, 0000 UTC 8 July 2015 – 1500 UTC 10 July 2015 (click to animate)
The three water vapor channels from Himawari-8, above, over the course of the past 3 days show a steady northwestward motion and a decrease in the cold cloud tops surrounding the storm, consistent with the weakening that has been observed after peak intensity at ~1500 UTC on July 9. Typhoon Nangka remains southeast of Chan-Hom; Typhoon Linfa has dissipated after having made landfall over south China. Chan-Hom’s path (below) is over progressively colder water and significant intensification is not expected before landfall.
Sea-Surface Temperatures over the Yellow Sea, along with Chan-Hom’s past and projected path (click to enlarge)
A DMSP SSMIS 85 GHz microwave image at 0946 UTC on 10 July, below, showed that Category 3 Typhoon Chan-Hom was undergoing an eyewall replacement cycle as the small inner eyewall was being replaced by a much larger outer eyewall. Also on the image are 1244 UTC Metop ASCAT surface scatterometer winds, which displayed a large area with winds in the 50-59.9 knot range along the western periphery of the tropical cyclone.
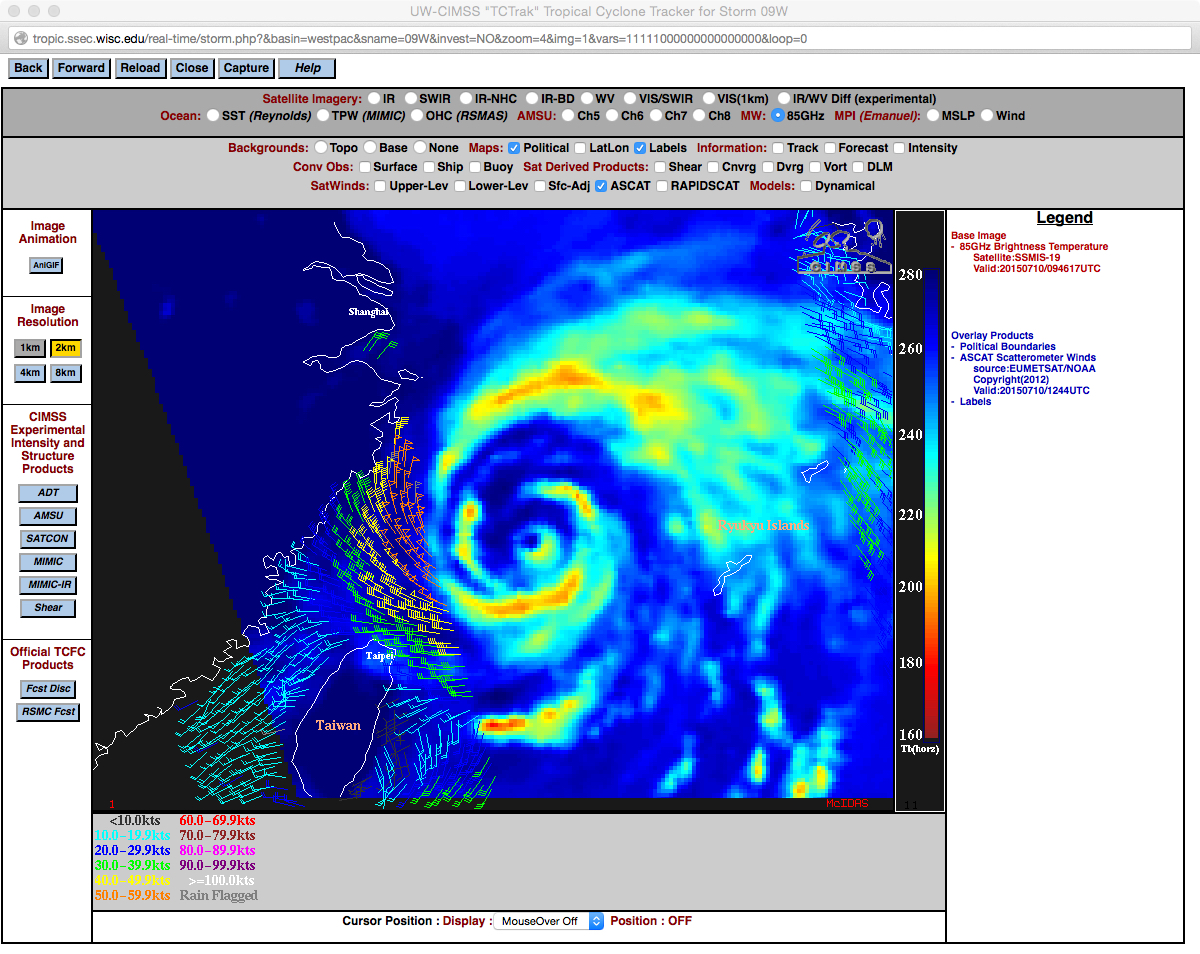
DMSP SSMIS microwave image at 0946 UTC, and Metop ASCAT winds at 1244 UTC (click to enlarge)