SAR winds over Tropical Storm Mirinae
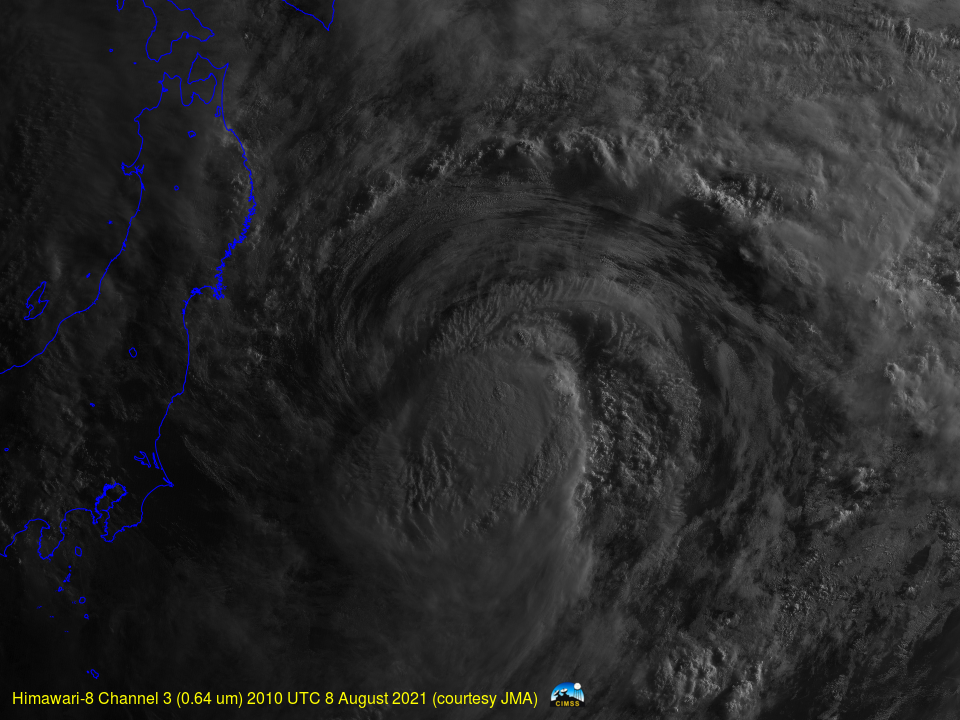
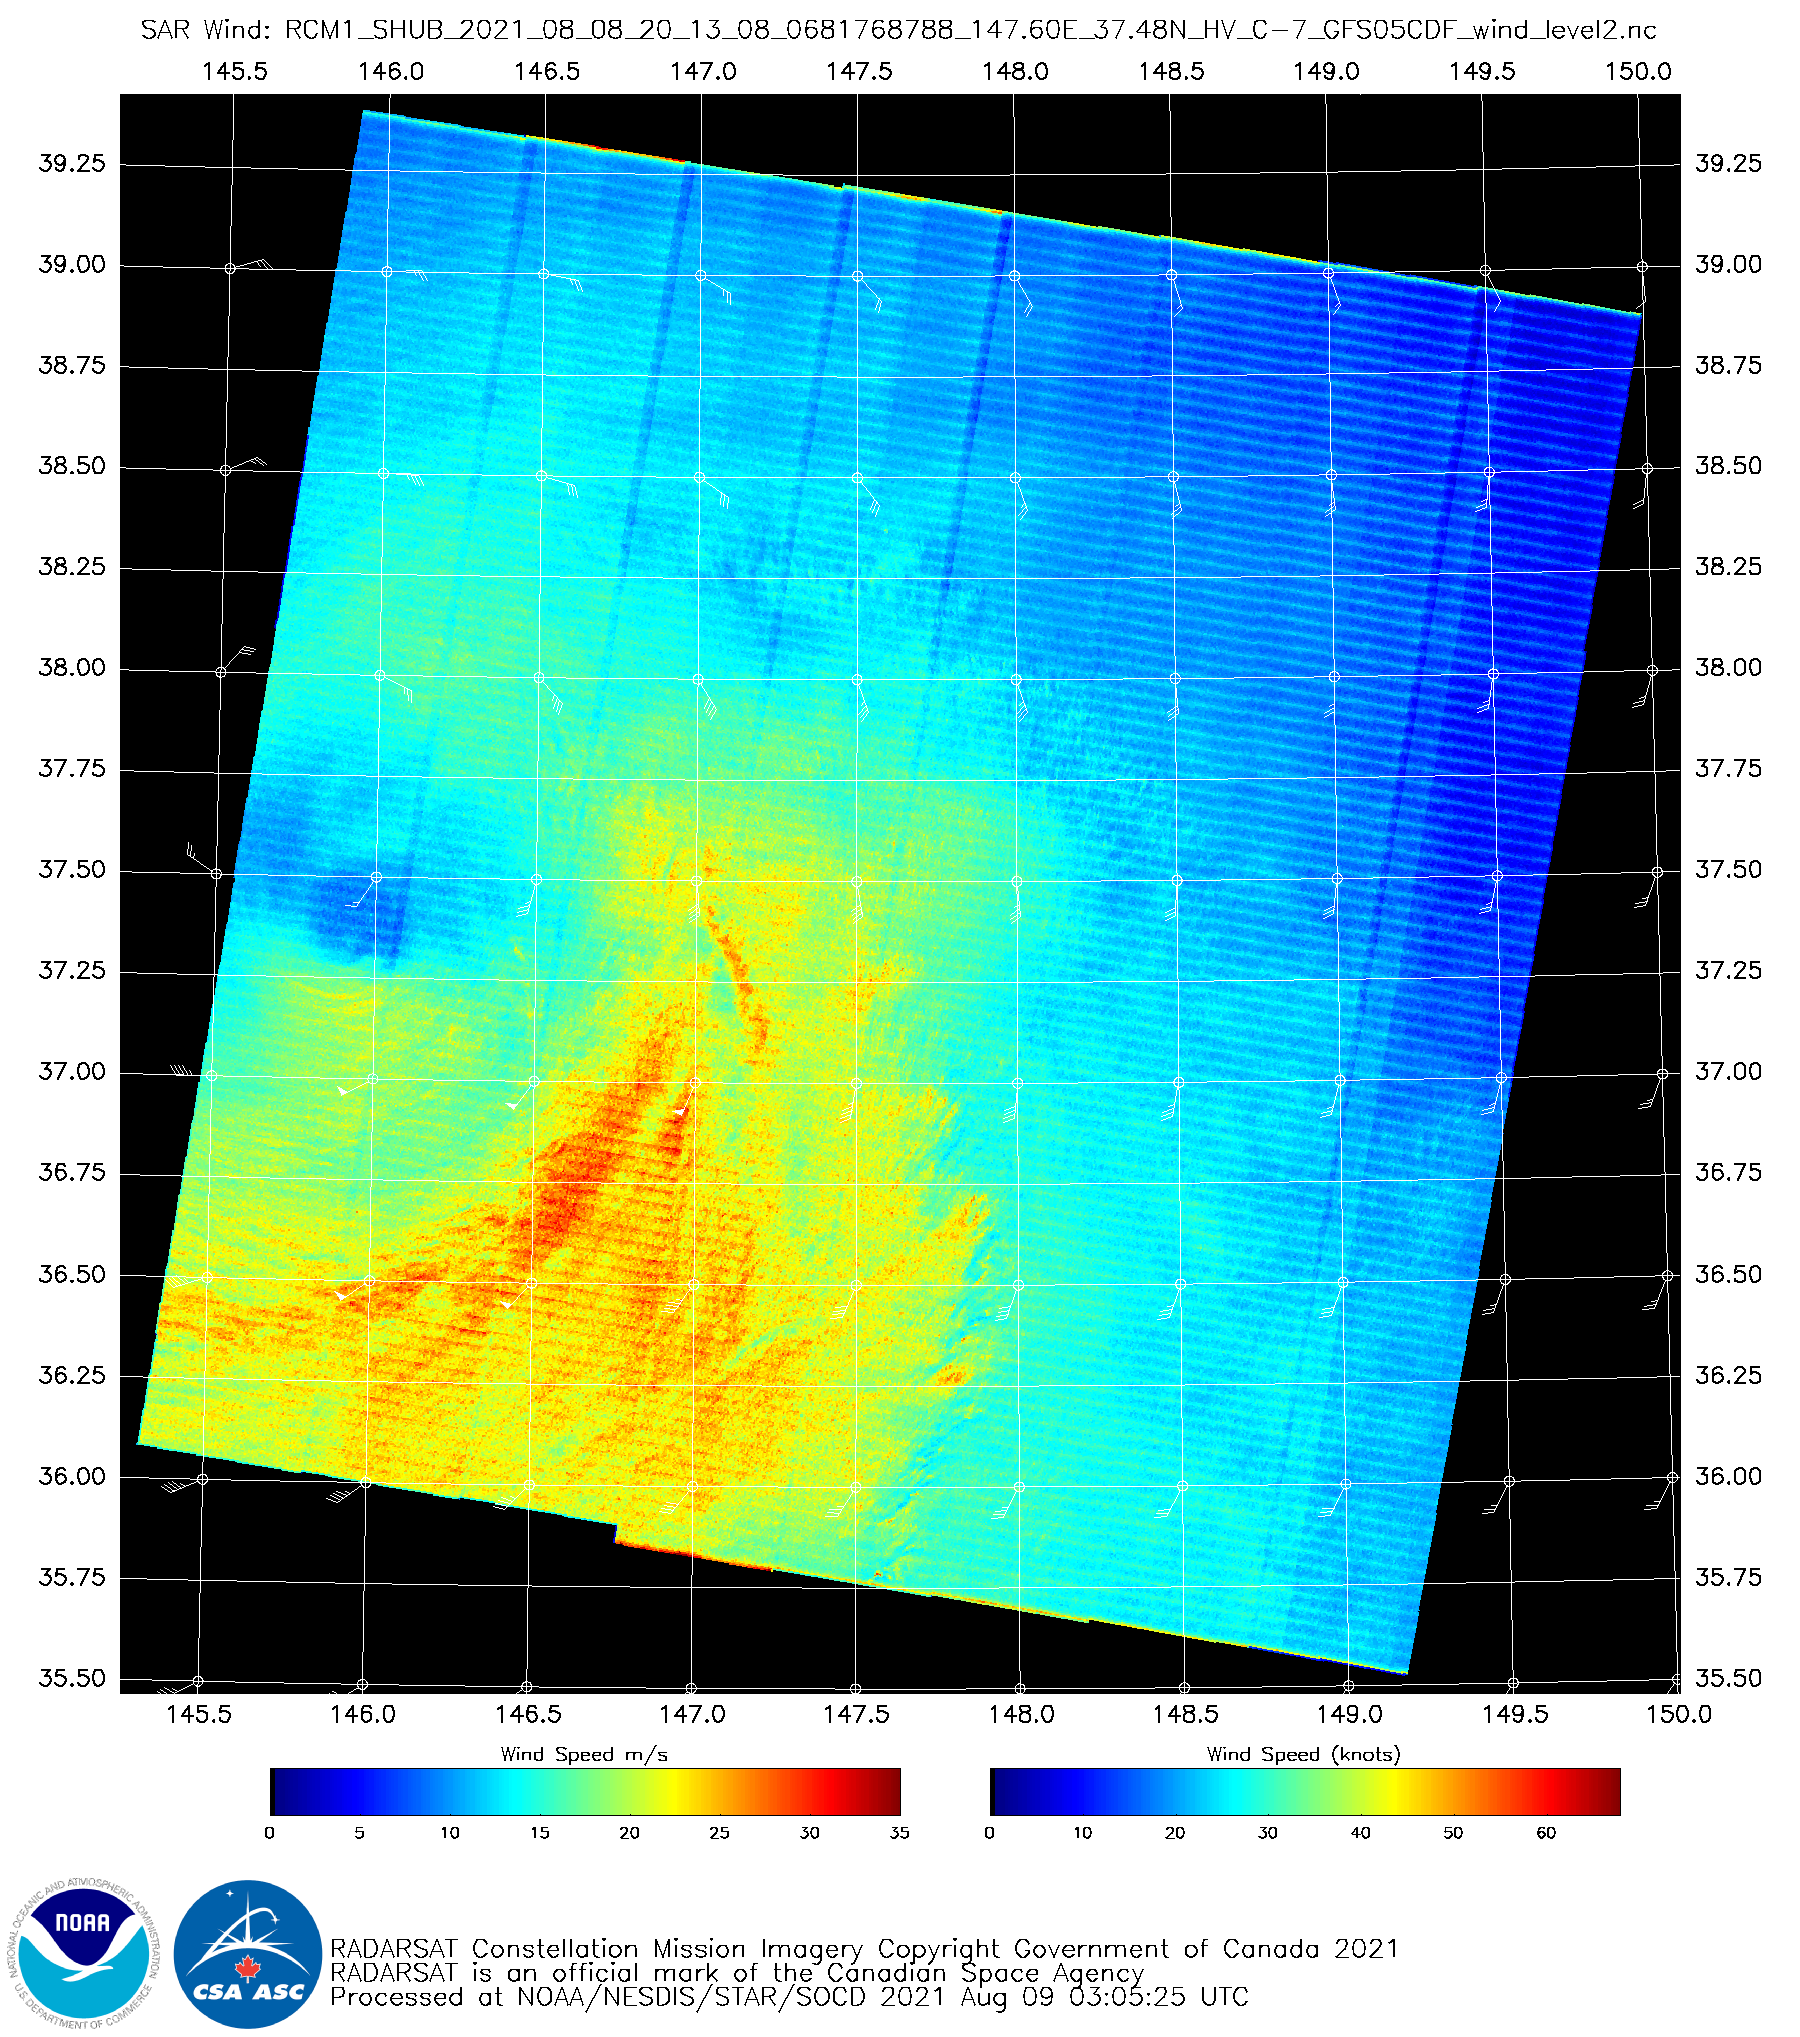
Tropical Storm Mirinae, shown above, to the east of Japan (click here to see the same image with latitude/longitude lines), was overflown on 8 August by Radar Constellation Mission Satellite one (RCM-1) at 2013 UTC. The Synthetic Aperture Radar (SAR) imagery (from this site) is shown below, with both polarities. The two polarities help mitigate wind speed errors that might arise from ice. A peak wind of nearly 60 knots is indicated.
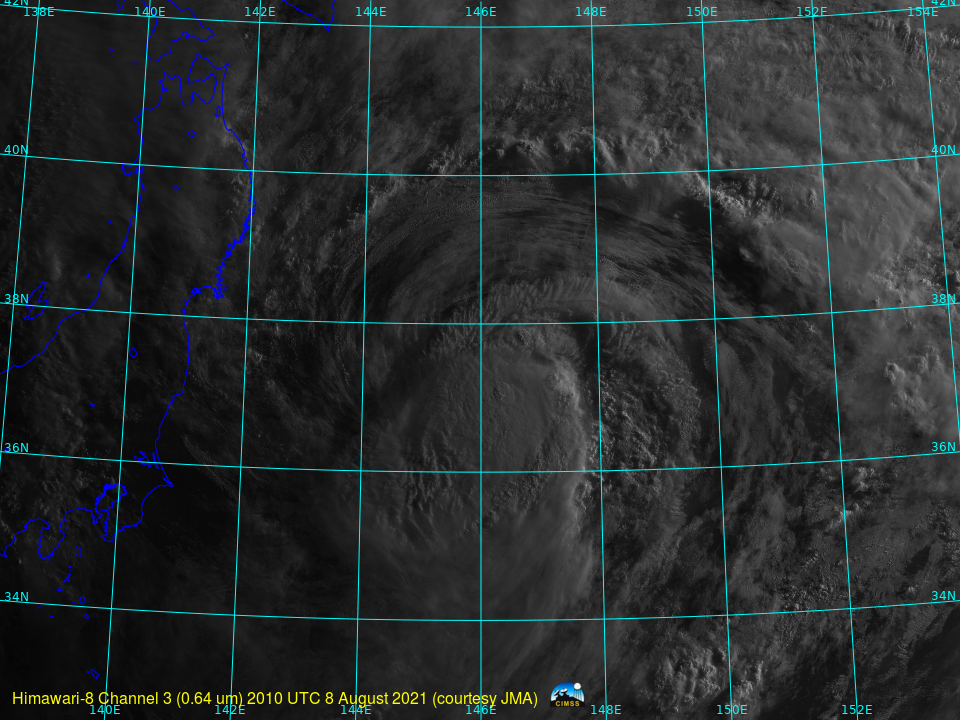

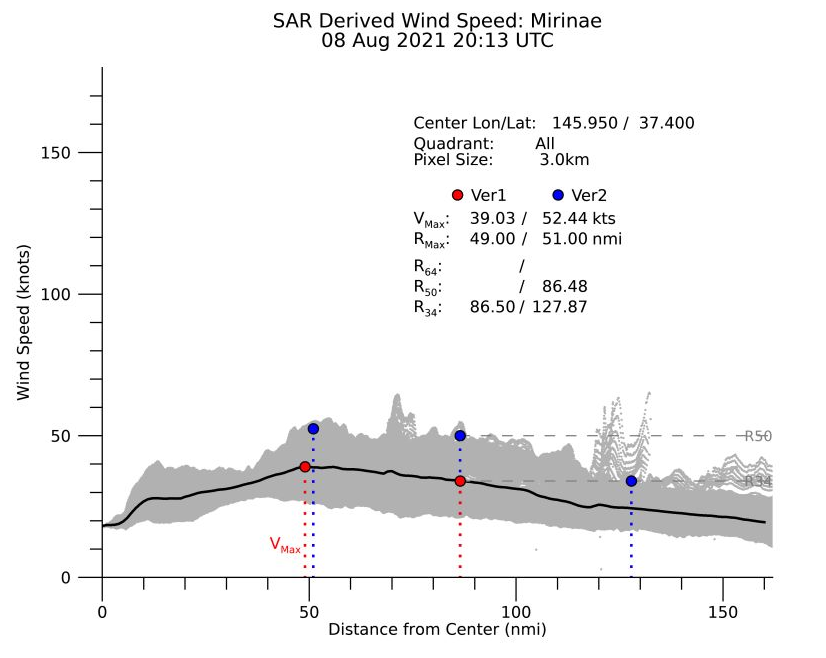
The storm profile winds from the Mirinae at this time are shown below (courtesy Christopher Jackson, GST/NOAA). Such plots are useful for determining max wind radii.