Cyclone Seroja
Himawari-8 ‘Target Area’ clean window infrared (10.41 µm) imagery, 1224 – 2018 UTC on 5 April 2021 (Click to animate)
Himawari-8 ‘Target Area’ imagery (with a 2.5-minute timestep) on 5 April show the evolution of Cyclone Seroja over the Timor Sea northwest of Australia. (Click here for an mp4 animation). Periodic bursts of deep convection (black and white in the color-enhancement) are apparent in the center of the storm. Analyses from the CIMSS Tropical Weather Site (link) show the storm in a region of warm Sea Surface Temperatures. Modest shear is present and it is changing the convective core of the storm in the animation above from circular to elongated over the 8-hour animation. However, strengthening is forecast.
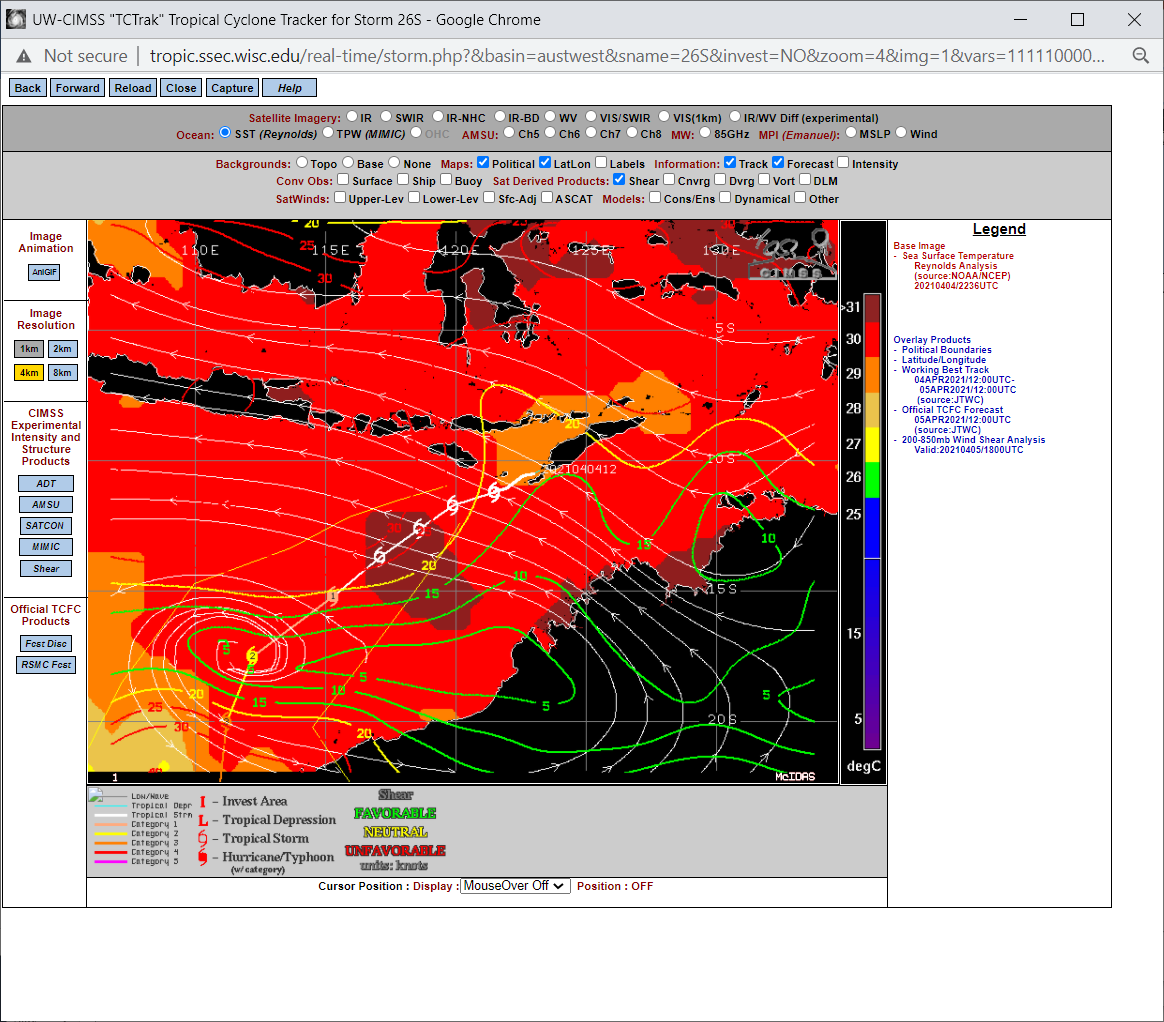
Screen capture of SSTs over the Timor Sea, wind shear, and forecast path of Cyclone Seroja (Click to enlarge)
Visible imagery at sunrise on 6 April shows the evolution of the storm.
Himawari-8 visible (0.64 µm) imagery, 2152 – 2304 UTC on 5 April 2021 (Click to enlarge)
Himawari-8 imagery courtesy JMA. You can also view satellite imagery over the area from KMA.
Update 8 April
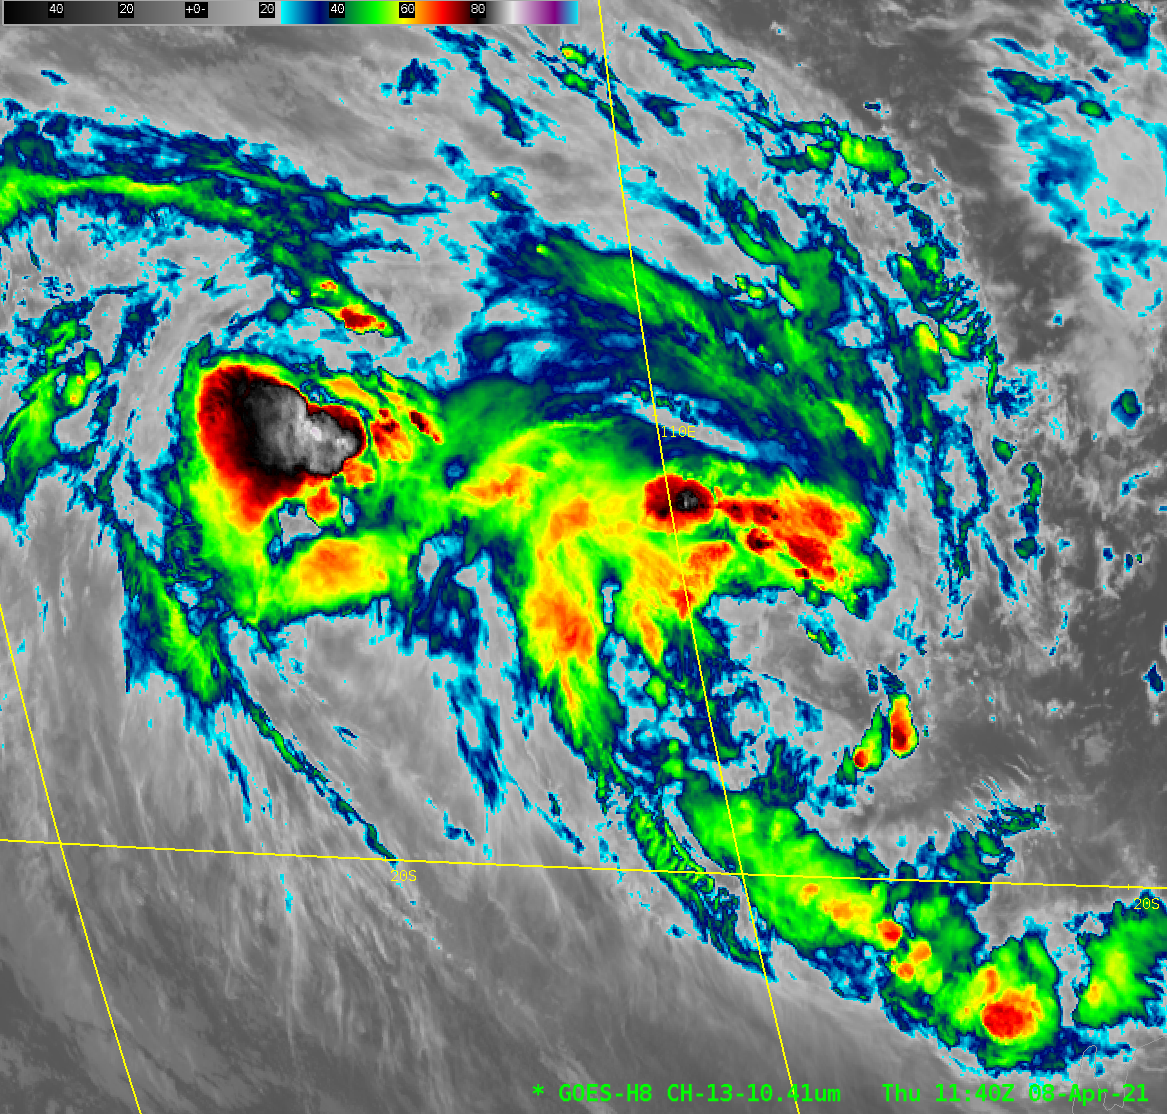
Himawari-8 imagery (10.41 µm), below, from 0300-1610 UTC on 8 April, show a large cirrus canopy initially over Seroja eroding (You can see the 0300 and 1610 UTC images alone toggling here) Can you tell from this infrared imagery where the storm center sits?
Himawari-8 clean window infrared (10.41 µm) (full disk) imagery, 0300 – 1610 UTC on 8 April 2021 (Click to animate)
This is certainly a case where microwave imagery can (and should!) be used to better pinpoint the circulation center. ASMU-B imagery at 89 GHz (from here), below, storm-centered at 2307 UTC 7 April, 0207 8 April and 1143 UTC on 8 April show a storm center near 18ºS, 111.5ºE at around 1200 UTC on 8 April. Here is the Himawari-8 Clean Window infrared at 1140 UTC. Could you place the center near its microwave-suggested center using this infrared imagery?
AMSU-B imagery at 2307 UTC 7 April, 0206 8 April and 1143 8 April. Satellite Platform as indicated in the image. Click to enlarge)
Imagery from the CIMSS Tropical Website (link), below, show that Seroja on 8 April was traversing a region of low shear. Sea surface temperatures at present under the storm are warm; however, the projected path of the storm is towards cooler ocean waters. There is abundant upper-level divergence over the storm and to the northwest of Seroja as well.
Maps of atmospheric wind shear, sea-surface temperatures and upper-level divergence, ca. 1500 UTC on 8 April 2021. The path of the storm, and the projected path of the storm are also noted.
Radarsat-2 Synthetic Aperture Radar (SAR) wind data (from this website), shown below, from 1054 UTC on 8 April, can also be used to infer a circulation center.
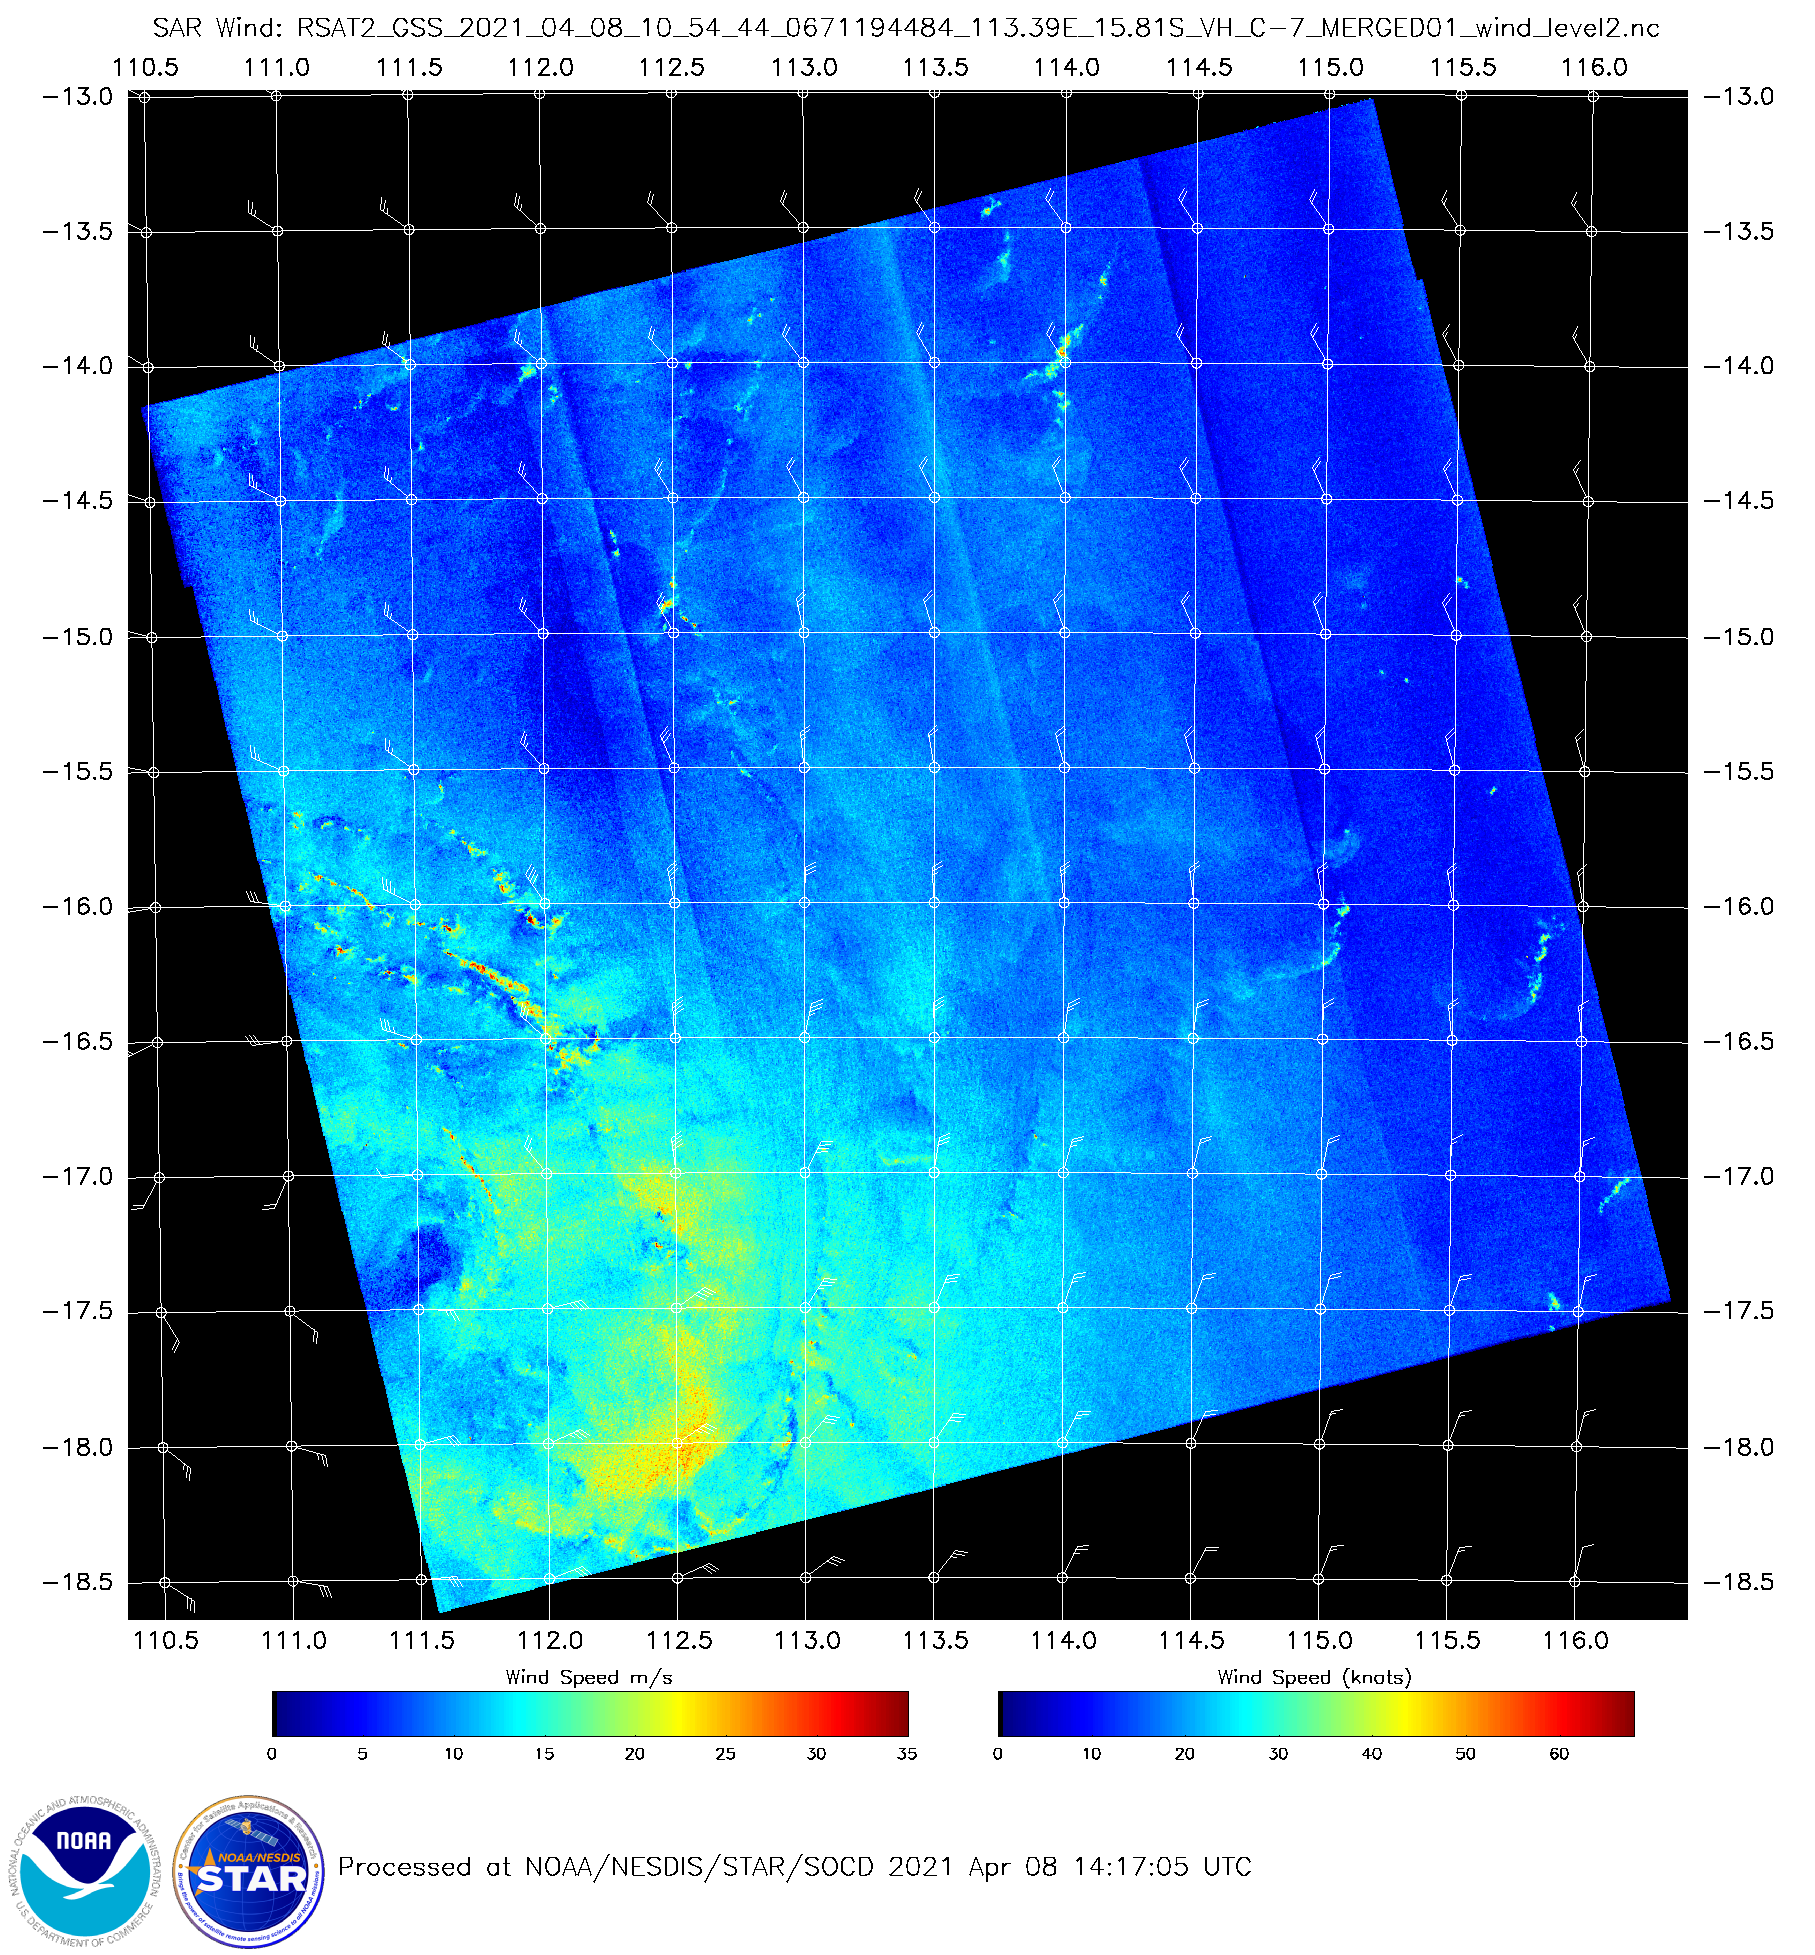
Radarsat-2 SAR Data over Seroja, 1054 UTC on 8 April 2021 (Click to enlarge)