Gas explosion and fire in Los Angeles, California
GOES-17 “Red” Visible (0.64 µm) images [click to play animation | MP4]
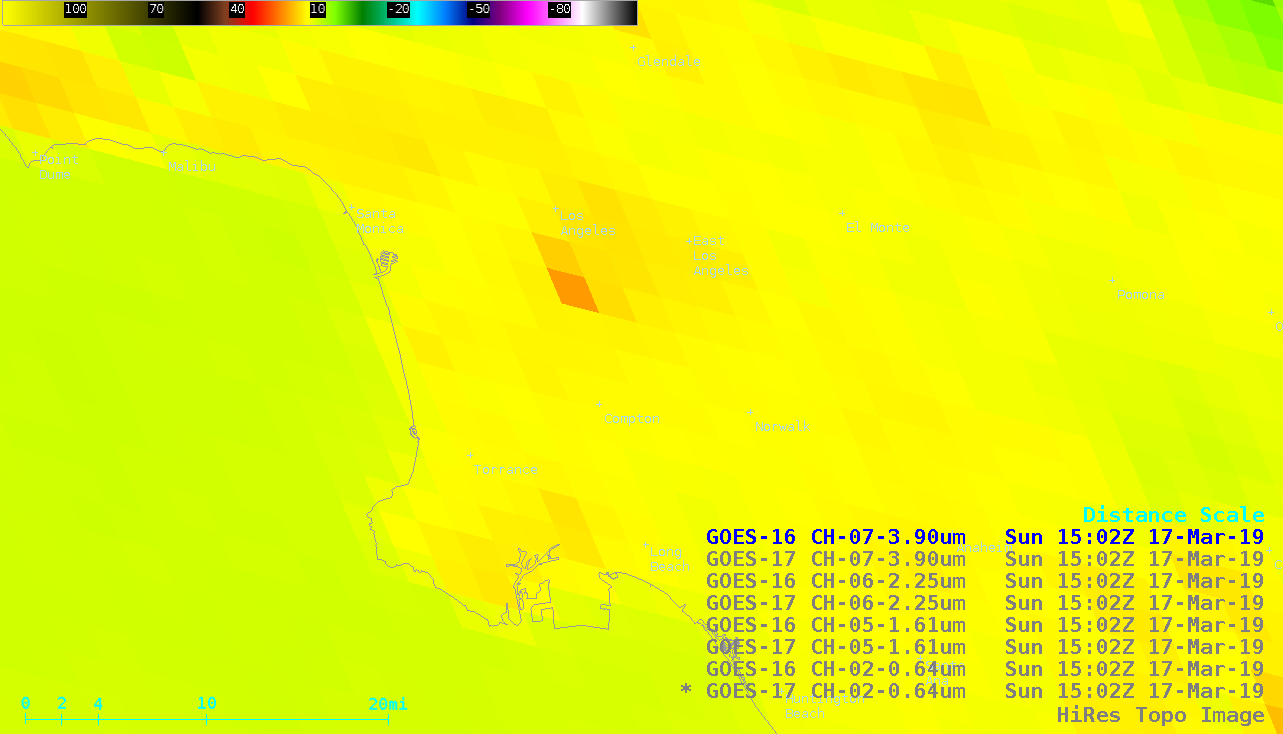
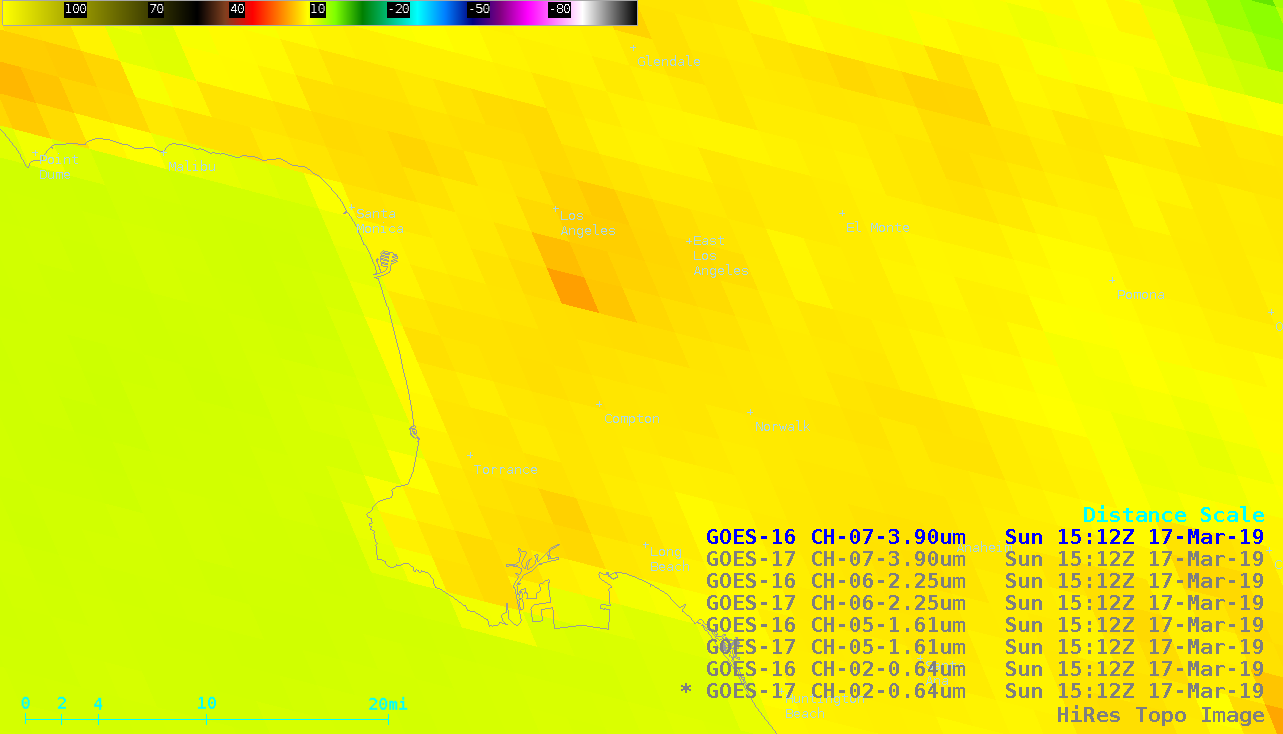
A sequence of 5-minute “Red” Visible (0.64 µm) and Shortwave Infrared (3.9 µm) images from both GOES-17 and GOES-16 (GOES-East) is shown below. It’s interesting to note that a distinct thermal anomaly (or fire “hot spot”) of 21.8ºC (darker orange enhancement) was apparent at 1502 UTC and 1512 UTC in the GOES-16 Shortwave Infrared imagery — but not in the corresponding 3.9 µm images from GOES-17 (GOES-16 vs GOES-17: 1502 UTC | 1512 UTC).
In addition, the underlying mostly-urban landscape appeared a bit brighter in the GOES-16 Visible images, further enhancing the contrast between the dark smoke cloud and the surface (GOES-16 vs GOES-17 at 1517 UTC).
!["Red" Visible (0.64 µm) and Shortwave Infrared (3.9 µm) images from GOES-17 and GOES-16 [click to play animation | MP4]](https://cimss.ssec.wisc.edu/satellite-blog/wp-content/uploads/sites/5/2019/03/190317_goes17_goes16_visible_shortwaveInfrared_CA_explosion_anim.gif)
“Red” Visible (0.64 µm) and Shortwave Infrared (3.9 µm) images from GOES-17 and GOES-16 [click to play animation | MP4]