Mesoscale vortex in North Dakota
A neat circulation feature appeared this morning northwest of Fargo. #ndwx #mnwx pic.twitter.com/AhLRsVSTZQ
— NWS Grand Forks (@NWSGrandForks) November 6, 2018
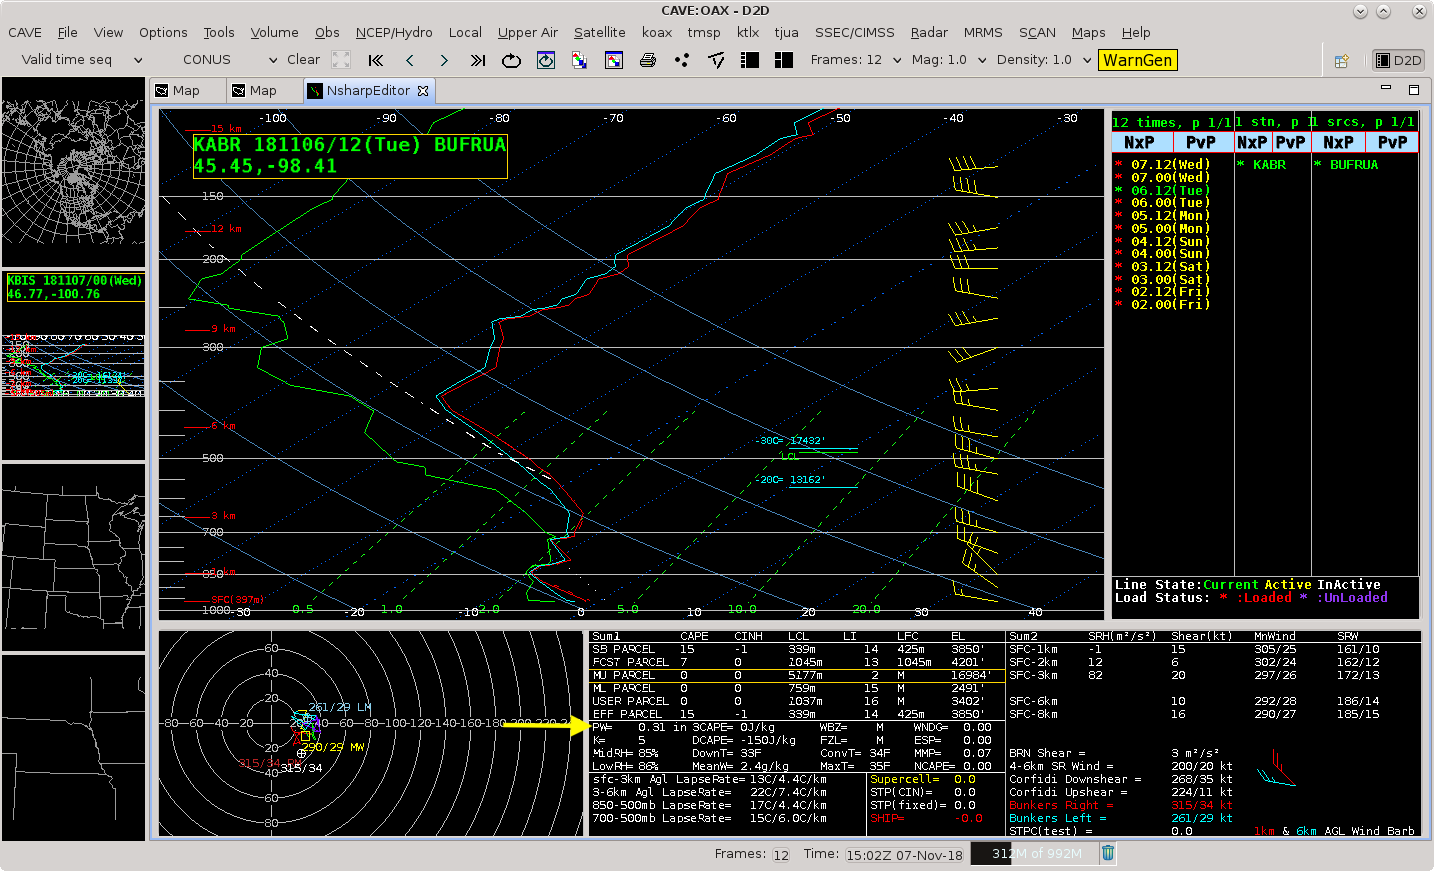
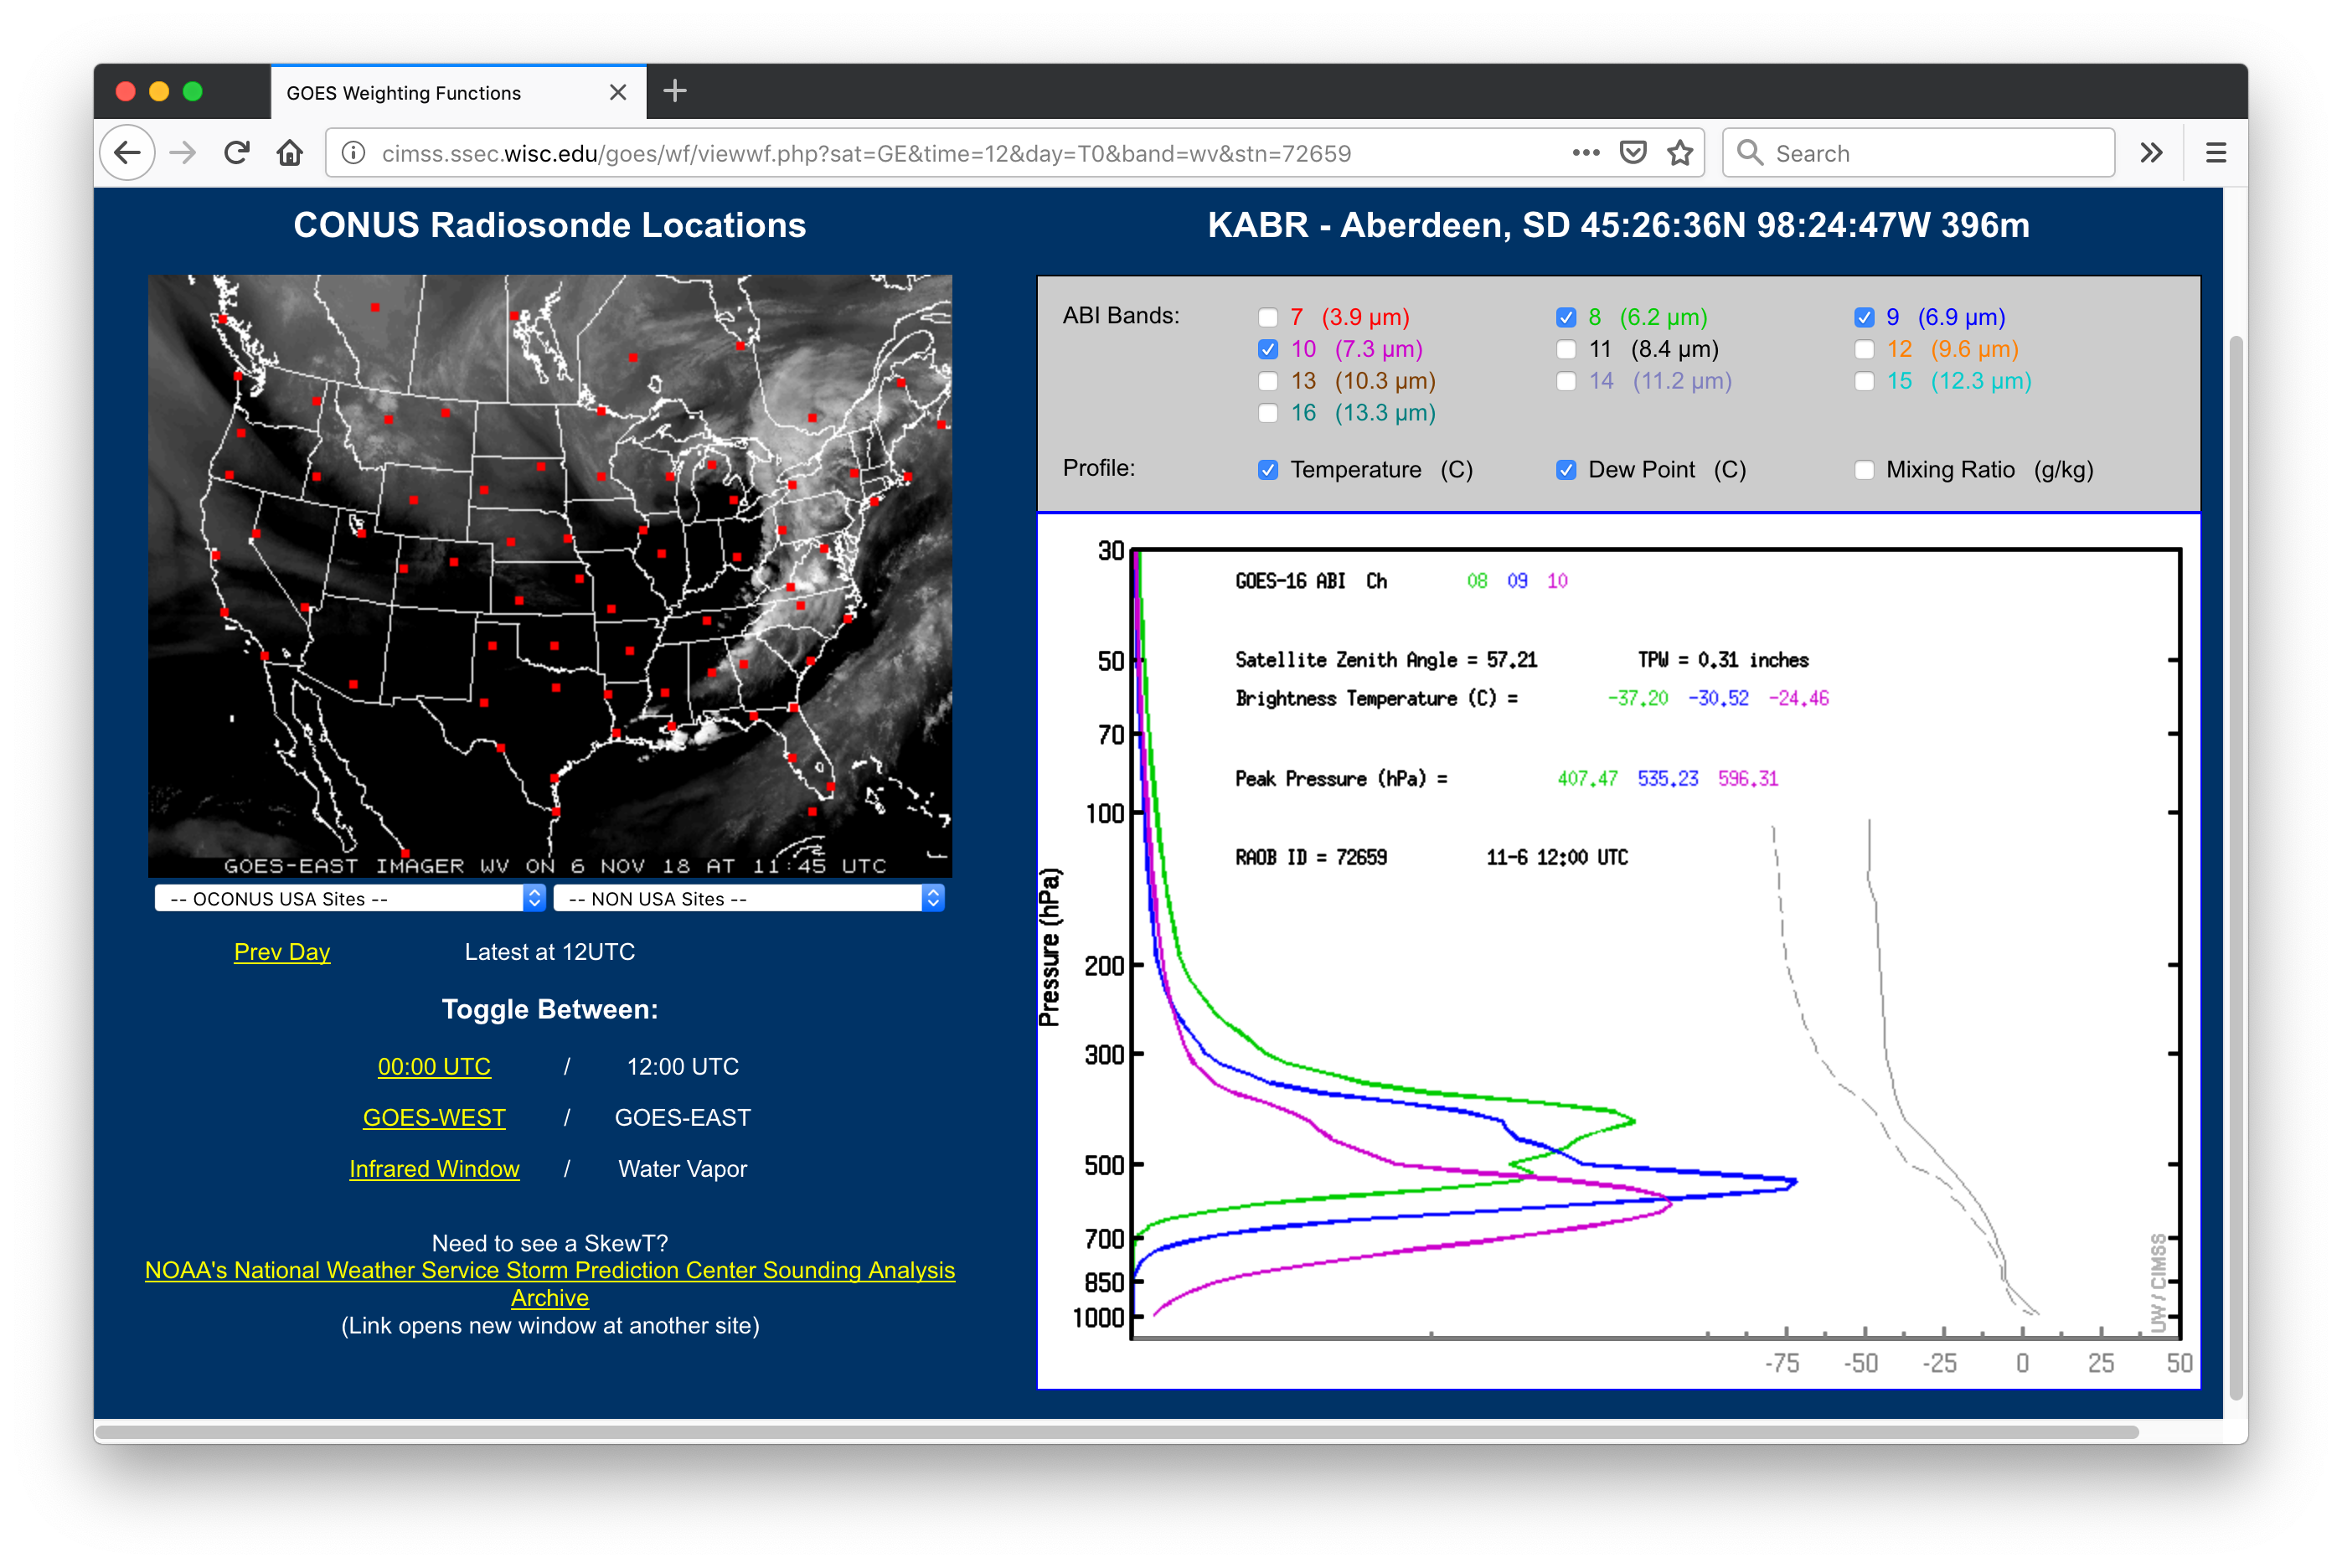
One interesting aspect of this 06 November 2018 mesoscale vortex (which was embedded within a stratus cloud deck) was the fact that a signature of the feature was evident in imagery from 15 of the 16 ABI spectral bands on GOES-16 (below) — only the 6.2 µm Upper-level Water Vapor images lacked even a subtle signal. The appearance of the vortex on 1.37 µm Near-Infrared “Cirrus” imagery was possible because the atmospheric column was very dry over that region (MODIS Total Precipitable Water values of 2-4 mm or 0.08-0.16 inch, and 0.31 inch on the 12 UTC Aberdeen SD sounding), so there was very little attenuation of upwelling 1.37 µm radiation by middle/upper-tropospheric water vapor.
![16-panel comparison of GOES-16 ABI spectral bands [click to play animation | MP4]](https://cimss.ssec.wisc.edu/satellite-blog/wp-content/uploads/sites/5/2018/11/181106_goes16_16panel_ND_vortex_anim.gif)
16-panel comparison of GOES-16 ABI spectral bands [click to play animation | MP4]

GOES-16 “Red” Visible (0.64 µm, left), Near-Infrared “Snow/Ice” (1.61 µm, center) and Low-level Water Vapor (7.3 µm, right) images [click to play animation | MP4]
![Fog/sratus infrared Brightness Temperature Difference images from Terra/Aqua MODIS and NOAA-20/Suomi NPP VIIRS [click to enlarge | MP4]](https://cimss.ssec.wisc.edu/satellite-blog/wp-content/uploads/sites/5/2018/11/181106_modis_viirs_fogBTD_ND_vortex_anim.gif)
Fog/sratus infrared Brightness Temperature Difference images from Terra/Aqua MODIS and NOAA-20/Suomi NPP VIIRS [click to enlarge | MP4]
![GOES-16 Split Cloud Top Phase (11.2 - 8.4 µm) product [click to play animation | MP4]](https://cimss.ssec.wisc.edu/satellite-blog/wp-content/uploads/sites/5/2018/11/181106_goes16_split_phase_ND_anim.gif)
GOES-16 Split Cloud Top Phase (11.2 – 8.4 µm) product [click to play animation | MP4]
![GOES-16 Cloud Particle Size Distribution product [click to play animation | MP4]](https://cimss.ssec.wisc.edu/satellite-blog/wp-content/uploads/sites/5/2018/11/181106_goes16_cloud_particle_size_distribution_ND_anim.gif)
GOES-16 Cloud Particle Size Distribution product [click to play animation | MP4]
![GOES-16 Cloud Top Phase product [click to play animation | MP4]](https://cimss.ssec.wisc.edu/satellite-blog/wp-content/uploads/sites/5/2018/11/181106_goes16_cloud_top_phase_ND_anim.gif)
GOES-16 Cloud Top Phase product [click to play animation | MP4]
![GOES-16 Cloud Top Height product [click to play animation | MP4]](https://cimss.ssec.wisc.edu/satellite-blog/wp-content/uploads/sites/5/2018/11/181106_goes16_cloud_top_height_ND_anim.gif)
GOES-16 Cloud Top Height product [click to play animation | MP4]
![Terra and Aqua MODIS Visible (0.65 µm), Cirrus (1.37 µm), Snow/Ice (1.61 µm) and Infrared Window (11.0 µm) at 1816 UTC and 1955 UTC [click to enlarge | MP4]](https://cimss.ssec.wisc.edu/satellite-blog/wp-content/uploads/sites/5/2018/11/181106_modis_visible_cirrus_snowIce_infraredWindow_ND_anim.gif)
Terra and Aqua MODIS Visible (0.65 µm), Cirrus (1.37 µm), Snow/Ice (1.61 µm) and Infrared Window (11.0 µm) at 1816 UTC and 1955 UTC [click to enlarge | MP4]
![Suomi NPP VIIRS Visible (0.64 µm), Snow/Ice (1.61 µm) and Infrared Window (11.45 µm) images at 1841 UTC, 1941 UTC and 2020 UTC [click to enlarge | MP4]](https://cimss.ssec.wisc.edu/satellite-blog/wp-content/uploads/sites/5/2018/11/181106_viirs_visible_snowIce_infraredWindow_ND_anim.gif)
Suomi NPP VIIRS Visible (0.64 µm), Snow/Ice (1.61 µm) and Infrared Window (11.45 µm) images at 1841 UTC, 1941 UTC and 2020 UTC [click to enlarge | MP4]
![True Color and False Color RGB images from Terra/Aqua MODIS and Suomi NPP VIIRS [click to play animation]](https://cimss.ssec.wisc.edu/satellite-blog/wp-content/uploads/sites/5/2018/11/181106_modis_viirs_truecolor_falsecolor_ND_vortex_anim.gif)
True Color and False Color RGB images from Terra/Aqua MODIS and Suomi NPP VIIRS [click to play animation]
![Terra MODIS Visible (0.65 µm) image with aurface analysis of pressure and fronts [click to enlarge]](https://cimss.ssec.wisc.edu/satellite-blog/wp-content/uploads/sites/5/2018/11/nd_modis_vis_front-20181106_181600.png)
Terra MODIS Visible (0.65 µm) image with aurface analysis of pressure and fronts [click to enlarge]
![GOES-16 Split Cloud Top Phase (11.2 - 8.4 µm) product at 1202 and 1802 UTC, with overlays of NAM12 700 hPa vorticity [click to enlarge]](https://cimss.ssec.wisc.edu/satellite-blog/wp-content/uploads/sites/5/2018/11/181106_goes16_cloud_top_phase_700hPa_vorticity_ND_anim.gif)
GOES-16 Split Cloud Top Phase (11.2 – 8.4 µm) product at 1202 and 1802 UTC, with overlays of NAM12 model 700 hPa vorticity [click to enlarge]