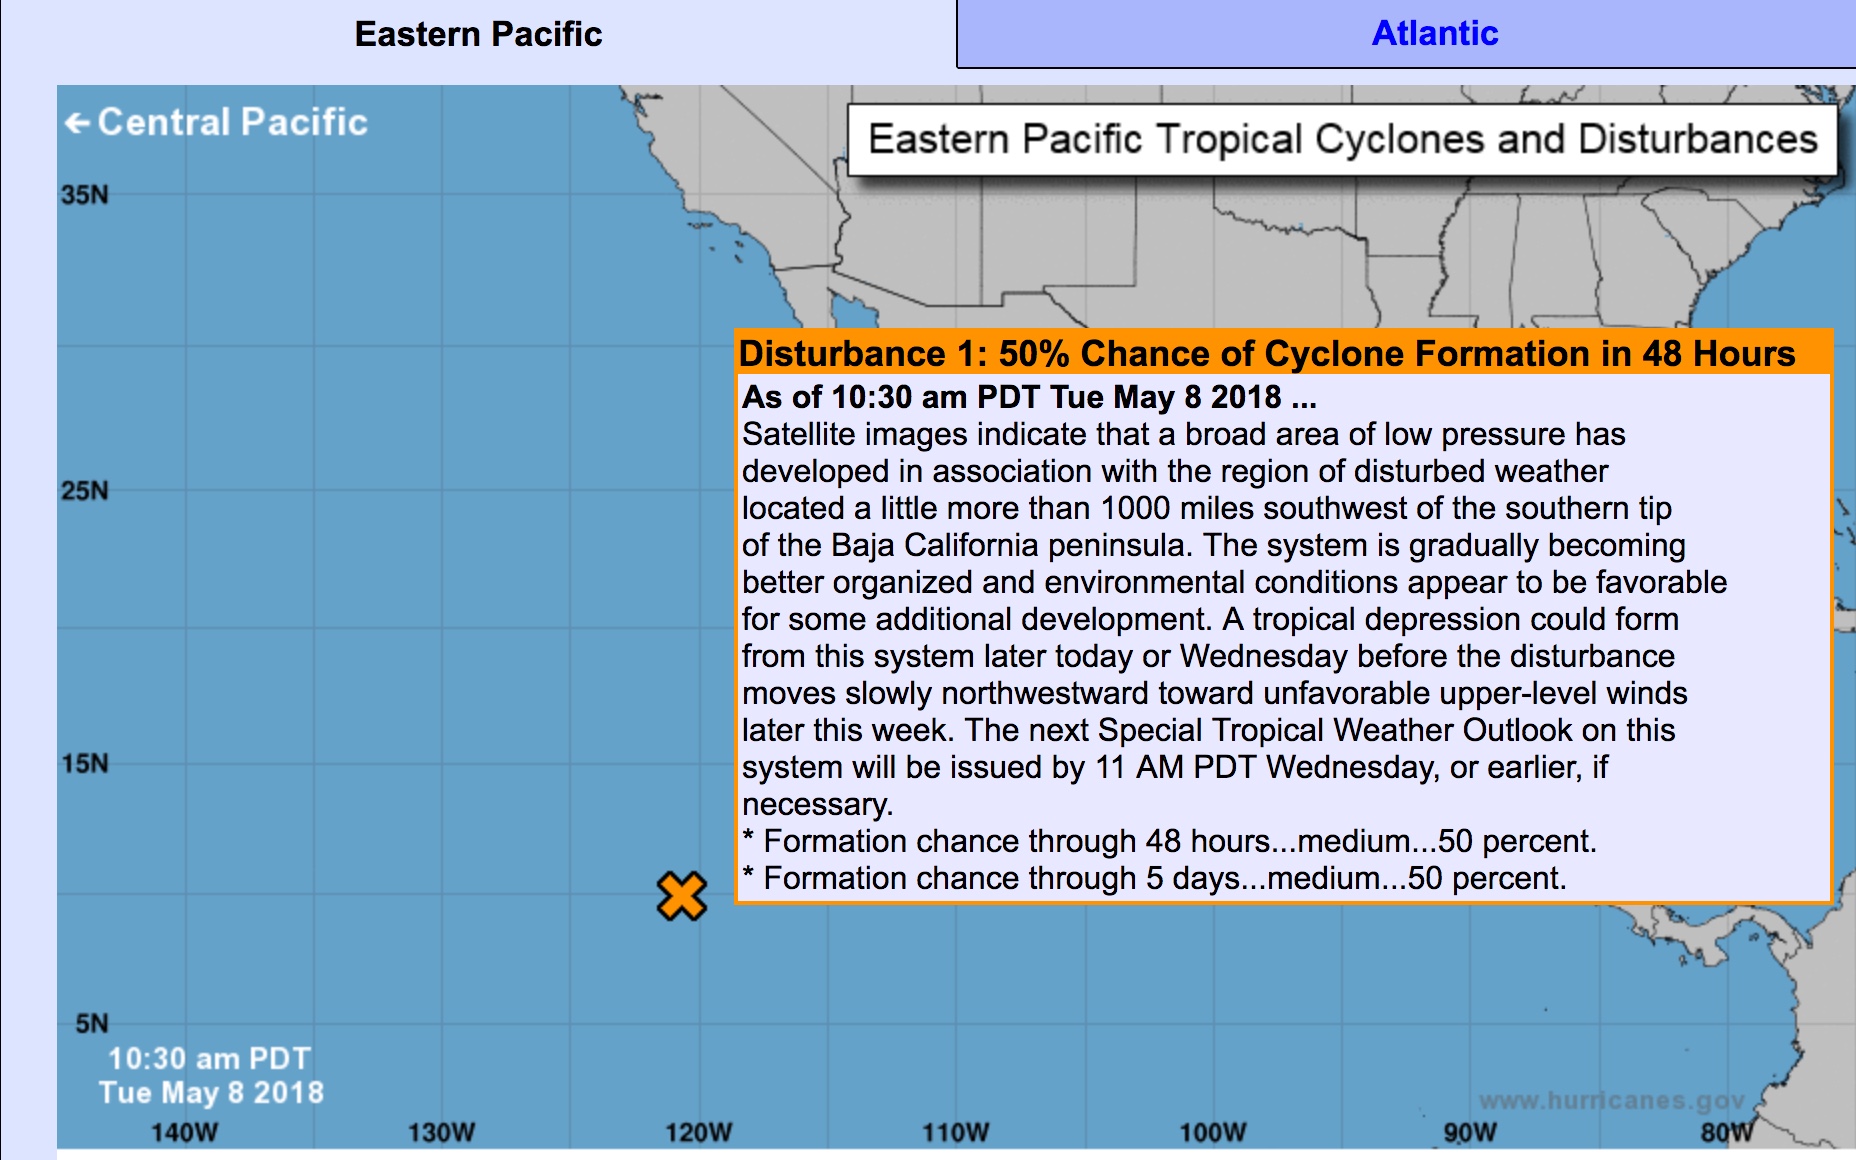
Tropical Invest 90E in the East Pacific
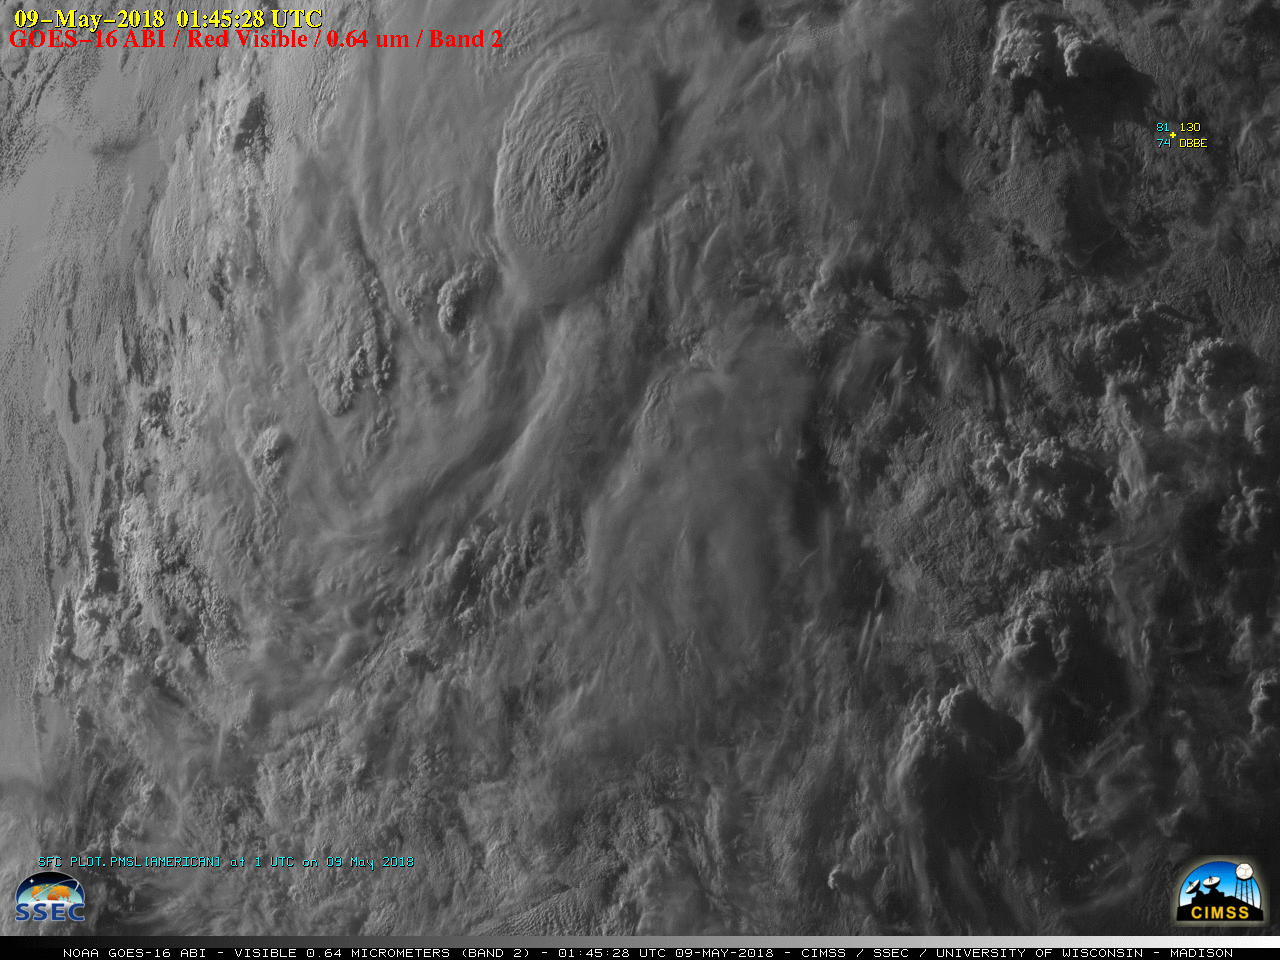
GOES-16 “Red” Visible (0.64 µm) images, with hourly plots of ship reports [click to play MP4 animation]
Metop ASCAT surface scatterometer winds from the CIMSS Tropical Cyclones site (below) showed velocities in the 20.0 to 29.9 knot range (dark blue barbs).
![GOES-15 Visible (0.63 µm) image with Metop ASCAT surface scatterometer winds [click to enlarge]](https://cimss.ssec.wisc.edu/satellite-blog/wp-content/uploads/sites/5/2018/05/180508_17utc_goes15_visible_ascat_Invest90E_anim.gif)
GOES-15 Visible (0.63 µm) image with Metop ASCAT surface scatterometer winds [click to enlarge]
![GOES-15 Visible (0.63 µm) image, with contours of deep-layer wind shear [click to enlarge]](https://cimss.ssec.wisc.edu/satellite-blog/wp-content/uploads/sites/5/2018/05/180508_goes15_visible_shear_Invest90E.jpeg)
GOES-15 Visible (0.63 µm) image, with contours of deep-layer wind shear [click to enlarge]
![Sea Surface Temperature analysis [click to enlarge]](https://cimss.ssec.wisc.edu/satellite-blog/wp-content/uploads/sites/5/2018/05/180507_2235utc_sst_Invest90E.jpeg)
Sea Surface Temperature analysis [click to enlarge]
![Ocean Heat Content analysis [click to enlarge]](https://cimss.ssec.wisc.edu/satellite-blog/wp-content/uploads/sites/5/2018/05/180508_ohc_Invest90E.jpeg)
Ocean Heat Content analysis [click to enlarge]
The hourly MIMIC Total Precipitable Water product (below) showed that Invest 90E was embedded within the ribbon of high moisture associated with the ITCZ.
![MIMIC Total Precipitable Water product [click to enlarge]](https://cimss.ssec.wisc.edu/satellite-blog/wp-content/uploads/sites/5/2018/05/180508_mimic_tpw_Invest90E_anim.gif)
MIMIC Total Precipitable Water product [click to enlarge]