Middle/upper-level deformation zone over the East Pacific Ocean?
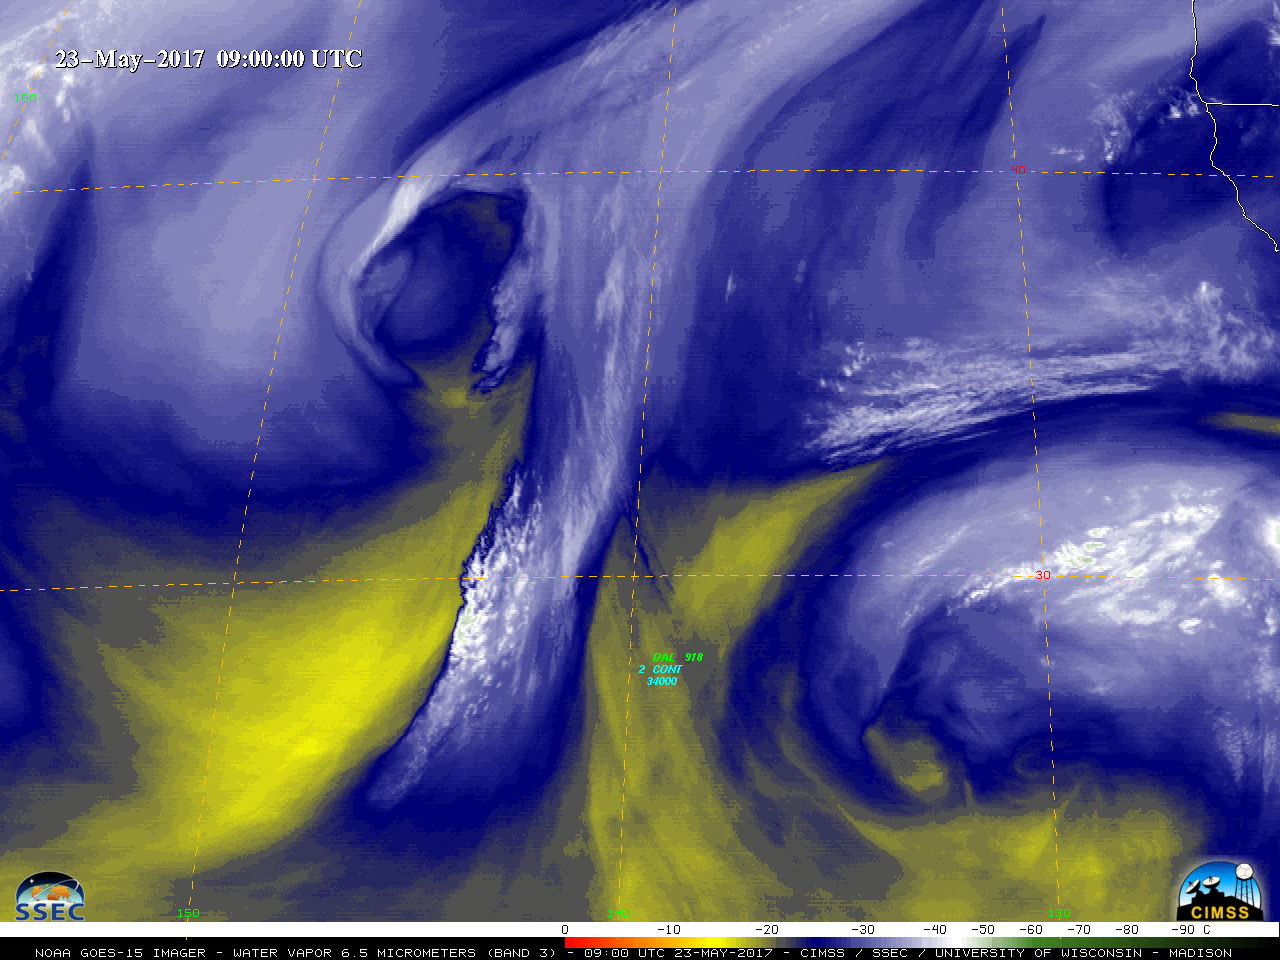
![GOES-15 Water Vapor (6.5 µm) images, with pilot reports of turbulence [click to play animation]](https://cimss.ssec.wisc.edu/satellite-blog/wp-content/uploads/sites/5/2017/05/170523_goes15_water_vapor_pireps_anim.gif)
GOES-15 Water Vapor (6.5 µm) images, with pilot reports of turbulence [click to play animation]
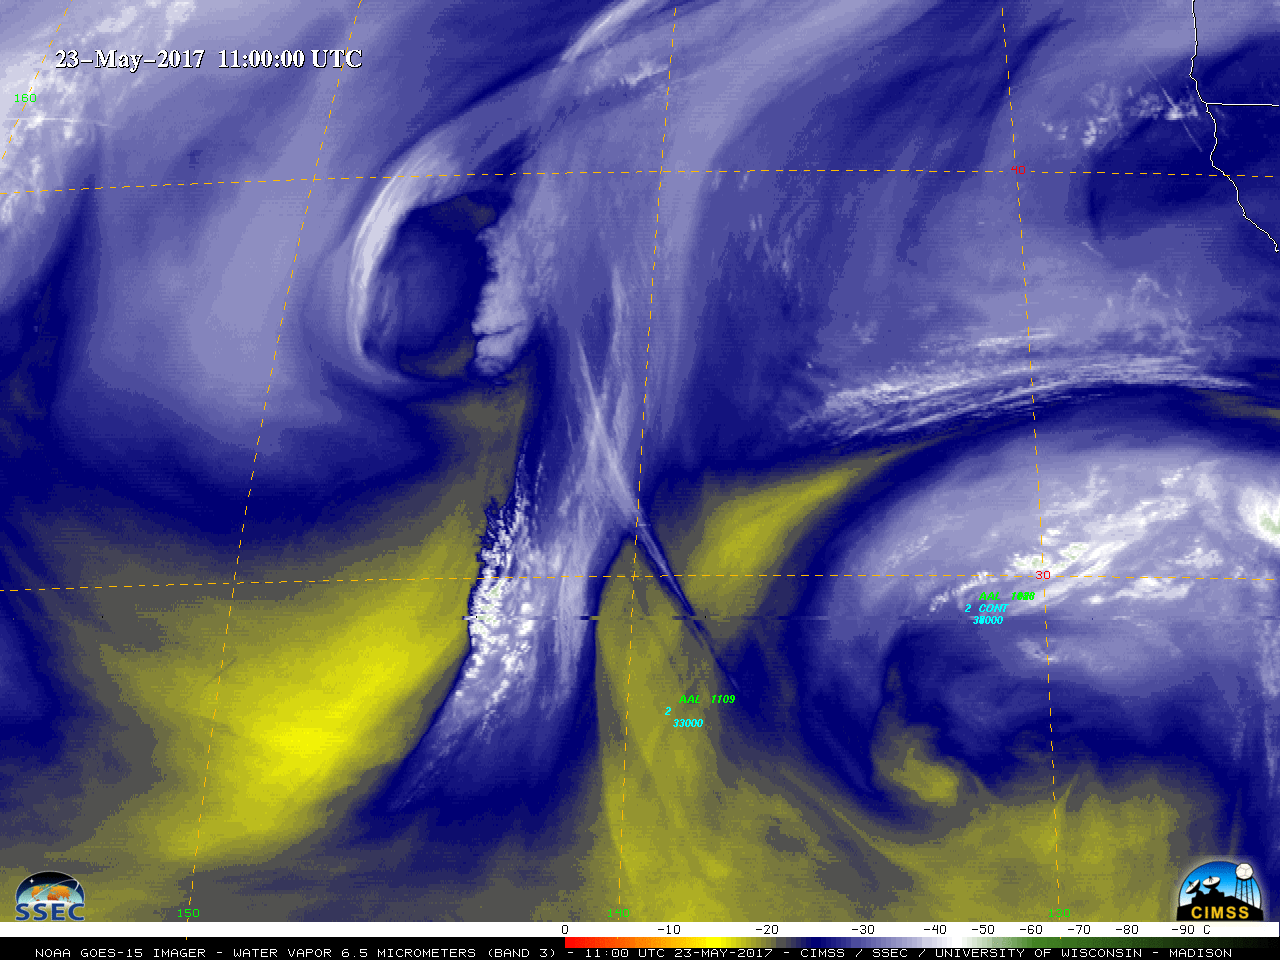
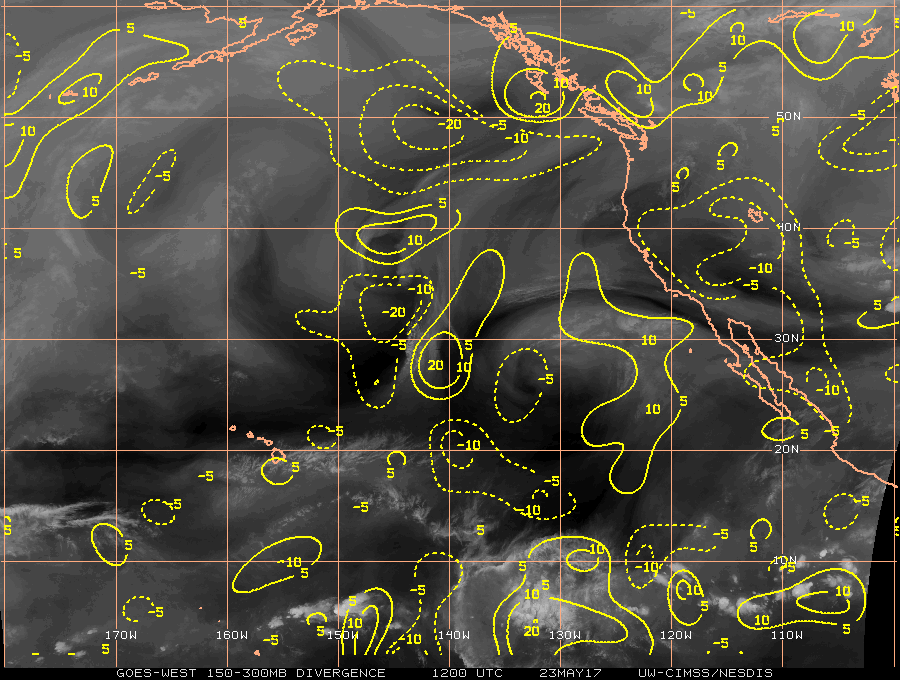
![GOES-15 Water Vapor (6.5 µm) images, with contours of satellite wind derived upper-level divergence [click to enlarge]](https://cimss.ssec.wisc.edu/satellite-blog/wp-content/uploads/sites/5/2017/05/170523_goes15_water_vapor_upper_level_divergence_anim.gif)
GOES-15 Water Vapor (6.5 µm) images, with contours of satellite wind derived Upper-Level Divergence [click to enlarge]
![GOES-15 sounder Water Vapor (6.5 µm, top; 7.0 µm, middle; 7.5 µm, bottom) images [click to enlarge]](https://cimss.ssec.wisc.edu/satellite-blog/wp-content/uploads/sites/5/2017/05/170523_goes15_sounder_water_vapor_anim.gif)
GOES-15 sounder Water Vapor (6.5 µm, top; 7.0 µm, middle; 7.5 µm, bottom) images [click to enlarge]
![GOES-15 sounder Water Vapor band weighting functions [click to enlarge]](https://cimss.ssec.wisc.edu/satellite-blog/wp-content/uploads/sites/5/2017/05/goes15_sounder_water_vapor_weghting_functions_USSA.jpeg)
GOES-15 sounder Water Vapor band weighting functions [click to enlarge]