
While longtime residents of the Great Lakes region are familiar with lake breezes, their opposite, land breezes can also impact local weather conditions. In the spring and summer, the density difference in the air over the warm land and the cool lake induces a breeze that blows cold air ashore. In the late fall and the early winter, however, that relationship is reversed. The land cools off quickly as polar air masses plunge southward from Canada, but the lakes retain their relative warmth for some time into the winter. This creates a breeze in the opposite direction as air from the cold land surface flows offshore onto the (comparatively) warm lake.
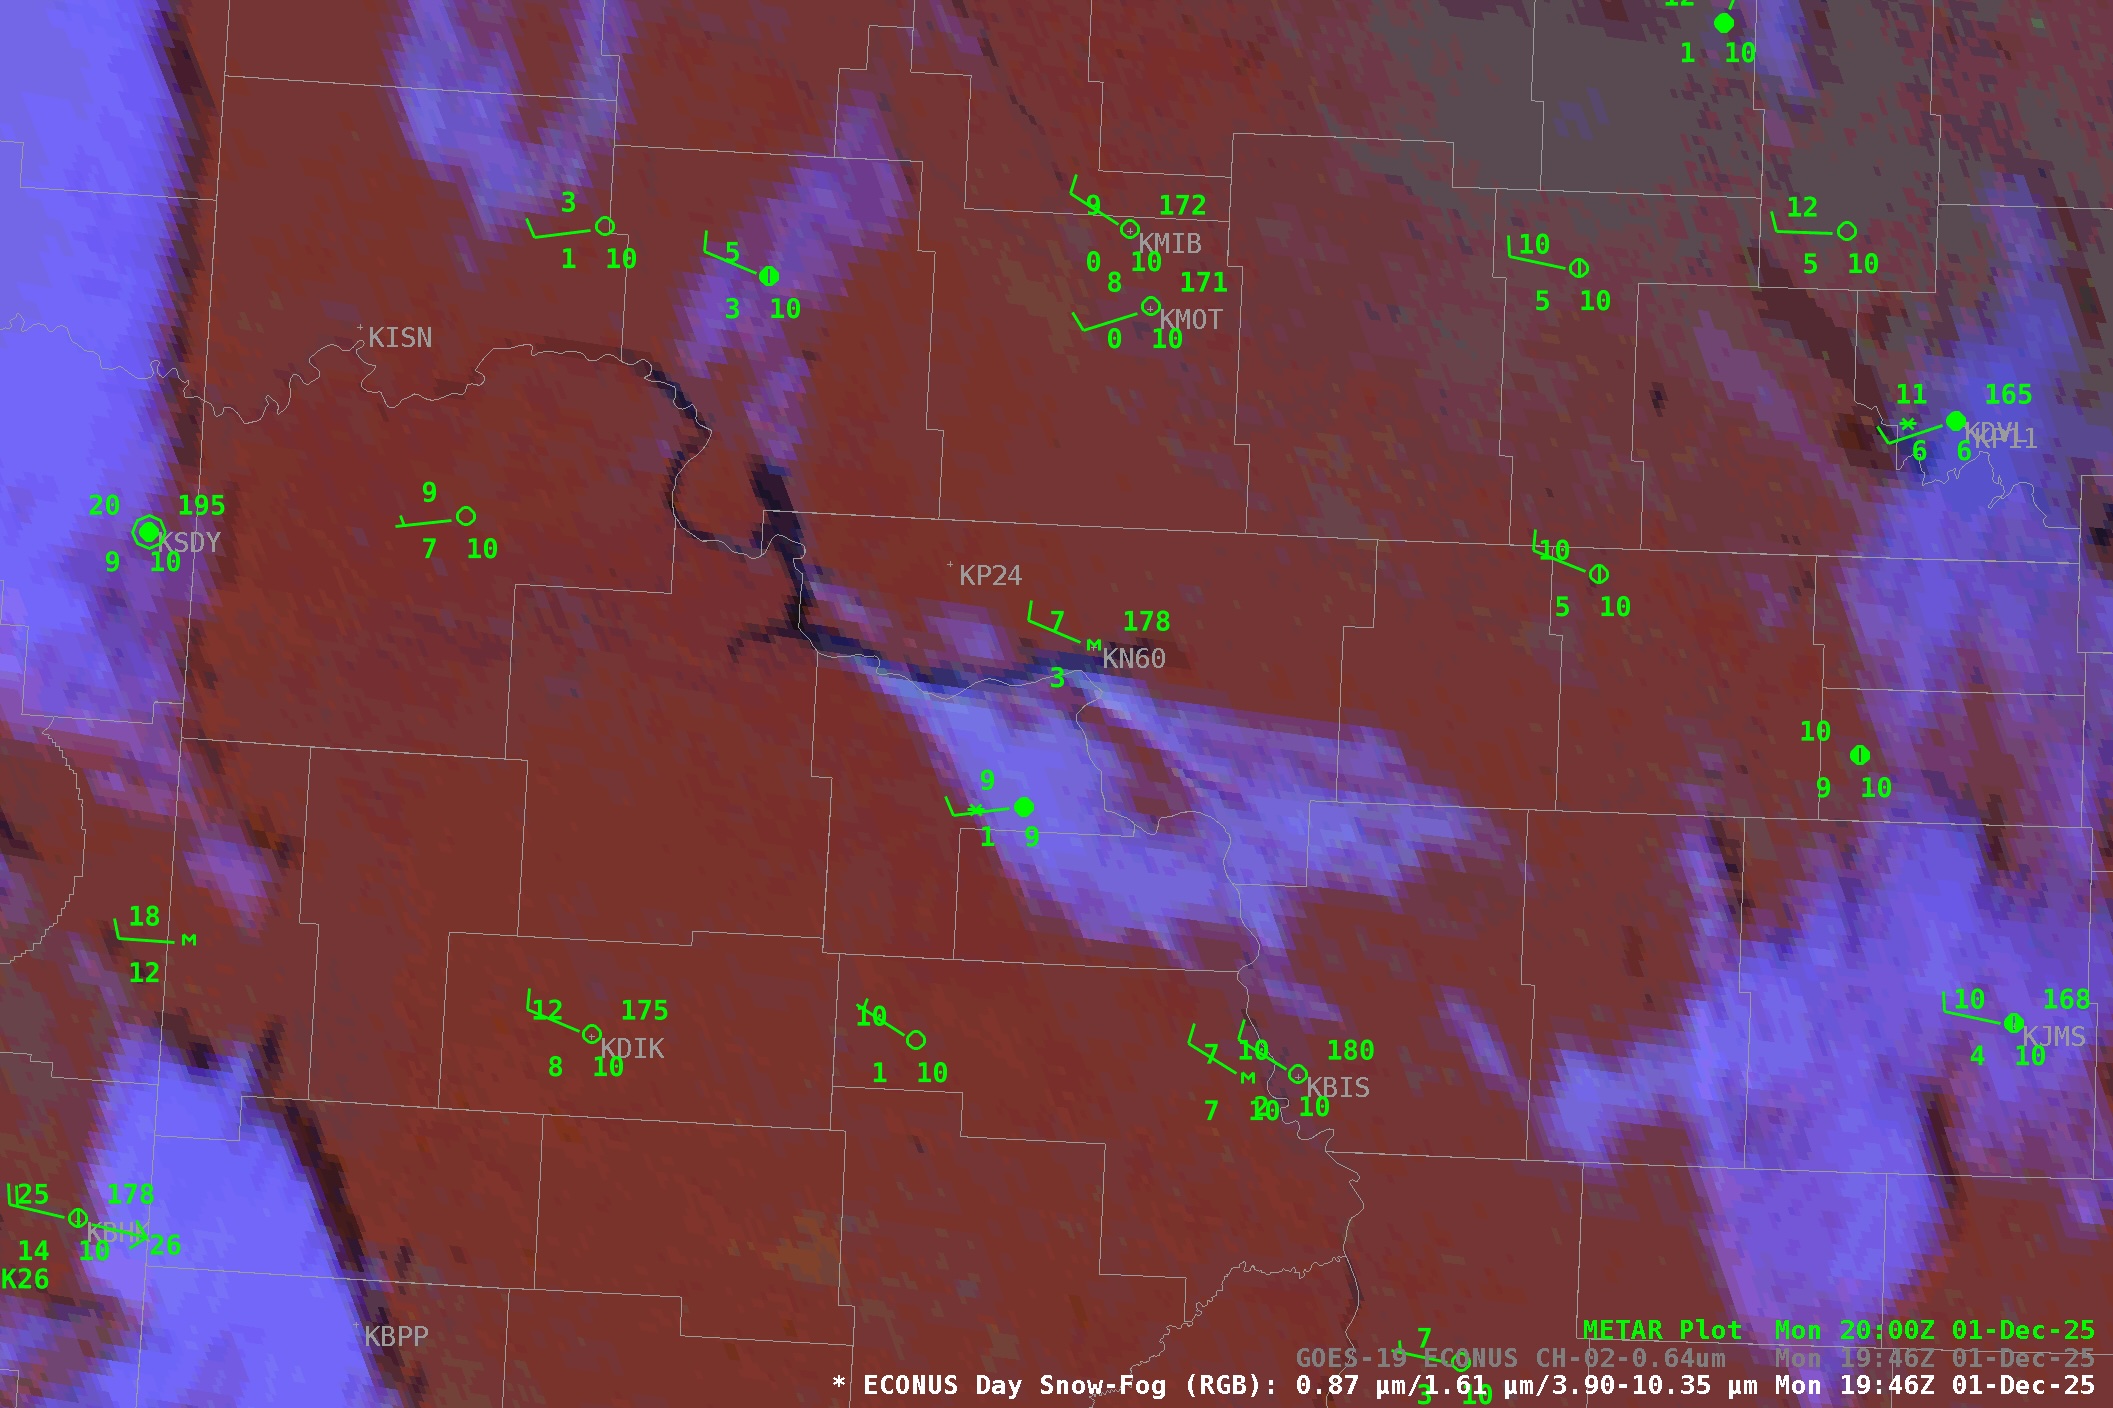
On the morning of 8 December 2025, land breezes from multiple shores of Lake Huron contributed to the development of snow over the lake through the creation of a convergence line in the middle of the lake which fostered enough vertical lift to induce snow. Let’s take a closer look at this case, starting with an animation of GOES-19 Channel 2, the high-resolution visible band. Start by looking at the temperatures: surface temperatures for the shoreline weather stations surrounding the lake are in the low 20s or upper teens Fahrenheit. The lake itself, however, is much warmer as can be seen with the 40 F buoy observation in the middle of the lake. However, even if the buoy were not present, you could still assume that the lake is warmer than the surrounding land as it hasn’t frozen yet and thus must be above 32 F. Thus, conditions that support a land breeze (strong lake-to-land temperature gradient, the absence of strong synoptic forcing) are present. That can also be seen in the surface wind observations. The shoreline weather stations all show westerly flow, even though stations in the center of the state are almost all calm. The weather station on Drummond Island, just to the east of the eastern tip of Michigan’s Upper peninsula, also shows flow oriented toward the lake with a substantially more northerly component than other stations in the area.
However, it’s hard to really see the convergent wind pattern with just a handful of stations on the edge of the lake. This is a sparsely populated region (especially on the Canadian side of the lake) and thus weather observations are rare. Fortunately, there was an ASCAT (Advanced Scatterometer) overpass at roughly this time. Scatterometers measure wind speed by measuring the surface roughness of large bodies of water; stronger winds mean rougher seas and the ASCAT retrieval algorithm can take this roughness and convert it to wind speed and direction. ASCAT instruments are mounted aboard both American and EUMETSAT polar orbiting satellites. While ASCAT winds don’t have the temporal continuity of a geostationary product, the fact that multiple polar orbiting satellites are available means that midlatitude locations are observed somewhat regularly with these systems.
In this particular case, the convergence pattern could hardly be clearer: flow from the lower peninsula of Michigan is largely westerly while flow from Ontario is largely northerly. Where they meet, a line of clouds has formed. These clouds are largely held in place by the opposing winds, and thus the cloud band doesn’t propagate ashore.
Of course, RGB images can help us better interpret what is happening in this environment. The following animation shows the Day Cloud Phase Distinction RGB for this scene. There are a few interesting things to see in this view. One is the clear demarcation of surface snow (green) from the ice clouds passing overhead (red). Of greater interest to this current discussion, however, is the change of color in the cloud band over the middle of the lake. Where the convergence pattern is weaker the clouds are not as vertical and thus they tend to be warmer, liquid clouds that show up as lavender. However, where the convergence pattern is more robust, the resulting clouds are deeper and changing phase into ice clouds. This appears as the yellow-green clouds in the animation.
Finally, with all this vertical growth taking place, is it precipitating? The Multi-Radar / Multi-Sensor System (MRMS) is a good tool for this task as it integrates both United States and Canadian radars into a unified radar mosaic product. These lake-impacted cloud events tend to be shallow, and the standard NWS radars may be too far away to clearly identify what is happening. However, MRMS clearly shows the development of precipitation. Given that these are ice clouds and the surface temperatures are well-below freezing, it is almost certain that this cloud band is producing snow.
View only this post Read Less


