Severe thunderstorms produce tornadoes, giant hail and damaging winds across parts of Texas and Oklahoma

1-minute GOES-19 Red Visible (0.64 µm) images with time-matched (+/- 3 minutes) SPC Storm Reports plotted in red, from 2000 UTC on 08 June to 0132 UTC on 09 June [click to play animated GIF | MP4]
In the corresponding 1-minute GOES-19 “Clean” Infrared Window (10.3 µm) images (below), the coldest cloud-top infrared brightness temperatures associated with some of the pulsing overshooting tops were -80ºC or colder (shades of magenta embedded within bright white regions).

1-minute GOES-19 Clean Infrared Window (10.3 µm) images with time-matched (+/- 3 minutes) SPC Storm Reports plotted in white, from 2000 UTC on 08 June to 0537 UTC on 09 June [click to play animated GIF | MP4]
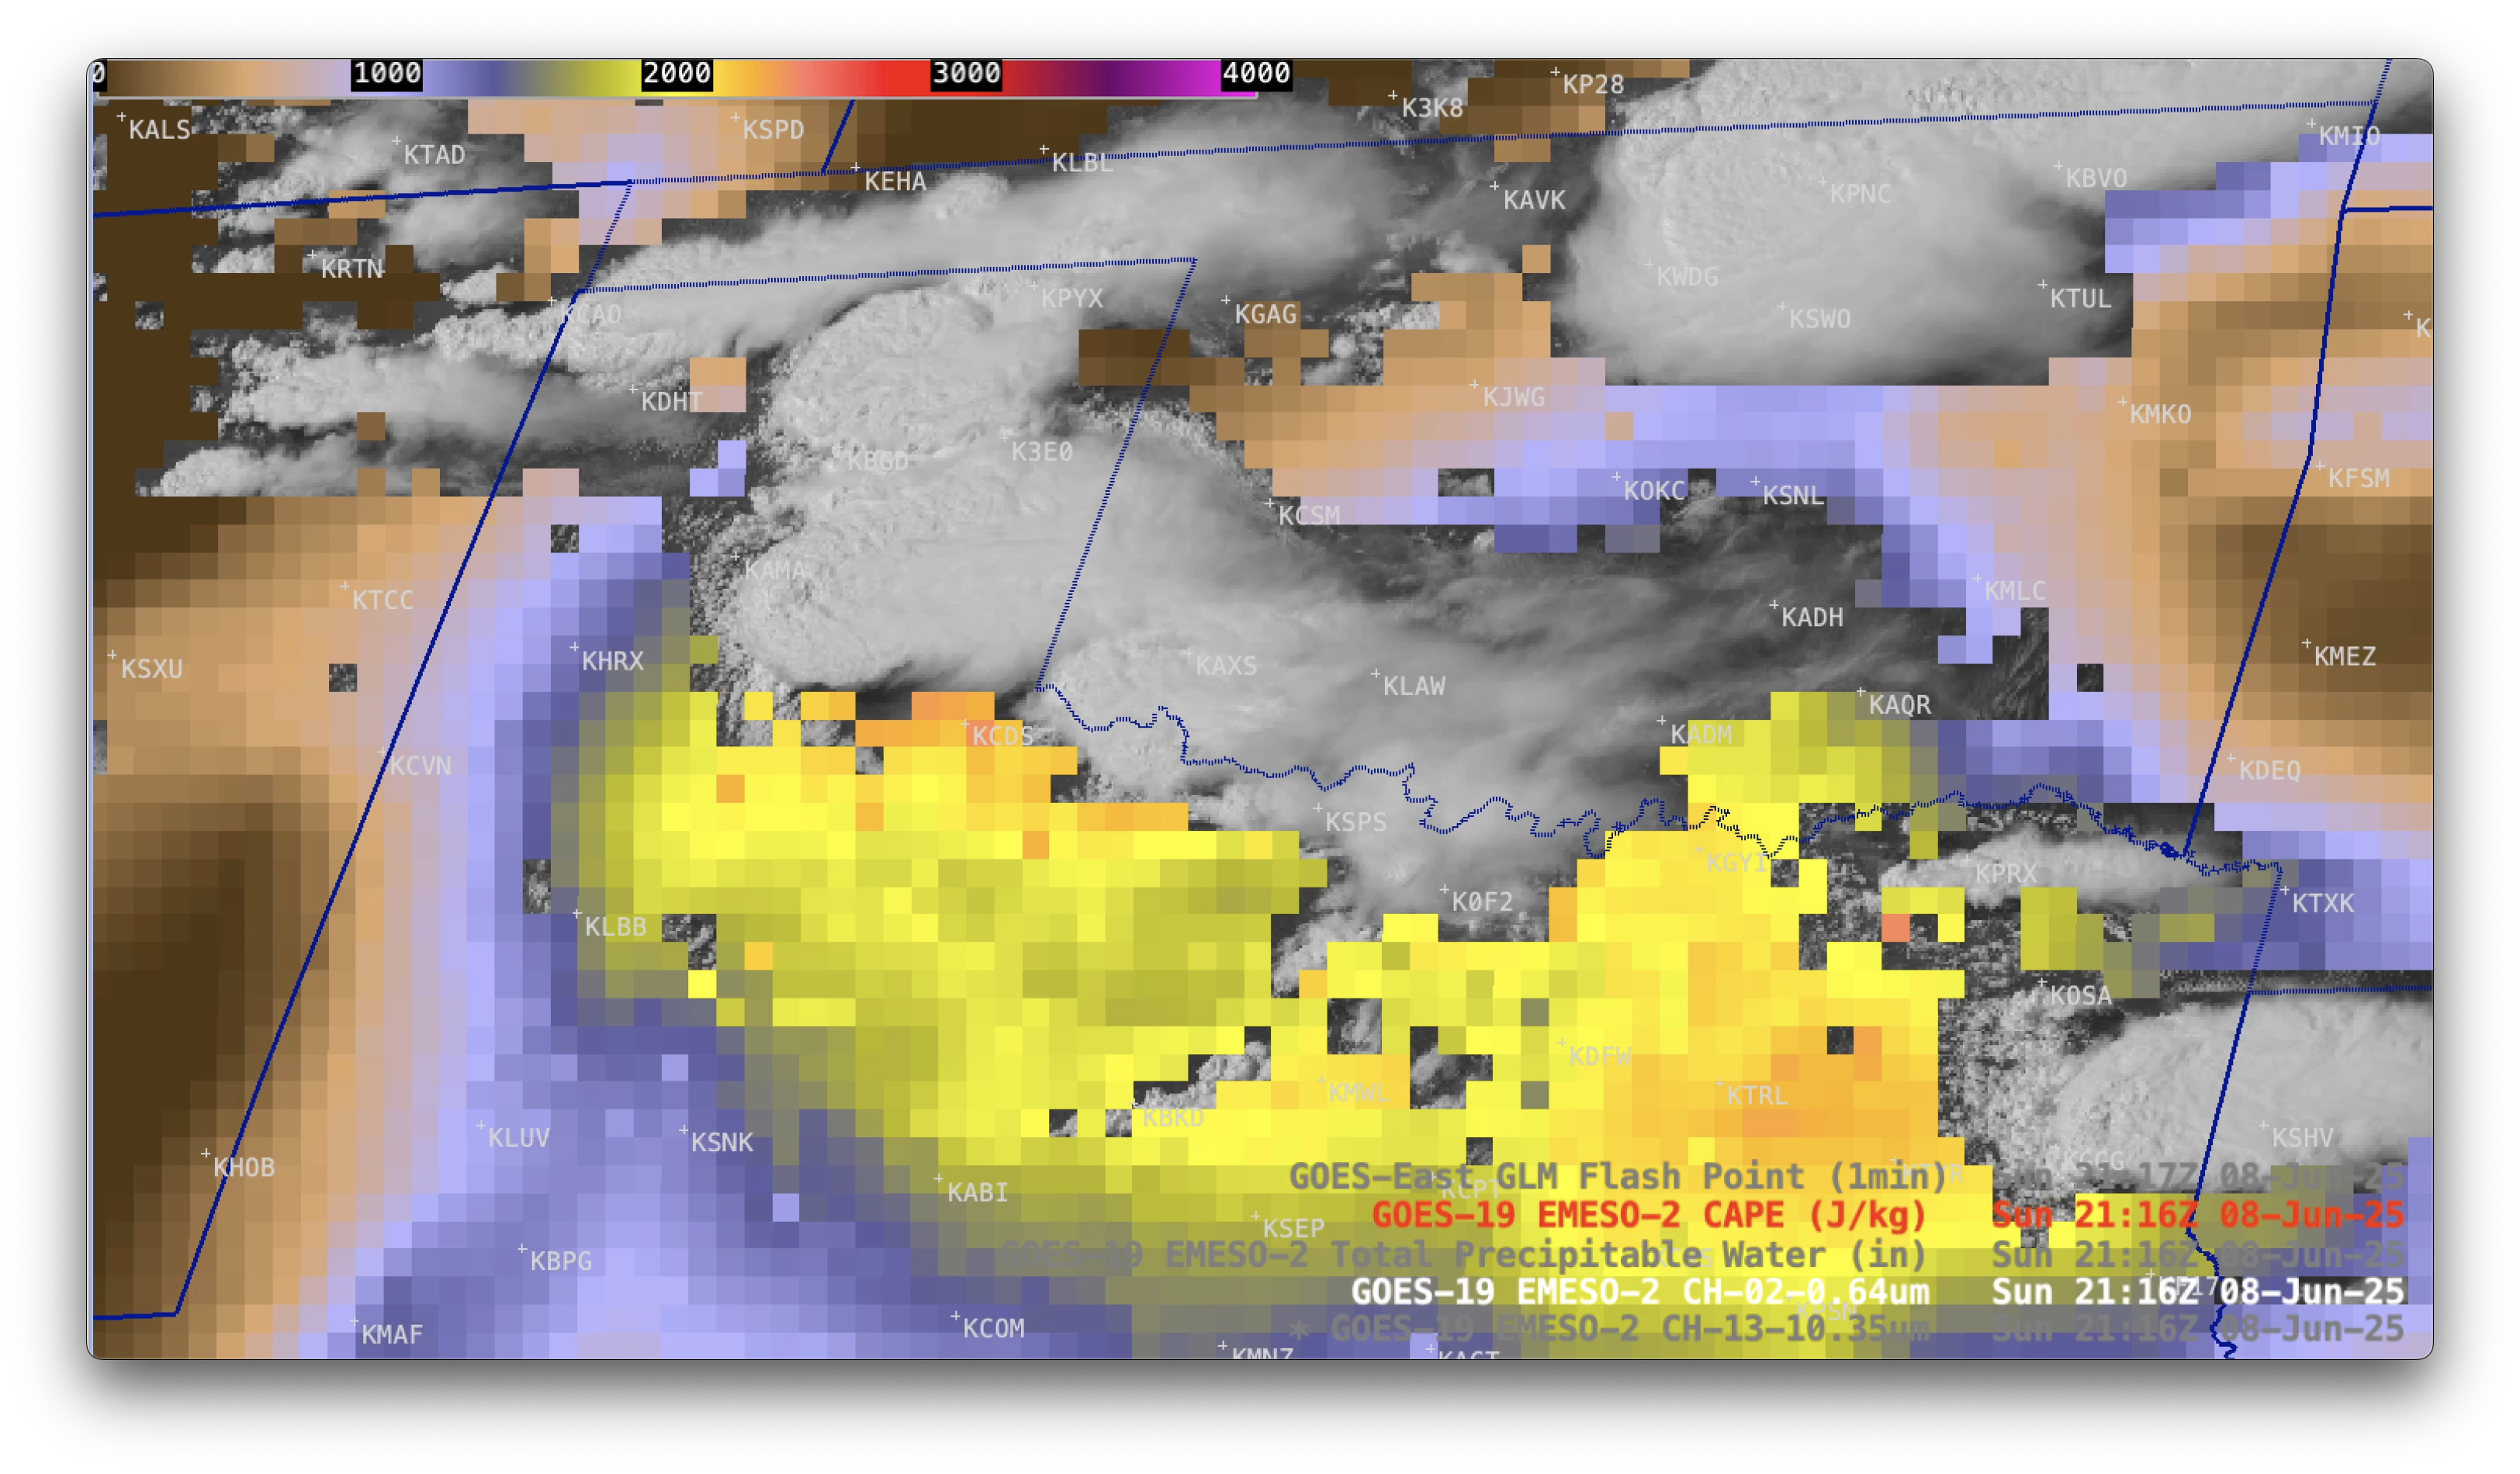
1-minute GOES-19 Red Visible (0.64 µm) images with an overlay of the GOES-19 CAPE derived product (in cloud-free areas), from 2001 UTC on 08 June to 0000 UTC on 09 June [click to play MP4 animation]
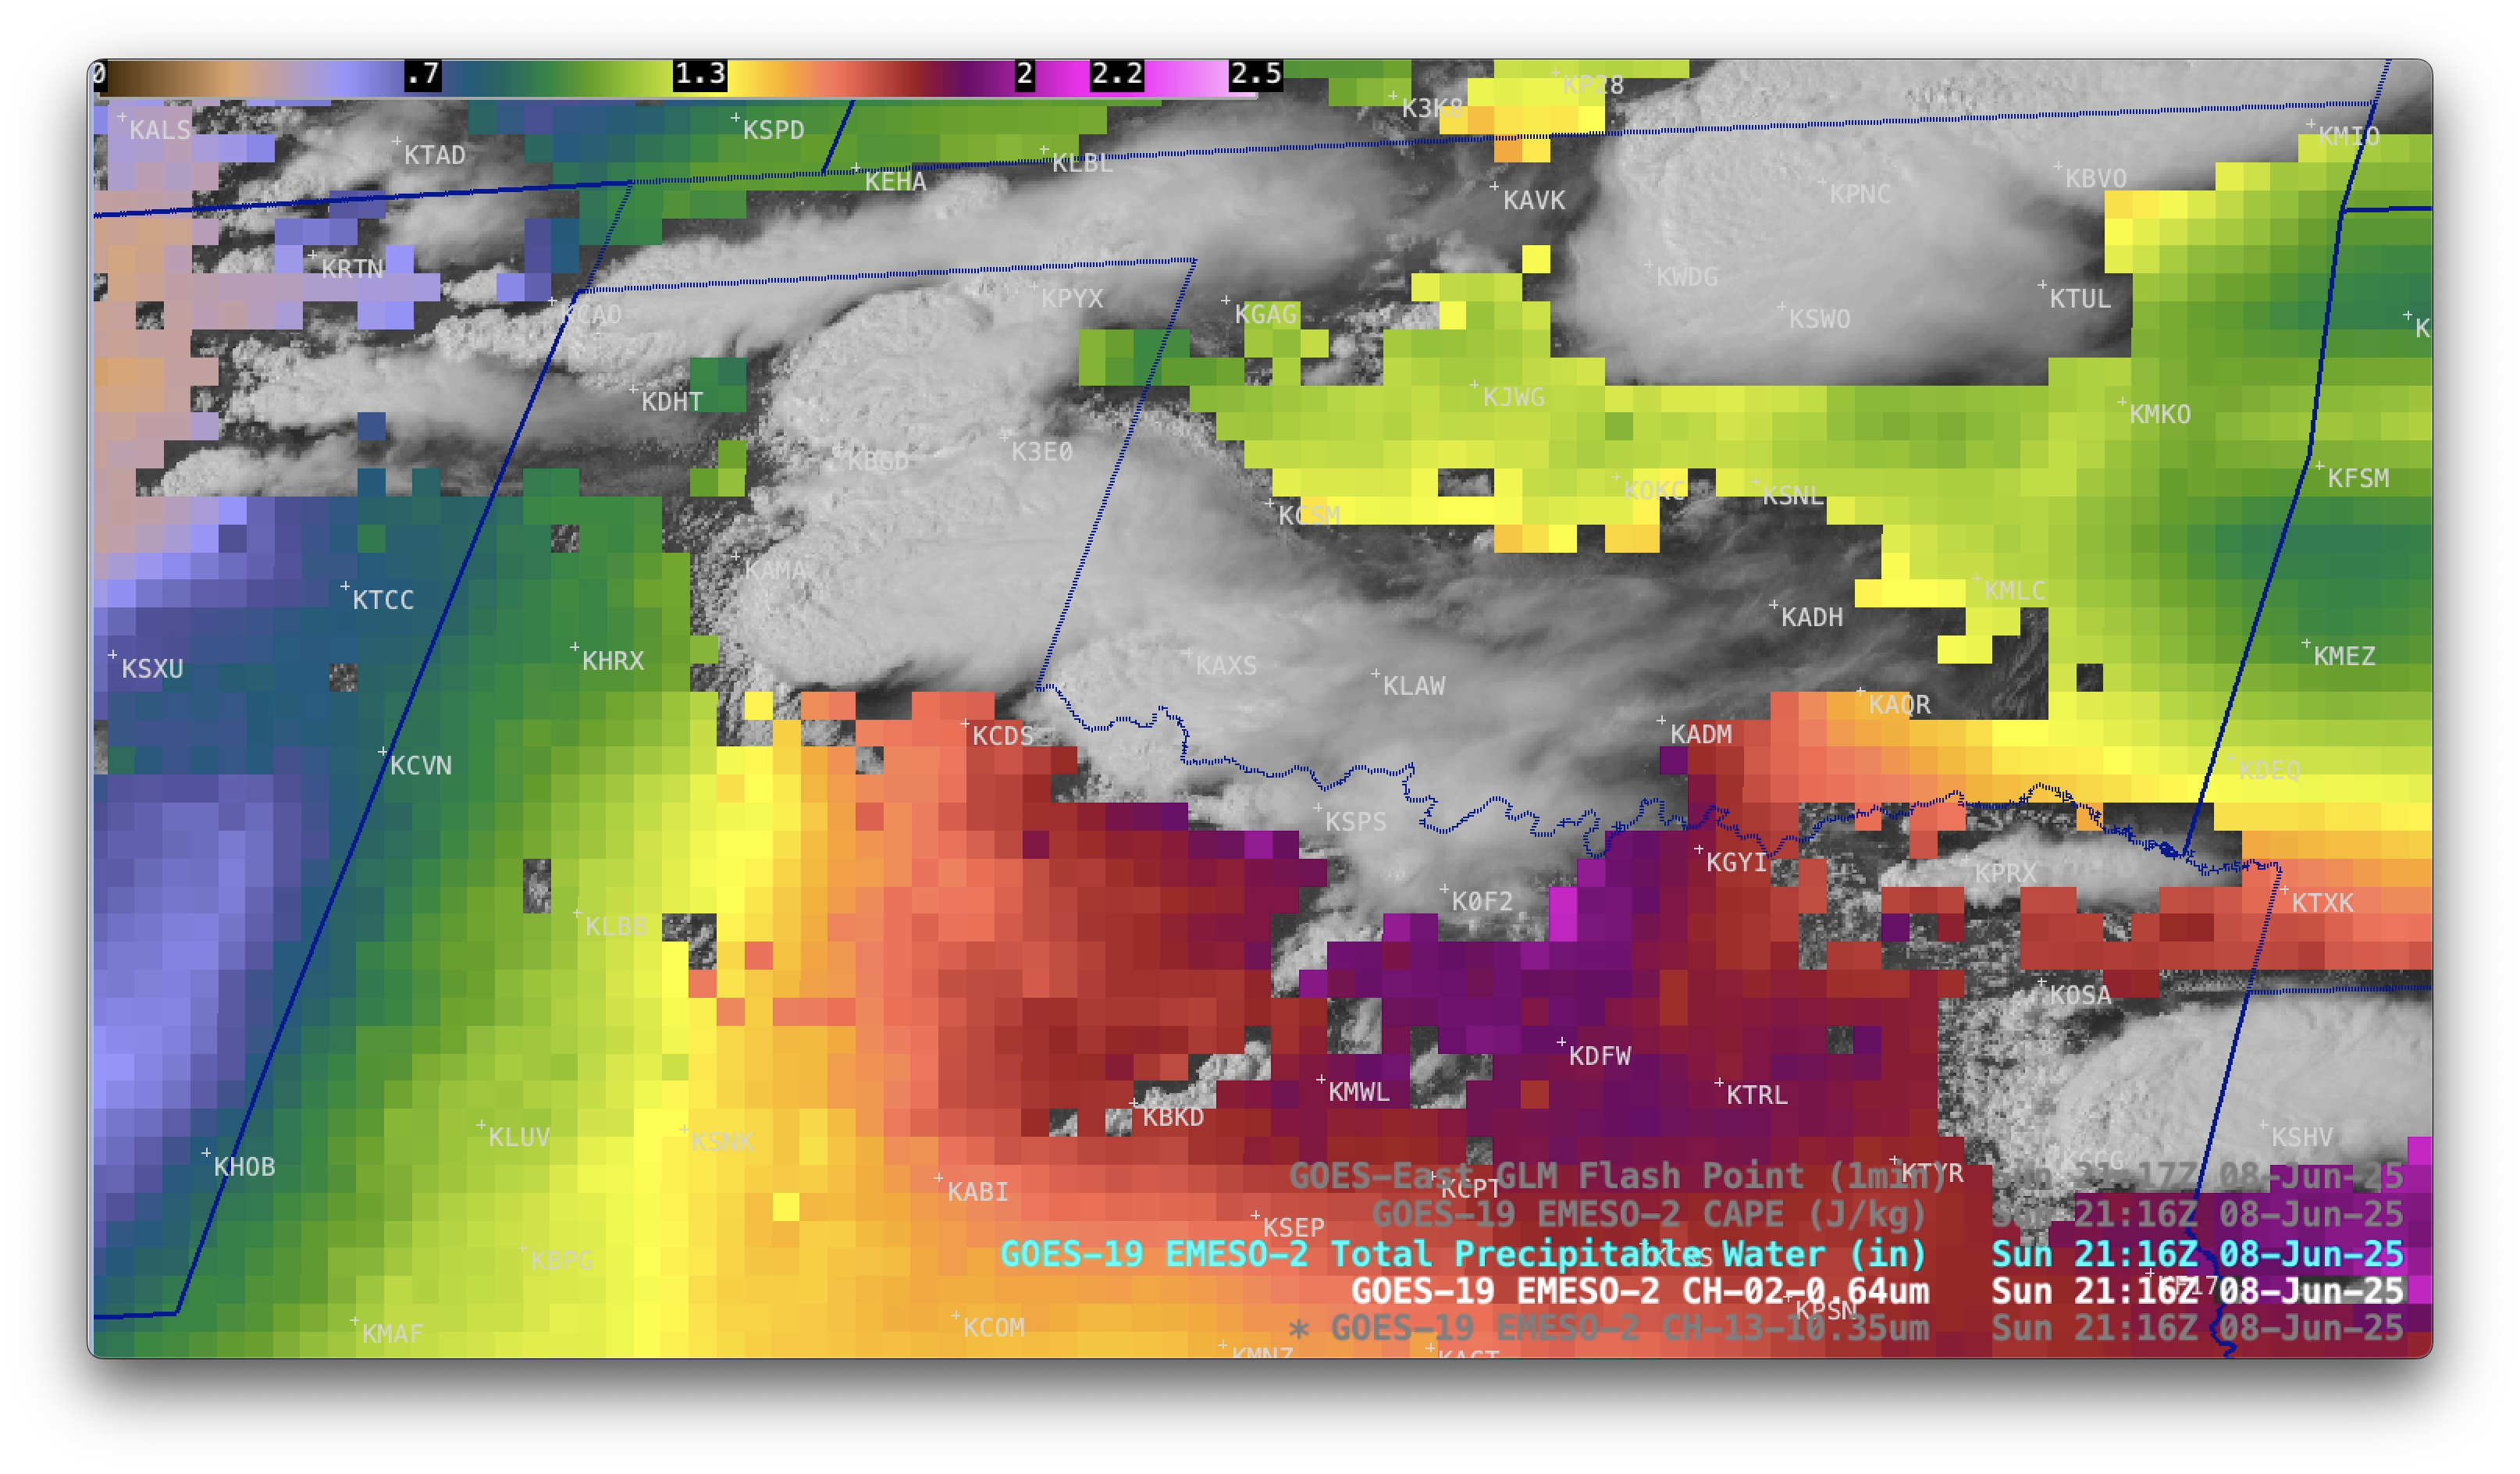
1-minute GOES-19 Red Visible (0.64 µm) images with an overlay of the GOES-19 Total Precipitable Water derived product (in cloud-free areas), from 2001 UTC on 08 June to 0000 UTC on 09 June [click to play MP4 animation]
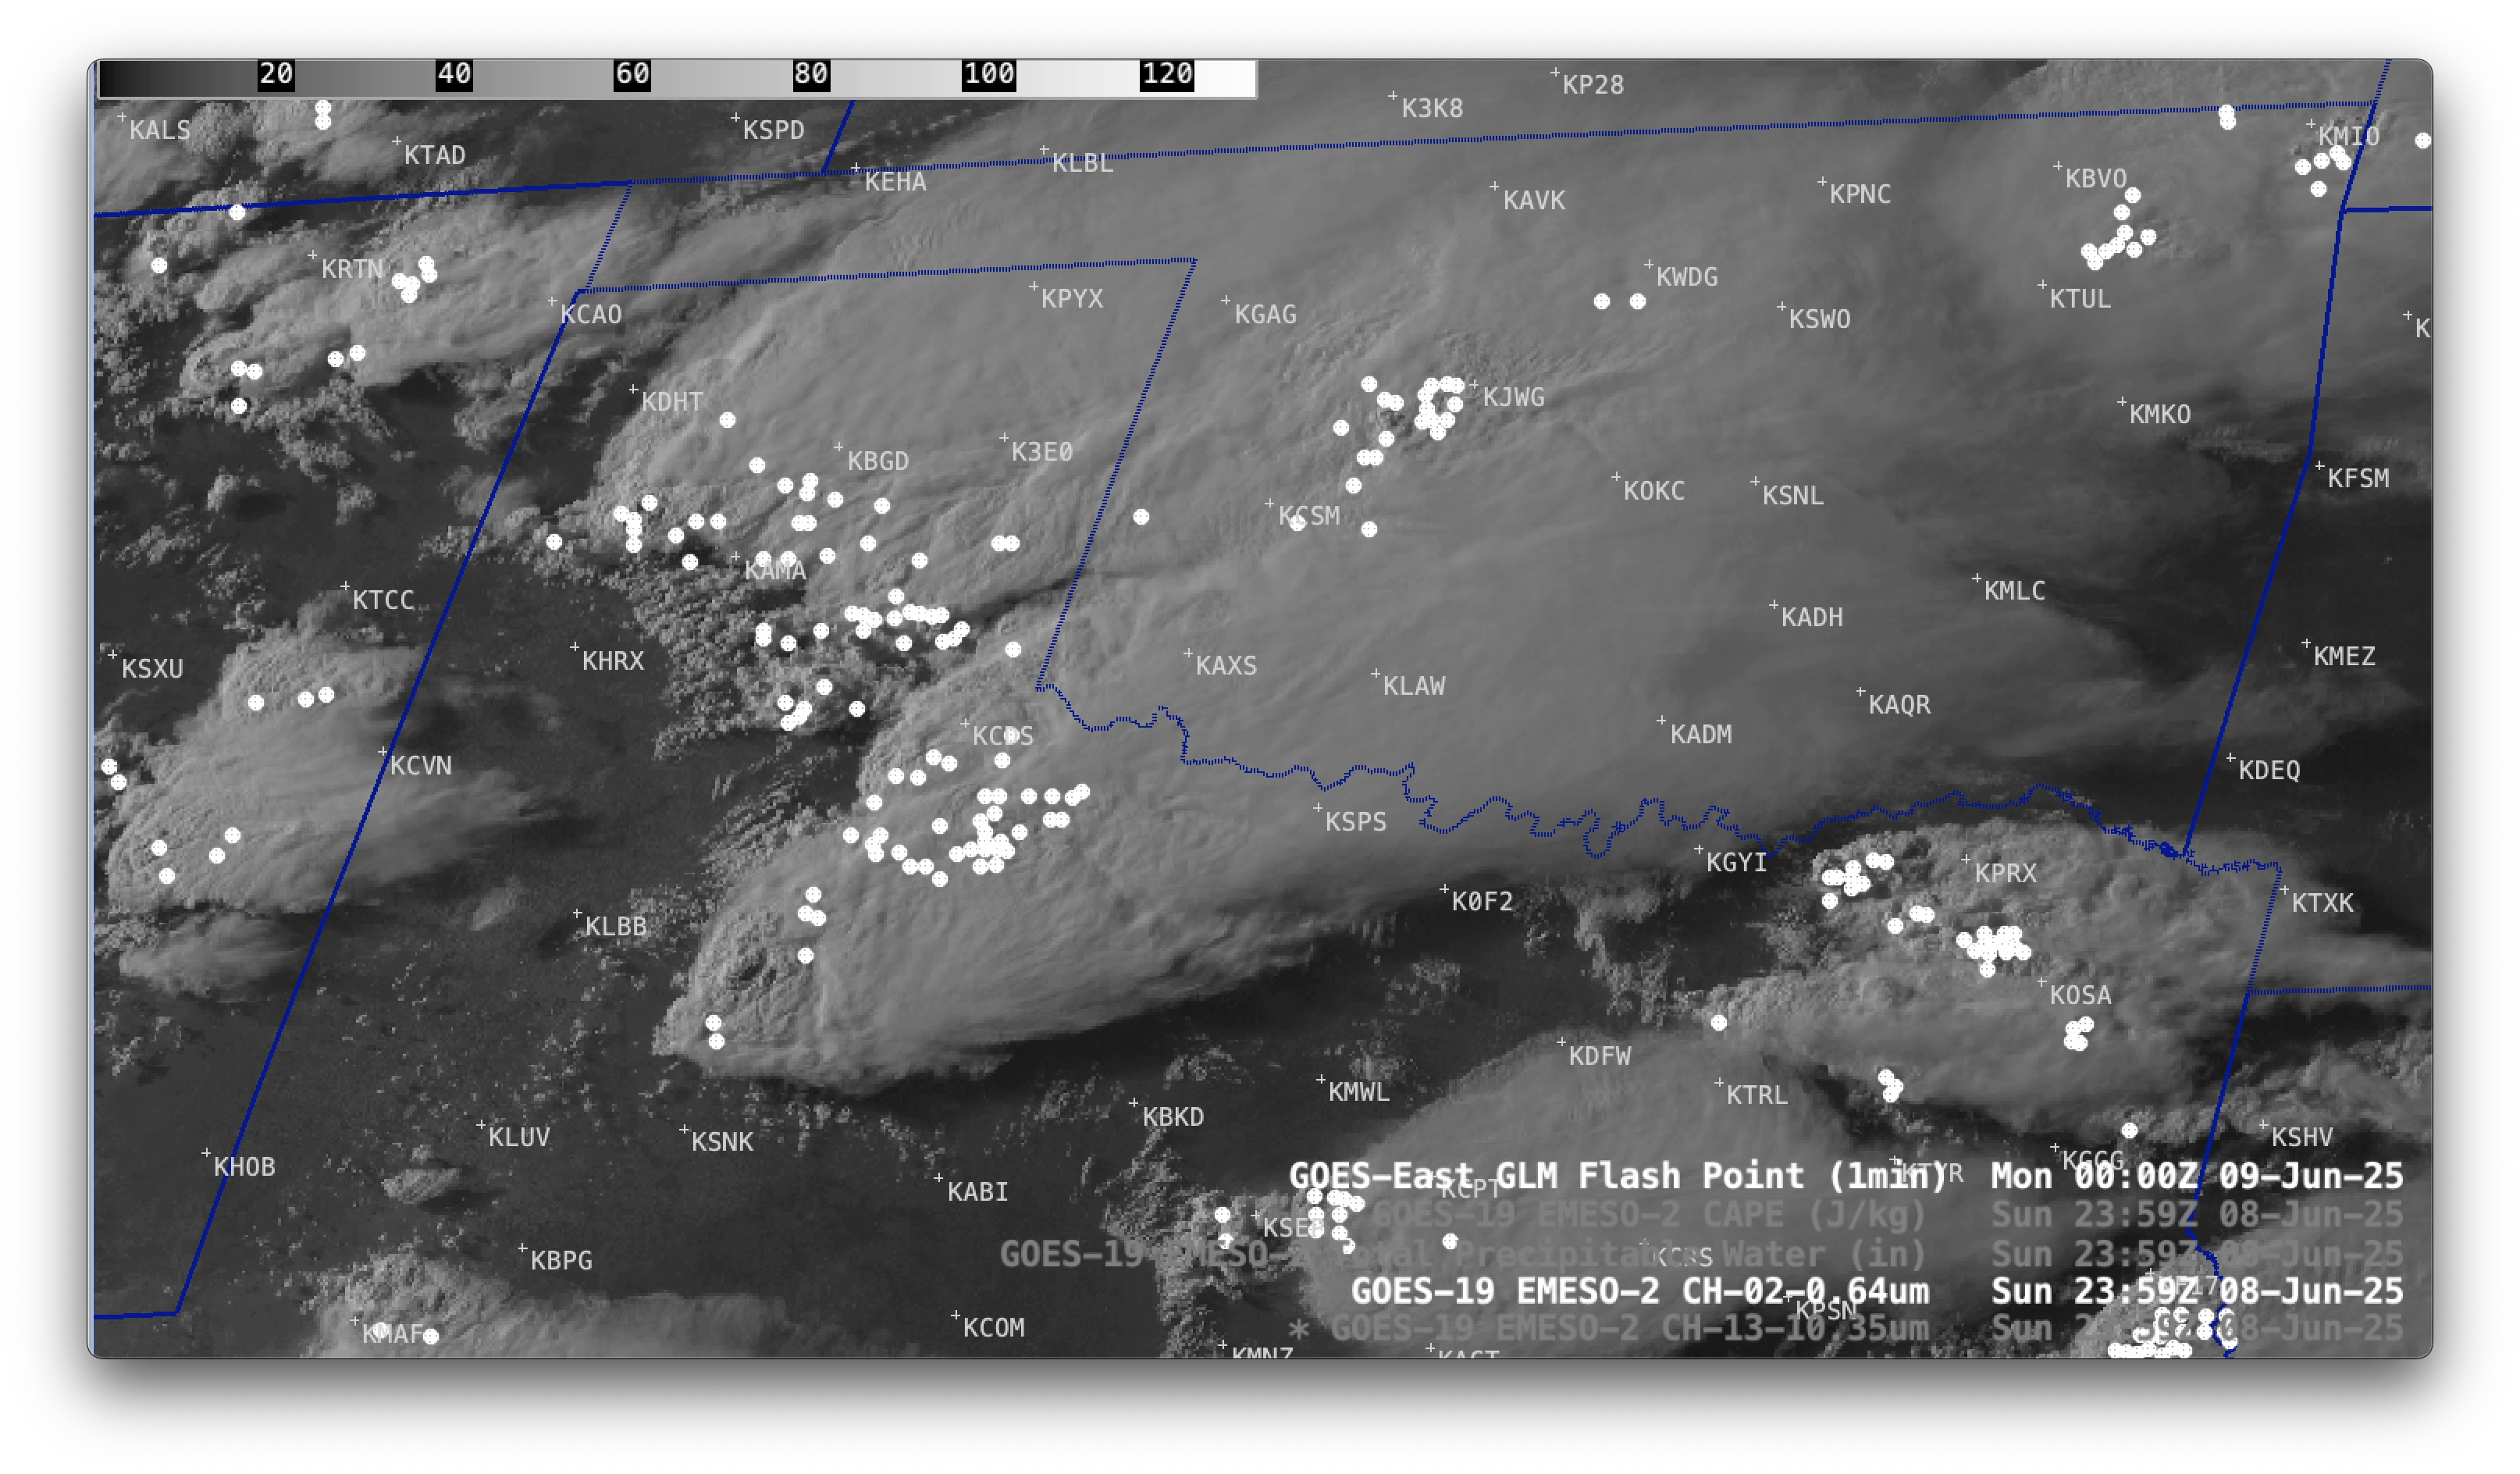
1-minute GOES-19 Red Visible (0.64 µm) images with an overlay of GOES-19 GLM Flash Points, from 2001-2359 UTC on 08 June [click to play MP4 animation]