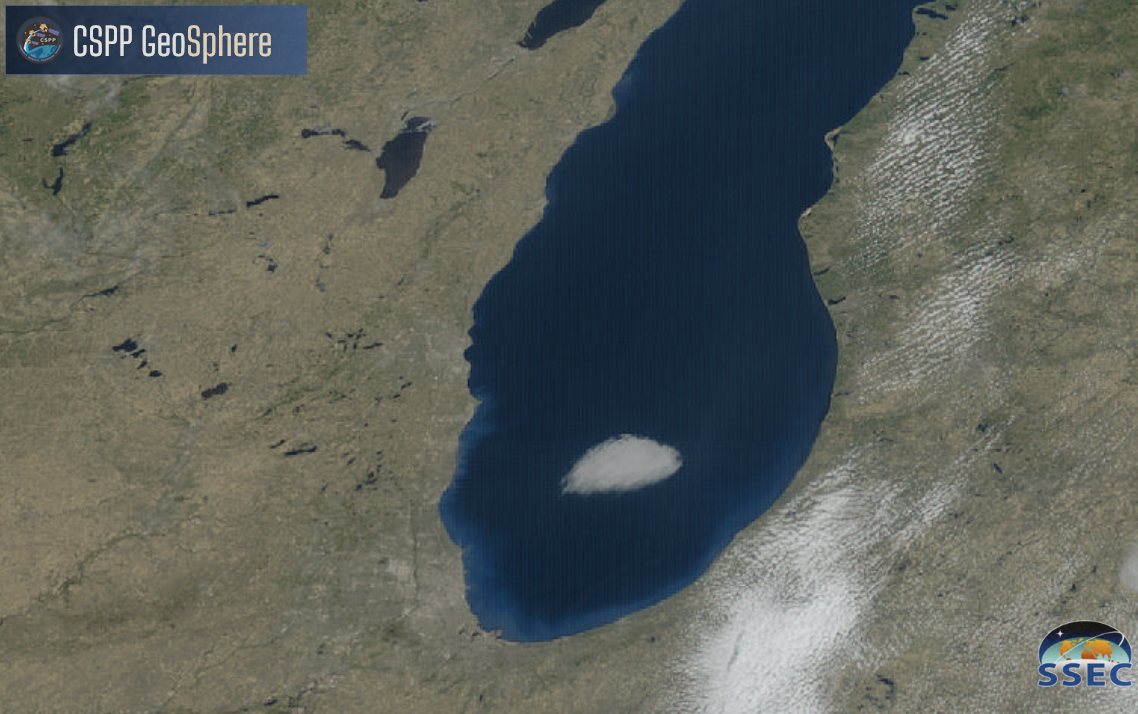
“Plume of unknown etiology” moving over Alaska

March 17th, 2011
GOES-11 0.65 µm visible channel images (click image to play animation)

GOES-11 0.65 µm visible channel images (click image to play animation)

McIDAS images of GOES-11 0.65 µm visible channel data (above; click image to play animation) showed an interesting “dark plume” feature that was moving in an arc from far northeastern Russia, across the East Siberian Sea and Chukchi Sea, and finally over far northwestern Alaska on 16 March – 17 March 2011.

When viewed from a more western angle using MTSAT-2 0.73 µm visible channel images (below; click image to play animation), the plume feature (which can be seen moving over far northwestern Alaska in the upper right portion of the images) also exhibited a darker appearance, similar to that seen on the GOES-11 visible imagery. This darker appearance was due to backward scattering of light from the particles within the plume.


MTSAT-2 0.73 µm visible channel images (click image to play animation)

MTSAT-2 0.73 µm visible channel images (click image to play animation)

AWIPS images of POES AVHRR 0.86 µm visible channel data (below) provided more of a “direct view from above”,  and revealed that the main body of the plume was basically transparent (allowing details of the sea ice to be seen through the plume).  However, the plume edges appeared to have some vertical structure, being thick enough to cast shadows onto the sea ice below.

POES AVHRR 0.86 µm visible channel images

POES AVHRR 0.86 µm visible channel images

It is interesting to note that this plume feature did not exhibit any notable signature on POES AVHRR 12.0 µm IR images (below).

POES AVHRR 12.0 µm IR images

POES AVHRR 12.0 µm IR images

A series of MODIS true color Red/Green/Blue (RGB) images (below; courtesy of the GINA, University of Alaska) again showed the transparent nature of the main body of the plume feature, except for the thicker edges which  were casting shadows.

MODIS true color Red/Green/Blue (RGB) images (courtesy of University of Alaska, GINA)

MODIS true color Red/Green/Blue (RGB) images (courtesy of University of Alaska, GINA)

Could this feature have been an aged volcanic plume that was being transported aloft over the Arctic? AWIPS images of the MODIS Volcanic Ash Mass Loading product (below) did display a few isolated very small patches exhibiting 1-10 tons per square kilometer of loading at 04:44 UTC on 17 March, but there was no temporal continuity when examining the Ash Mass Loading product before or after this particular time.

MODIS Volcanic Ash Mass Loading product

MODIS Volcanic Ash Mass Loading product

Volcanic Ash Height product

Volcanic Ash Height product

The corresponding MODIS Volcanic Ash Height product (above) indicated that these features were located at an altitude of 3-4 km, while the MODIS Ash Mass Effective Particle Radius product (below) showed values in the 3-5 µm range.

Volcanic Ash Particle Effective Radius product

Volcanic Ash Particle Effective Radius product

However, rather than an aged volcanic ash plume, a more plausible explanation of the feature seen on satellite imagery is the long-range transport of smoke and pollution from industrial sources in northeastern China. A calculation of 96-hour backward trajectories using the NOAA ARL HYSPLIT model (below) indicated that air parcels arriving at 3 points along the plume at an altitude of 6-km had originated within the boundary layer over northeastern China on 13 March. MODIS images showing the thick haze over that region can be found on the US Air Quality “Smog Blog”.

NOAA ARL HYSPLIT back trajectories arriving at  the 4km, 6km, and 8km altitudes

NOAA ARL HYSPLIT back trajectories arriving at the 4km, 6km, and 8km altitudes

Small-scale vortex over the tropical Atlantic Ocean

September 25th, 2010
GOES-13 0.63 µm visible image (courtesy of Tony Cristaldi, NWS Melbourne FL)

GOES-13 0.63 µm visible image (courtesy of Tony Cristaldi, NWS Melbourne FL)

Tony Cristaldi (National Weather Service Forecast Office in Melbourne, Florida) sent the following email (with the attached GOES-13 visible image shown above):

There is a very small cyclonic swirl to the southwest of Lisa near 12N 35W, that has been firing off central convection since Friday afternoon. Now, one wouldn’t expect a feature of this magnitude to be carried operationally as a TC, since these features are often times transient, being very vulnerable to even modest amounts of low level deformation and mid of upper level wind shear. Nevertheless, since it has persisted since early this morning, I thought I’d pose a couple questions: 1) Looking at visible imagery, does it appear that convection is persisting due to a warm core TC process (CISK) on a very small scale, or a more traditional low level mesoscale convective process? 2) Would you call this feature a “micro-midget?”

At his request, we created a 2-day animation covering the period 24-25 September 2010, using GOES-13 0.63 µm visible images during the daytime and GOES-13 3.9 µm shortwave IR images at night (below). The low-level “swirl” appeared to be propagating southeastward, and it was indeed firing off some impressive convective bursts (with a few cloud top IR brightness temperature values as cold as -70º C).

GOES-13 0.63 µm visible images (daytime) and 3.9 µm shortwave IR images (night-time)

GOES-13 0.63 µm visible images (daytime) and 3.9 µm shortwave IR images (night-time)

Not quite sure exactly what to call it…but thanks to Tony for bringing this interesting feature to our attention!

Long-lived low cloud edge over the Eastern Pacific Ocean

August 25th, 2010

Visible and infrared GOES-11 imagery over the eastern Pacific Ocean have indicated a persistent southwestward-moving cloud edge during the past several days. The visible image, above, from 1830 UTC on 25 August, shows a distinct cloud edge arcing from northwest to southeast. What is the history of this feature? The visible imagery loop below, showing 1800 UTC images over the course of 4 days, show that the feature likely has its roots in dry air exiting the North American continent. A loop of 11-micron imagery from GOES-11 every two hours (here) shows the steady progression of the feature, and the persistent sharpness of the edge. Brightness temperatures of the clouds are steady near 287-288 K; brightness temperatures in the clear region are 290-291 K.